Abstract— Electrocardiogram (ECG) is characterized by a recurrent wave sequence of P, QRS and T- wave associated with each beat. This paper presents a new method for the detection of P and T-waves in 12-lead ECG using Support Vector Machine (SVM). Digital filtering techniques are used to remove power line interference and base line wander present in the ECG signal. SVM is used as a classifier for the detection of P and T-waves. The performance of the algorithm is evaluated using 50, original simultaneously recorded 12-lead ECG recordings from the standard CSE ECG database. Significant detection rate is achieved. The method successfully detects monophasic as well as biphasic waves.
Index Terms— ECG, SVM, QRS complex, P-wave, T-wave.
I. INTRODUCTION
The Electrocardiogram (ECG) is quite an important tool to find out the functional status of the heart. The ECG pattern consists of a recurrent wave sequence of P, QRS and T- wave associated with each beat. The automatic detection of ECG waves is important to cardiac disease diagnosis. In a clinical setting, such as intensive care units, it is essential for automated systems to accurately detect and classify ECG wave components. The correct performance of these systems depends on several important factors, including the quality of the ECG signal, the applied classification rule, the learning and testing dataset used.
As displayed in Fig. 1, the first deflection, termed the P-wave is due to the depolarization of the atria. The large QRS-complex is due to the depolarization the ventricles. In an ECG signal, this is the complex with highest amplitude and is easy to detect. Numerous methods are reported in literature for the detection of QRS-complex [1]. The last deflection is T-wave corresponds to the ventricular repolarization of the heart. Reliable detection of P and T wave is more difficult than QRS complex detection for several reasons including low amplitudes, low signal-to-noise ratio, amplitude and morphological variability and possible overlapping of the P
Manuscript received May 20, 2008.
S. S. Mehta is with the Department of Electrical Engineering, MBM Engineering College, J. N. V. University. Jodhpur- 342001, Rajasthan (India). (e-mail: [email protected])
N. S. Lingayat is with Department of Electrical Engineering, Institute of Petrochemical Engineering, Dr. B. A. Technological University, Lonere-402103, Maharashtra (India). Presently he is on deputation as a research scholar at Department of Electrical Engineering, MBM Engineering College, J. N. V. University. Jodhpur- 342001, Rajasthan (India). (phone: +91 291
wave with the QRS complex. The P wave may be even absent from some ECG recordings. Over the last few years, the P and T wave detection and delineation problem has been addressed using different approaches [2-10]. In most of these methods P and T waves are detected relative to the position of QRS-complex by applying appropriate threshold. The main problems of the thresholding techniques are their high noise sensitivity and their low efficiency when dealing with odd morphologies. This results in more false positive and false negative detections. Further, some of the algorithms detects only monophasic P and T waves and not suitable for biphasic P and T waves. Goutas et al. [11] developed an algorithm for detection and delineation of P and T waves in single lead ECG based on digital fractional order differentiation. The algorithm accurately detect only monophasic P and T waves and not suitable for biphasic waves. The algorithm proposed by Sun et al. [12] is based on MMD transform performs better as compare to algorithm based on wavelet transform and adaptive thresholding technique, but still gives false detection in biphasic waves. Therefore, more sophisticated techniques are needed to facilitate the development of new detection schemes with higher detection accuracy and suitable for monophasic as well as biphasic P and T waves.
Fig.1 ECG signal
SVMs based classification method represents a major development in pattern recognition research. Two innovations of SVMs are responsible for the success of this method, namely, the ability to find a hyperplane that divides samples into two classes with the widest margin between them, and the extension of this concept to a higher dimensional setting using kernel function to represent a similarity measure on that setting. Both innovations can be formulated in a quadratic programming framework whose optimum solution is obtained in a computation time of a polynomial order. This makes
Detection of P and T-waves in
Electrocardiogram
SVMs a practical and effective solution for many pattern recognition and classification problems in bioinformatics. Brown et al. [13] described a successful use of SVMs applied to gene expression data for the task of classifying unseen genes. Dehmeshki et al. [14] used SVM for the classification of lung data. Chu et al. [15] applied SVMs for cancer diagnosis based on micro-array gene expression data and protein secondary structure prediction. SVMs are also applied for ECG signal analysis and arrhythmia classification [16-22], where in component wave detection is accomplished by using some other technique.
This paper presents a new method for the detection of P and T-waves in the simultaneously recorded 12-lead ECG signal using SVM. The method is suitable for the detection of monophasic as well as biphasic P and T waves.
II. SUPPORT VECTOR MACHINE
SVM is a new paradigm of learning system. The technique of SVM, developed by Vapnik [23], is a powerful widely used technique for solving supervised classification problems due to its generalization ability. In essence, SVM classifiers maximize the margin between training data and the decision boundary (optimal separating hyperplane), which can be formulated as a quadratic optimization problem in a feature space. The subset of patterns those are closest to the decision boundary are called as support vectors.
Consider a set of training examples(x1,y1),...,(xl,
y
l),where input N
i∈R
x and class labelsyi∈
{
−1,+1}
. For a linearly separable classification problem, the construction of a hyperplane is wT x + b =0 so that the margin between the hyperplane and the nearest point is maximized and can be posed as the following quadratic optimization problem:
( )
w w wT 2 1
min (1) subject to y (( T i)+b≥1
i w x , i = 1, ……, l. (2) Equation (2) forces a rescaling on (w, b) so that the point nearest to the hyperplane has a distance of
(
1 w)
[24]. In many practical situations, a separating hyperplane does not exist. To allow for possibilities of violating (2), slack variables, ξiare introduced likeξi≥0, i = 1, ……, l. (3) to get
T i i
i b
y((w x )+ )≥1−ξ , i = 1, ……, l. (4) The optimization problem now becomes as follows:
( )
∑
= + l i i T C 1 , 2 1min
ξξ w w
w
(5)
subject to constraints (3) and (4).
The C is a user defined constant. It is called regularizing parameter and determines the balance between the maximization of the margin and minimization of the classification error.By introducing Lagrange multipliers αiand using
Karush-Kuhn-Tucker theorem of optimization theory [24], the solution is given by;
∑
= = l 1 i i i i y xw
α (6)Only a small fraction of the αi coefficients are nonzero. The
corresponding pairs of xientries are known as support vectors
and they fully define the decision boundary. All other training examples with corresponding zero αi values are now rendered
irrelevant and automatically satisfy constraint (5) with ξi =0.
The hyperplane decision function for the vector x can
be written as follows:
⎥⎦ ⎤ ⎢⎣ ⎡∑ + =
= yi i i b sgn
f l
i
T
1 ( )
)
(x α x x (7)
By replacing the inner product ( i) T
x
x with kernel function
K(x, xi); the input data are mapped to a higher dimensional
space [24]. It is then in this higher dimensional space that a separating hyperplane is constructed to maximize the margin.
III. PAND T-WAVE DETECTION ALGORITHM
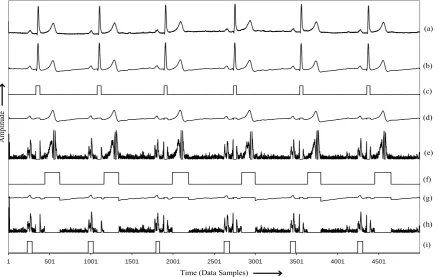
This section describes an algorithm developed for the detection of P and T waves in simultaneously recorded 12-lead ECG signal. Fig 2 displays the result obtained at each step for record MO1_015. Out of the 12-leads, results on lead V2 are shown.
Step 1: A raw digital 12-lead simultaneously recorded ECG
signal of a patient is acquired. Fig. 2(a) shows raw signal of lead V2 of record MO1_015.
Step 2: A raw ECG signal is often contaminated by
disturbances such as power line interference and baseline wander. The finite impulse response (FIR) notch filter proposed by Van Alste and Schilder [25] is used to remove baseline wander. The adaptive filter to remove base line wander is a special case of notch filter, with notch at zero frequency (or dc). This filter has a “zero” at dc and consequently creates a notch with a bandwidth of (µ/π)*fs ,
where fs is the sampling frequency of the signal and µ is the
convergence parameter. Frequencies in the range 0-0.5Hz are removed to reduce the base line drift. The filter proposed by Furno and Tompkins [26] is used to remove 50Hz power line interference. Fig. 2(b) displays the filtered ECG signal after removal of power line interference and base line wander.
Step 3: An entropy based method proposed in [27] is used for
the detection of QRS-complexes. These QRS complexes are removed from the ECG signal by replacing them by a based line. Fig. 2(c) shows the locations of the QRS complexes by this method. The signal without QRS complexes is displayed in Fig. 2(d).
Step 4: The slope at every sampling instant is calculated to
enhance the signal in the region of T-waves. These slope values are then normalized. This way a set of twelve normalized slope curves is obtained, one for each lead. The slope is used as an important criterion because slope of the signal is much more in the T wave region than in the region of P wave as displayed in Fig. 2(e).
Step 5: The input to the support vector classifier is a set of
vectors xicontainingtwelve normalized slope values, one from
instant. During the training of SVM, a sliding window is moved forward by one sampling instant over the normalized slope curves. When the window lies in the region of T-waves, the desired output of the SVM is set to 1 and when it lies in the other region, the desired output is set to -1. The SVM is trained on a set of training data covering wide variety of ECG signals with different morphologies of T-waves picked from CSE ECG database.
Step 6: On testing, normalized value of twelve slopes, one
from each of the twelve leads of ECG at a sampling instant is used to form the input vector for the SVM. Then the window is moved forward by one sampling instant and a set of twelve slopes, again one from each of the twelve leads of ECG were taken to form next input pattern vector. A train of 1’s is obtained at the output of SVM, when the window traverses through the T-wave region and -1 for the remaining region. The train of 1’s is picked and using their duration, average pulse duration of 1’s is evaluated. Those trains of 1’s, whose duration turns out to be more than the average pulse duration are detected as T-waves and the other ones are discarded. The locations of the T wave are shown by the curve Fig. 2(f).
Step 7: The T waves present in the ECG signal are removed
by replacing them by a baseline. The ECG signal without the QRS complexes and the T-waves is shown in Fig. 2(g).
Step 8: The slope at every sampling instant is again calculated
to enhance the signal in the region of P-waves. These slope values are then normalized. This way a set of twelve normalized slope curves is obtained, one for each lead. The slope of the signal is much more in the P wave region than in the other region of the signal as displayed in Fig. 2(h).
Step 9: The input to the support vector classifier is a set of
vectors xicontainingtwelve normalized slope values, one from
each of the twelve leads of ECG at a particular sampling instant. During the training of SVM, a sliding window is moved forward by one sampling instant over the normalized slope curves. When the window lies in the region of P-waves, the desired output of the SVM is set to 1 and when it lies in the other region, the desired output is set to -1. The SVM is trained on a set of training data covering wide variety of ECG signals with different morphologies of P-waves picked from CSE ECG database.
Step 10: On testing, normalized value of twelve slopes, one
from each of the twelve leads of ECG at a sampling instant is used to form the input vector for the SVM. Then the window is moved forward by one sampling instant and a set of twelve slopes, again one from each of the twelve leads of ECG were taken to form next input pattern vector. A train of 1’s is obtained at the output of SVM, when the window traverses through the P-wave region and -1 for the remaining region. The train of 1’s is picked and using their duration, average pulse duration of 1’s is evaluated. Those trains of 1’s, whose duration turns out to be more than the average pulse duration are detected as P-waves and the other ones are discarded. The locations of the P-wave as detected by the SVM are shown by the curve Fig. 2(i).
1 501 1001 1501 2001 2501 3001 3501 4001 4501
Time (Data Samples)
Amp
lit
ude
(a)
(c) (b)
(d)
(e)
(f)
(g)
(h)
[image:3.595.86.526.422.699.2](i)
Fig. 2 Results obtained at each step of the algorithm, (a) Raw ECG, (b) Filtered ECG, (c) QRS locations,
IV. IMPLEMENTATION
Implementation of SVM for the detection of T-waves in ECG signal is done by using LIBSVM software [28]. LIBSVM is an integrated software package for support vector classification, regression and distribution estimation. It uses a modified sequential minimal optimization (SMO) algorithm to perform training of SVMs. SMO algorithm breaks the large quadratic programming (QP) problem in to a series of smallest possible QP problems. These small QP problems are solved analytically, which avoids using a time-consuming numerical QP optimization problem as an inner loop [29].
In the present problem of T-wave detection, SVM is constructed using sigmoid kernel K(x, xi) = tanh (γ(x.xi)+
ν), which takes two parameters γ and ν. The parameter γ can be viewed as a scaling parameter of the input data, and ν as a shifting parameter that controls the threshold of mapping. The values of γ > 0 and ν < 0 are more suitable for sigmoid kernel [30].The type of kernel function, its parameters and margin-loss trade-off C should be determined to find the optimal solution. It is not known beforehand which values of C, the type of kernel function and its parameter are the best for this problem of T-wave detection. The objective is to obtain best kernel function, its parameters and margin-loss trade-off C so that the classifier can accurately predict unknown data (testing data). In the present study four- fold cross- validation approach is used to select the kernel function, to tune its parameters and margin-loss trade-off C [31]. In this, the training data is divided into four subsets of equal size. Sequentially one subset is tested using the classifier trained on the remaining subsets. Thus, each instance of the whole training set is predicted once so the cross validation accuracy is the percentage of data which are correctly classified.
The best generalization performance is achieved with the sigmoid kernel function. There are three free parameters namely γ, ν of the sigmoid kernel function and margin-loss trade-off C, that should be determined to find the optimal solution. The optimum values of C=2, γ = 3 and ν= -0.1 are obtained for the training sets containing 9460 data points for T-wave detection with the cross validation accuracy of 99.01% and 8220 data points for P-wave detection with the cross validation accuracy of 96.23%
V. RESULTS ANDDISCUSSIONS
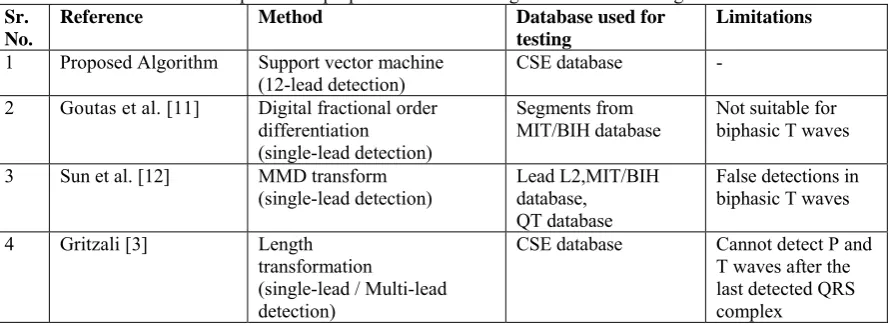
The validation of the proposed algorithms for P and T-wave detection is done using 50, simultaneously recorded, 12-lead ECG records of dataset 3 of CSE multi-lead measurement library [32]. This library contains original 12-lead simultaneous ECG recordings covering a wide variety of pathological cases. It should be noted here that the CSE library contains a high percentage of pathological ECG’s, and there are some wave components which are hardly recognized even visually. Every record picked from CSE ECG database is of 10s duration sampled at 500Hz thus giving 5000 samples. The algorithm, when tested using the optimum values of the parameters (C=2, γ = 3 and ν= -0.1) gives detection rate of 92.13% and 83.58% for T and P-waves respectively. The algorithm is capable of detecting all the types of P and T-wave morphologies. It also detects the T T-wave after the last detected QRS complex. Table 1 displays comparison of the proposed algorithm for P and T wave detection with other algorithms.
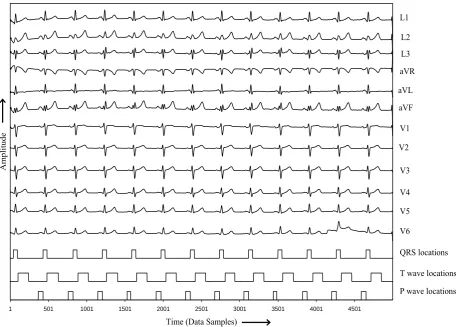
Fig. 3 illustrates the effectiveness of the algorithm for the detection of P and T waves. The performance of for the record MO1_119 is displayed in which there is a wide variety of P and T wave morphologies. In leads L2, L3, and aVF, T-waves are taller than the QRS complexes. In lead aVR, P and T-waves are inverted and in lead aVL, the amplitude of P and T-waves is very small. The SVM successfully detects all these p and T-waves as shown in Fig.3
VI. CONCLUSION
[image:4.595.77.522.571.734.2]This paper presents a new method for the detection of P and T-waves in simultaneously recorded 12-lead ECG signal using support vector classifier. The method has been exhaustively tested using the CSE ECG database covering a wide variety of P and T-wave morphologies. A significant detection rate is obtained. The proposed method accurately detects normal, inverted and biphasic P and T-waves. The information obtained by this method is very useful for ECG classification and cardiac diagnosis. This information can also serve as an input to a system that allows automatic cardiac diagnosis.
Table 1. Comparison of proposed SVM based algorithm with other algorithm s
Sr. No.
Reference Method Database used for
testing
Limitations
1 Proposed Algorithm Support vector machine
(12-lead detection)
CSE database -
2 Goutas et al. [11] Digital fractional order
differentiation (single-lead detection)
Segments from MIT/BIH database
Not suitable for biphasic T waves
3 Sun et al. [12] MMD transform
(single-lead detection)
Lead L2,MIT/BIH database,
QT database
False detections in biphasic T waves
4 Gritzali [3] Length
transformation
(single-lead / Multi-lead detection)
CSE database Cannot detect P and
1 501 1001 1501 2001 2501 3001 3501 4001 4501
Time (Data Samples)
A
m
plitude
QRS locations L1
L2
L3
aVR
aVL
aVF
V1
V2
V3
V4
V5
V6
T wave locations
[image:5.595.71.528.90.417.2]P wave locations
Fig. 3 P and T-wave detection in record MO1_116 of CSE ECG database
REFERENCES
[1] B. U. Kohler, C. Henning, and R. Orglmeister, “The principles of software QRS detection,” IEEE Eng. in Med. and Bio., 2002, pp. 42-47. [2] C. Caroubalos, C. Perche, C. Metaxaki-Kossionides, E. Sangriotis, and
D. Maroulis, “Method for automatic analysis of the ECG, ”J. Biomed. Eng. Vol.10, 1988, pp. 343-347.
[3] F. Gritzali, “Detection of the P and T-waves in an ECG,” Comp. and Biomed. Research, vol. 22, 1989, pp. 83-92.
[4] C. Li, C. Zheng, and C. Tai, “Detection of ECG Characteristic points using Wavelet Transform,” IEEE Trans. Biomed. Eng. Vol. 42, 1995, pp.21-28.
[5] S. S. Mehta, S.C. Sexana, and H.K Verma, “Computer-aided interpretation of ECG for diagnostics,” Int. Journal of System Science, vol. 27, 1996, pp. 43-58.
[6] E. Soria-Olivas, M. Martinez-Sober, J. Calpe-Maravilla, J. F. Guerrero-Martinez, J. Chorro-Gasco, and Espi-Lopez, “Application of adaptive signal processing for determining the limits of P and T-waves in an ECG,” IEEE trans on Biomed Engg, vol. 45, 1998, pp. 1077-1080. [7] J. Vila., Y. Gang, J. Presedo, M. Fernandez-Delgado, S. Barro, M.
Malik, “A mathematical model for the T-wave pattern classification, Computers in Cardiology, vol. 25, pp. 421-424, 1998.
[8] K. F. Tan, K. L. Chan, and K. Choi, “Detection of the QRS-complex, P-wave, and T-wave in electrocardiogram,” Proc. First Int. Conf. on advances in medical signal processing and information processing, Bristol, UK, 2000, pp. 41-47.
[9] D. Benitez, P. A. Gaydecki, A. Zaidi and A. P. Fitzpatrick, “The use of Hilbert transform in ECG signal analysis,” Comp. in Bio. and Med., vol.31, 2001, pp. 399-406.
[10] S. C. Saxena, V. Kumar, and S. T. Hamde, “Feature extraction from
ECG signals is using wavelet transform for disease diagnostics,” Int. Journal of System Science, vol. 33, 2002, pp. 1073- 1085.
[11] A. Goutas, Y. Ferdi, J. P. Herbeuval, M. Boudraa, and B. Boucheham, “Digital fractional order differentiation-based algorithm for P and T-waves detection and delineation ” ITBM-RBM, vol. 26, 2005, pp. 127-132.
[12] Y. Sun, K. L. Chan, and S. M. Krishnan, “Characteristic wave detection in ECG using morphological transform,” BMC Cardiovascular Disorders, 2005 available on http://www.biomedcentral.com/1471-2261/5/28
[13] M. Brown, W. Grundy, D. Lin, N. Cristianini, C. Sugnet, T. Furey, M. Ares, and D. Haussler, “Knowledge based analysis of micro-array gene expression data using support vector machine,” Technical Report, University of California, 1999.
[14] J. Dehmeshki, J. Chen, M. V. Casique, and M. Karakoy, “Classification of lung data by sampling and support vector machine,” Proc. of 26th
IEEE EMBS annual international conference, San Francisco, CA, USA, 2004, pp. 3194-3197.
[15] F. Chu, G. Jin, and L. Wang, “Cancer diagnosis and protein secondary structure prediction using support vector machine,” StudFuss, vol.177, 2005, pp. 343-363.
[16] J. M. Roig, R. V. Galiano, F. J. Chorro-Gasco, and A. Cebrian, “Support vector machine for arrhythmia discrimination with wavelet transform based feature selection,” Computers in Cardiology, vol. 27, 2000, pp. 407-410.
[17] S. Jankowski, A. Oreziak, A. Skorupski, H.Kowalski, Z. Szymanski, and E. Piatkowska-Janko, “Computer-aided morphological analysis of holter ECG recordings based on support vector learning system,” Computers in Cardiology, vol. 30, 2003, pp. 597-600.
[18] S. Jankowski, and A. Oreziak, “Learning system for Computer-aided ECG analysis based on support vector machines,” I.J. of Bioelectromagnetism, vol. 5, 2003, pp.175-176.
[20] N. Acir, “Classification of ECG beats by using a fast least square support vector machines with a dynamic programming feature selection algorithm,” Neural Comput. and App., vol. 14, 2005, pp. 299-309. [21] M. H. Song, J. Lee, S. P. Cho, K. J. Lee, and S. K. Yoo, “Support vector
machines based arrhythmia classification using reduced features,” I. J. of Control Auto. and Sys., vol.3, 2005, pp. 571-579.
[22] N. Acir, “A support vector machine classifier algorithm based on a perturbation method and its application to ECG beat recognition systems,” Expert Sys. with App., vol. 31, 2006, pp. 150-158.
[23] V. Vapnik, Statistical Learning Theory, Wiley, New York, 1998. [24] C. J. C. Burges, “A tutorial on support vector machines for pattern
recognition, Data mining and knowledge discovery,” vol. 2, 1998, pp.955-971.
[25] J. A. Van Alste, and T.S. Schilder, “Removal of base-line wander and power line interference from the ECG by an efficient FIR filter with a reduced number of taps,” IEEE Trans. Biomed. Eng., vol. 32, 1985, pp.1052- 1059.
[26] G. S. Furno, and W. J. Tompkins, “A learning filter for removing noise interference,” IEEE Trans. Biomed. Eng., vol. 30, 1983, pp. 234-235. [27] S. S. Mehta, and N. S. Lingayat, “Development of entropy based
algorithm for cardiac beat detection in 12-lead electrocardiogram” Signal Processing, in Press.
[28] C. C. Chang, and C. J. Lin, LIBSVM: A library for support vector machines, Technical report, National Taiwan University, Taiwan, 2004. [29] J. Platt, “Fast training of SVMs using sequential minimal optimization”
in B. SchPolkopf, C. Burges, A. Smola, (Eds.), Advances in kernel methods: Support vector machines, MIT Press, Cambridge, 1999. [30] H. T. Lin, and C. J. Lin, “A study on sigmoid kernels for SVM and the
training of non-PSD kernels by SMO-type methods,” Technical report, Department of Computer Science and Information Engineering, National Taiwan University, Taiwan, 2003.
[31] C. W. Hsu, C. C. Chang, and C. J. Lin, “A practical guide to support vector classification,” Technical report, Department of Computer Science and Information Engineering, National Taiwan University, Taiwan, 2003.
[32] J. L. Willems, P. Arnaud, J. H. Van Bemmel, R. Degani, P. W. Macfarlane, and Chr. Zywietz, CSE working party, Common Standards for Quantitative Electrofcardiography: Goals and main results, Meth Inform. Med., 29 (1990) 263-271.
Sarabjeet S. Mehta was born in Kolkata, India in 1958. He received the B.E. degree in Electrical Engineeirng and M.E. degree in Control System from J. N. Vyas University, Jodhpur- Rajasthan (India) in 1980 and 1987 respectively. He received Ph.D. degree in Electrical Engineering from Indian Institute of Technology, Roorke in 1994.
Presently he is Associate Professor and Head, Electrical Engineering Department of MBM Engineering College, J. N. Vyas University, Jodhpur- Rajasthan (India). His research interest includes pattern recognition, artificial neural networks, biomedical engineering, soft computing and electrical machines.
He is a fellow of Institution of Engineers (India) and life member of Indian Society for Technical Education.
Nitin S. Lingayat was born in Shahapur (Thane), India in
1971. He received the B.E. degree in Electrical Engineering from the University of Poona, Pune in 1992 and the M.Tech. degree from Indian Institute of Technology Bombay, Mumbai in 1998. He is Head, Electrical Engineering Department, Institute of Petrochemical Engineering of Dr. B.A. Technological University, Lonere- Maharashtra (India).