University of Twente
EEMCS / Electrical Engineering
Control Engineering
A software solution for absolute position
estimation using WLAN for robotics
Bart Deen
MSc report
Supervisors:
i
“I have not set off this little work with pompous phrases, nor filled it with high-sounding and magnificent words, nor with any other allurements of extrinsic embellishments with which many are wont to write and adorn their
works; for I wished that mine should derive credit only from the truth of the matter and that the importance of the subject should make it acceptable.”
Niccolò Machiavelli - The Prince & The Art of War - 1532
iii
Summary
This project is divided in two parts; Software frameworking for robots and absolute position estimation using the WLAN infrastructure.
With increasing demands in functionality and complexity of a robot, the software complexity increases also. This increase in complexity stresses the limits of conventional software writing used today. To release this stress and give structure to the complexity of the software, a robust framework using a modular approach is needed. After a literature analyse of seven software architectures for robotics, Orocos matched best with the requirements defined in this project.
Tests of Orocos’ implementation on the JIWY setup shows Orocos’ ability for hard real-time execution of tasks and communication between non real-time and hard real-time task. This without significant performance loss. Drawback of using Orocos are the resources needed.
Orocos is a promising framework and should be implemented on a more complex system than JIWY to explore the real power of this framework
Position estimation is a vital part in developing an autonomous mobile robot. Before a mobile robot can reach its destination it must know its current position. Some dedicated absolute position systems are developed, like GPS and Galileo. These systems work great when in sight of the satellites but are of no use indoors. This project aims to fill this gap and create a method which uses existing WLAN infrastructure for indoor absolute positioning.
Position estimation using propagation models is chosen instead of empirical models. Propaga-tion models are better suitable on an embedded system where recourses are limited. Develop-ing a WLAN positionDevelop-ing method results in a evaluation of four methods; (two radio propagation methods and two trilateration methods) in two different situations; moving from point to point for navigation purposes and stationary on a fixed point for orientation purposes.
In the situation “stationary on a fixed point” the best result was obtained with the ITU path loss model and the linear trilateration method. This method achieved mean error<3mand can be used for orientation purposes. Orientation means in this case “Am I in the right room”, “Which direction is the nearest recharger” etc. Positioning when moving from point to point results in a position dispersion too great to be of any use. Navigation using the WLAN infrastructure in this setting is therefore not possible.
Dedicated hardware, for measuring the signal strength, should result in more reliable measure-ment with less dispersion. This should result in better position estimations.
v
Samenvatting
Dit project is opgedeeld in twee delen; Software frameworking voor robots en absolute positie bepaling door middel van WLAN infrastructuur.
Door de toenemende vraag naar functionaliteit en complexiteit van een robot, neemt de com-plexiteit van de software ook toe. Deze toename in comcom-plexiteit zet conventionele methoden voor het schrijven van software onder druk. Om deze druk te verlichten en structuur te geven aan de gecompliceerde software, is er behoefte aan een krachtig modulair software framework. Uit een literatuur onderzoek naar zeven architecturen, ontwikkeld voor robotica, blijkt Orocos het meest geschikt.
Testen die zijn uitgevoerd met de implementatie van Orocos op de JIWY opstelling, tonen aan dat Orocos hard real-time taken kan uitvoeren en kan blijven communiceren met niet real-time taken, zonder veel prestatie verlies te leiden. Nadeel van Orocos is de hoeveelheid resources die Orocos nodig heeft.
Orocos is een veelbelovend framework. Een implementatie op een complexer systeem dan JIWY zal nodig zijn om de echte kracht van Orocos te verkennen en te laten zien.
Positie bepaling is een elementair onderdeel tijdens de ontwikkeling van automatische mo-biele robots. Voordat een robot zijn bestemming kan bereiken, moet zijn huidige positie bek-end zijn. Enkele speciale absolute positie bepalings systemen zijn ontwikkeld, zoals GPS en Galileo. Deze systemen werken goed wanneer de satelieten in zicht zijn, maar zijn zinloos voor gebruik binnenshuis. Dit project heeft als doel een methode te ontwikkelen die deze overgang mogelijk maakt. Dit, door gebruik te maken van het bestaande WLAN infrastructuur voor ab-solute positie bepaling binnenshuis.
Er is gekozen voor propogatie modellen in plaats van calculatie intensieve empirische mod-ellen. Propogatie modellen zijn beter geschikt voor een embedded systeem, omdat daar de resources beperkt zijn. De ontwikkeling van de WLAN positie module resulteert in een eval-uatie van vier mogelijke methodes (twee propogatie methodes en twee trilateratie methodes) in twee verschillende situaties; verplaatsen van punt naar punt voor navigatie doeleinden en stationair op een vast punt voor oriëntatie doeleinden.
In de situatie “Stationair op één punt” werden de beste resultaten behaald met de ITU path loss model en de linear trilateration methode. Deze methode heeft een gemiddelde fout<3m
en kan gebruikt worden voor oriënterende doeleinden. Oriëntatie betekent hier “Ben ik in de juiste kamer”, “Waar is het dichtstbijzijnde oplaad punt”. Positionering tijdens verplaatsing van punt naar punt levert een te grote positie spreiding op, dat het geen enkel nut heeft. Navigate met behulp van WLAN is daarom niet mogenlijk.
Toegepaste hardware, voor het meten van signaal sterkte, zal betrouwbaarder metingen oplev-eren met minder spreiding. Dit zal resultoplev-eren in een betere positiebepaling.
vii
Contents
1 Introduction 1
1.1 The assignment . . . 2
1.2 Report outline . . . 2
2 Software frameworks for robotics 3 2.1 Introduction . . . 3
2.2 Requirements for a software framework . . . 3
2.3 Presentation of software architectures for application in robotic . . . 5
2.4 Evaluation of software frameworks for robotics . . . 8
3 Positioning using WLAN infrastructure 11 3.1 Introduction . . . 11
3.2 Related work . . . 11
3.3 Developing the WLAN positioning module . . . 12
3.4 Received Signal Strength Indicator (RSSI) . . . 12
3.5 Wave propagation models . . . 14
3.6 Trilateration . . . 18
3.7 Kalman filtering . . . 20
3.8 Evaluating WLAN positioning . . . 22
4 Implementation 25 4.1 Introduction . . . 25
4.2 Positioning using WLAN . . . 25
4.3 Test platform . . . 25
4.4 JIWY with Orocos . . . 26
4.5 JIWY with gCSP and CTC++ . . . 28
4.6 Evaluation Orocos versus gCSP and CTC++ . . . 29
5 Conclusion and recommendations 31 5.1 conclusion . . . 31
5.2 recommendations . . . 31
A Detailed Orocos structure of JIWY 33 B Export DriverWOM 35 C Linearization process 37 D Evaluation positioning using WLAN 39 D.1 Fixed target evaluation . . . 39
D.2 Moving target evaluation . . . 42
E The Orocos framework 47 E.1 Introduction . . . 47
E.2 Orocos components . . . 47
F Glossary 51
Bibliography 53
1
1 Introduction
Different sectors are active in developing multi-task autonomous mobile systems. The military is developing unmanned vehicles (seen figure 1.1(a)) and planes. With the "DARPA grand chal-lenge" (DARPA, 2008) the development of unmanned vehicles got a big impulse. The industry uses robots a long time in production and now warehouses are being robotized (Kiva Systems, 2008). A robot from this system is shown in figure 1.1(b). In the domestic sector robots are de-veloped for pleasure and to perform tasks for users with limited abilities, like the El-E (Nguyen et al., 2008) shown in figure 1.1(c).
(a) Winner DARPA urban challenge 2007 (b) Kiva systems robot (c) El-E fetchrobot
FIGURE1.1 - Mobile autonomous robots
Orientation and position estimation are important aspects for autonomous mobility of robots. Position estimation can be classified in two groups; relative and absolute localization. Relative localization uses system information, like odometry, velocity and angles, to derive a position. Absolute localization uses sensors for finding environmental features or beacons to derive a position. GPS is a widely used absolute position system but is not suitable for indoor use be-cause the sensor must be in the line-of-sight of the satellites to be successful. Most indoor absolute localization uses dedicated sensors and beacon networks based on vision, IR or radio beacons or Low Frequency Magnetic Fields (Prigge and How, 2000). At Control Engineering group vision and IR has been succesfully implemented. Usov (2006) implemented navigation with vision for a wheeled robot as is shown in figure 1.2(a). IR was used in positioning MART, shown in figure 1.2(b), by Schipper (2001).
This project investigates the use of WLAN Access-Points for absolute localization. WLAN can be used because WLAN Access-Point have fixed positions within the building and can be seen as radio transmitting beacons. Furthermore, the WLAN infrastructure is present in most of, if not all, buildings and available on robots as communication interface to the outside world. Therefore, using WLAN for positioning is a cheap solution compared to a dedicated beacon network.
With increasing demands in functionality and complexity of a robot, the software complex-ity increases also. Due to the increasing software complexcomplex-ity, the algorithms and structure for computation are not the main design challenges anymore (Garlan and Shaw, 1994). Designing and specifying the overall system structure emerges as a new kind of problem. Effective soft-ware engineering requires a facility in architectural softsoft-ware design. It is important to be able to recognize common paradigms in order to understand high-level relationships among systems and so that new systems can be built as variations on old systems.
2 A software solution for absolute position estimation using WLAN for robotics
(a) Vision based navigation (b) MART
FIGURE1.2 - Navigation at the Control Engineering group
A software framework for robotics is different from most software frameworks in the way it in-teracts with physical objects. This demands for stricter timing constraints which the framework must be able to handle. If the timing of a particular control signal is wrong, a robot can damage itself or its environment. A robot is therefore a Hard Real-Time Embedded system.
1.1 The assignment
The assignment for this project can be formalized as: "Develop a method for absolute position-ing, within a software framework for robotics of a mobile platform, moving indoors, using the existing WLAN infrastructure. The software framework must be able to cope with the increase software complexity of today’s robots".
A software framework is presented which can accommodate the requirements for use in robotics. This framework is used to implement the algorithms needed for absolute position estimation using the WLAN infrastructure. The position estimation of a mobile device is done by mea-suring the received signal strenght from WLAN Access-Points. From this measurements, a dis-tance to the Access-Point can be calculated. A minimum of three disdis-tances to Access-Points and known positions of these Access-Points are needed to calculate the position of the mo-bile device. Before implementing the algorithms for position estimation, the algorithms will be evaluated with Matlab.
As demonstrator, the JIWY setup will be used. During the demo a pointing device cq. camera will follow a moving target, in this case a person walking with a laptop. This demo will demon-strate:
• The ability of distributed control of the framework by using two computers • The ability of loop control of the framework by controlling two dc motors • The working of position estimation using WLAN infrastructure
1.2 Report outline
Chapter two is a literature study on software frameworks used in robotic. This study points out a framework suitable for use in robotics. Designing a method for positioning, using the WLAN infrastructure, is discussed in chapter 3. After a framework is chosen and the development of position estimation is treated, the development of the demonstrator is explained in chapter 4. The conclusion and recommendations of this project are described in chapter 5.
3
2 Software frameworks for robotics
2.1 Introduction
A software framework facilitates the software engineer with a structured way-of-working. Through a modular approach, provided by the software framework, the complexity of developing soft-ware is divided into subsystems. The framework provides the infrastructure of communication and scheduling between the subsystems. Each subsystem can be developed, tested and eval-uated before taken part of the total system. This can result in robust, reusable, reliable code modules. It also enables parallel development by different engineers with different expertise. In the end, use of a framework results in robust, reliable, reusable and maintainable source code and shortens the development time.
A software framework for robotics is different from most software frameworks in the way it interacts with physical objects. This demands stricter timing constraints which the framework must be able to handle. If the timing of a particular control signal is wrong, a robot can damage itself or its environment. A robot is therefore a Hard Real-Time Embedded system.
In this chapter, seven software architectures for robotics are presented. They are evaluated for suitability in robotics according the requirements described in section 2.2. Goal is to present a software architecture which enables to simplify and shorten the time of developing robust and reliable software for robots.
2.2 Requirements for a software framework
The software frameworks presented in section 2.3 are evaluated if they satisfy not only classic robotic requirements, like real-time behavior and intensive access to hardware, but also on software engineering aspects as re-usability, maintainability, etc.
The framework must be able to implement new technologies without redefining the software structure. This can be accomplished with various levels of abstraction. A higher level only knows what the underlying layer is able to perform, not how it is achieved. For example: posi-tion estimaposi-tion can be done by relative and/or absolute posiposi-tioning. By means of abstracposi-tion the higher level only needs coordinates of the position, not the way it is estimated. This level of abstraction is also needed for testing the software with virtual hardware, as described by Damstra (2008).
At the Control Engineering group 20-sim (Controllab Products B.V., 2008) is frequently used for creating, simulating and evaluating mechatronic controllers. Automatic code generation is used to implement the controller on a real setup. It is desirable that the proposed software framework is capable of easy implementing these 20-sim generated source code.
Robot behavior is often described in a Finite State-Machine. It is therefore desirable that the framework is able to execute Finite State-Machines on the fly.
A robot can be seen as a Distributed system when, multiple computers are used to control the robot. And the robot can be part of a Distributed system, when multiple robots are used for one goal. In both cases, reliable network communication is essential. The proposed framework is evaluated on availability of network communication possibilities.
4 A software solution for absolute position estimation using WLAN for robotics
The requirements used for evaluation of the software frameworks are shown in table 2.1. Sec-tion 2.4 contains the results from the software architectures presented in secSec-tion 2.3.
Requirements for evaluation
Requirement Description
Abstraction levels Availability of various levels of abstraction. Distributed system Posability to be part of a distributed system. Resources Efficiency of resources use.
Simulation Suitability for co-simulation/Hardware in the loop. Real-time Availability of Hard real-time behavior.
20-sim Possibility of importing generated code from 20-sim. Finit State-machine Possibility of executing Finit state-machines. Documentation Availability of up-to-date documentation.
[image:14.595.114.458.358.712.2]TABLE2.1 - Requirements for evaluation of software frameworks
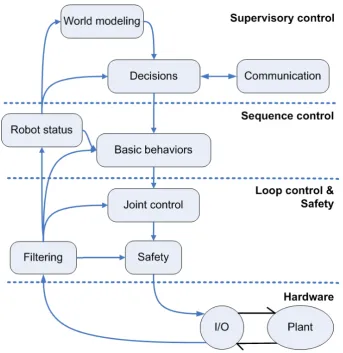
Figure 2.1 shows the structure, proposed by Lootsma (2008) for the TULip humanoid robot (Dutch Robotics, 2008) which is being built at this moment at the Control Engineering group. The chosen Framework must be able to accommodate this kind of structure.
FIGURE2.1 - Advised structure for the TUlip robot
In the next section a selection of software architectures specialized in robotics are presented.
2. Software frameworks for robotics 5
2.3 Presentation of software architectures for application in robotic In this section the following software architectures are presented:
• Yarp; Yet Another Robot Platform.
• CLARAty; Coupled-Layer Architecture for Robotic Autonomy. • Orocos; Open Robot Control Software.
• URBI; Universal Real-time Behavior Interface. • Orca; Components for Robotics.
• RoboFrame; Robot Framework.
• gCSP and CTC++; Graphical tool for Communicating Sequential Processes and Communi-cation Threads for C++.
These software architectures are evaluated on the requirements described in section 2.2. This evaluation is discussed in section 2.4.
2.3.1 Yarp
YARP, Yet Another Robot Platform (Metta et al., 2006), is an open-source project that provides a set of libraries, protocols, and tools to keep software modules and devices drivers decoupled. YARP is written by and for researchers in robotics, particularly humanoid robotics The goal of YARP is to minimize the effort devoted on infrastructure-level software development. This by facilitating code reuse, modularity and to maximize research-level development and collabo-ration.
The components of YARP can be divided into:
• The libYARP_OS; the interface with the OS to support streaming data across multiple threads on different machines. YARP is written to be OS neutral and has been used on Linux, Mi-crosoft Windows, Mac OSX and Solaris. It uses the open-source ACE (Adaptive Communica-tion Environment) library, which is portable across a very broad range of environments, and YARP inherits that portability.
• The libYARP_sig; performing common signal processing tasks (visual, auditory) in an open manner and can be easily interfaced with other commonly used libraries, for example OpenCV (Open source Computer Vision library).
• The libYARP_dev; containing the interface with common devices used in robotics: framegrab-bers, digital cameras, motor control boards, etc.
The three packages of components are maintained separately. Both libYARP_sig and libYARP_dev depends on the core component is libYARP_OS. YARP is currently used and tested on Windows, Linux and QNX6 which are common operating systems used in robotics.
YARP has the ability to redistribute computation load of processes on different CPUs on the fly. This results in a sort of “soft real-time” parallel computation cluster without the more demand-ing requirements of a real-time operatdemand-ing system (Metta et al., 2006).
2.3.2 CLARAty
CLARAty stands for Coupled-Layer Architecture for Robotic Autonomy (Nesnas et al., 2003). It is a collaborative effort among four institutions: Jet Propulsion Laboratory, NASA Ames Re-search Center, Carnegie Mellon, and the University of Minnesota. CLARAty develops a frame-work for generic and reusable robotic components that can be adapted to a number of hetero-geneous robot platforms. It also provides a framework that will simplify the integration of new technologies and enables the comparison of various elements. CLARAty consists out of two distinct layers: a Functional Layer and a Decision Layer. The interaction between the layers is
6 A software solution for absolute position estimation using WLAN for robotics
shown in figure 2.2. The Functional Layer defines the various abstractions of the system and adapts the abstract components to real or simulated devices. It provides a framework the algo-rithms for low- and mid-level autonomy. The Decision Layer provides the system’s high-level autonomy, which reasons about global resources and mission constraints. The Decision Layer accesses information from the Functional Layer at multiple levels of granularity.
FIGURE2.2 - Functional Layer and Decision Layer within CLARAtyI
CLARAty contains a set of public modules and a set of restricted or private modules. The dif-ferent access privileges dependents on Intellectual Property and ITAR (International Traffic in Arms Regulations) restrictions.
2.3.3 URBI
URBI, described by Baillie (2004) stands for Universal Real-time Behavior Interface and is a robotics platform currently maintained and developed by Gostai (gostai, 2008). URBI is a scripted interface language designed to work over a client/server architecture in order to remotely con-trol a robot or, in a broader definition, any complex system. URBI for robotics is more than a simple driver for the robot, it is a universal way to control the robot. It adds functionalities by plugging software components and develop a fully interactive and complex robotic application in a portable way. The main distinctive qualities of URBI are the following:
• Simplicity: URBI is easy to understand, but with high level capabilities. URBI is suitable both for educational and professional applications.
• Flexibility: URBI is designed to be independent from both the robot and the client system or language (it currently works together with C++, Java, Matlab, on Windows, Mac OSX or Linux). URBI relies on TCP/IP or Inter-Process Communication.
• Parallelism: Parallel processing of commands, concurrent variable access policies, event based programming,...
The platform does not have its own simulation environment, but it has been recently integrated with Webots (cyberbotics, 2008), a popular commercial robot simulation environment.
Isourcehttp://claraty.jpl.nasa.gov
2. Software frameworks for robotics 7
2.3.4 Orocos
Orocos (Bruyninckx, 2001) is the acronym of the Open Robot Control Software project. The goal of this project is to develop a general purpose modular framework for robot and machine control. It is organized in the form four C++ libraries (see figure 2.3):
1 the Real-Time Toolkit(RTT) - provides infrastructure and functionality to build component based real-time application.
2 the Kinematics and Dynamics(KDL) library - provides primitives to calculate kinematic chains. 3 the Bayesian Filtering library(BFL) - provides a framework to perform inference using
Dy-namic Bayesian Networks.
4 the Orocos component library(OCL) - provides some ready to use components.
FIGURE2.3 - Orocos libraries, Bruyninckx (2001)
Orocos components are built using RTT but also can use functionalities provided by other li-braries. Users can interface/interact with the component through its predefined set of inter-faces. In addition to defining component interface and communication mechanisms, Orocos allows application builders to implement hierarchical state machines using these mechanisms. The state machines can be loaded at runtime in any component. All Orocos components are implemented using the "TaskContext" class. TaskContext defines a "context" in which the com-ponent task is executed, where a task is a basic unit of functionality which executed one or more programs(a C function, script or state machine) in a single thread. All the operations performed within this context are free of locks, priority-inversions, i.e. thread-safe deterministic.
Orocos uses CORBA (Common Object Request Broker Architecture) as middleware when dis-tributed control is desirable. CORBA is a standard defined by the Object Management Group ("OMG", 2008).
2.3.5 ORCA
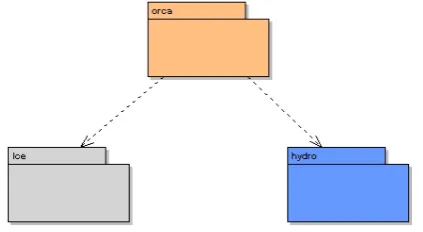
Orca (Makarenko et al., 2006) is an open-source software project which applies Component-Based Software Engineering (CBSE) principles to robotics. CBSE offers developers the oppor-tunity to source existing plug-in software components, rather than building everything from scratch. Orca’s main goal is to promote software reuse in robotics targeting the range from sin-gle vehicles to distributed sensor networks. ICE (Internet Communications Engine) is used to create a distributed component-based system.
The project contains two distributions:
• Hydro - Libraries of algorithm and driver implementations. • Orca - Component-based framework for building robotic systems. • ICE - Internet Communications Engine (Extern)
8 A software solution for absolute position estimation using WLAN for robotics
Orca uses Hydro’s libraries to access robotic hardware and process the data. ICE is used for inter-component communication but is developed by ZeroC (2008). Figure 2.4 show the Orca’s connection with Hydro and ICE.
FIGURE2.4 - Orca connection with Hydro and Ice
2.3.6 Roboframe
RoboFrame (Petters et al., 2007) is a modular software framework for lightweight autonomous robots and created by Technical University of Darmstadt. RoboFrame has been developed and designed to meet the special needs of systems with challenging dynamical locomotion like small size humanoid robots or unmanned aerial vehicles which impose strong restrictions on the available payload and thus the available CPU power. Due to its modular design, the de-velopment of control software for different types of robots with a large variety of reactive and deliberative control paradigms, is simplified and can be accomplished in a short time. Debug-ging, monitoring and control of applications is supported by an expendable and also platform independent graphical user interface.
2.3.7 gCSP and CTC++
gCSP (Jovanovic et al., 2004) is a graphical tool for creating and editing CSP diagrams (Hilderink, 2005). CSP diagrams are dataflow diagrams, connecting processes with channels. Beside the dataflow, the concurrency structure is also indicated. Next to editing diagrams, gCSP does basic consistency checks and can generate code from the diagrams. The generated code needs the CTC++ library for implementing CSP primitives in modern programming languages and for general purpose microprocessors.
A gCSP model is connected with the hardware through linkdrivers. Linkdrivers are objects within the CT library that convert the channel interface to hardware instructions. Linkdrivers abstract away hardware-dependent instructions.
gCSP and CTC++ are used at the Control Engineering group for implementing controllers, sim-ulated and evaluated using 20-sim, on mechatronic setups.
2.4 Evaluation of software frameworks for robotics
Table 2.2 shows the results from the literature study on software architectures for robotics based on the requirements described in section 2.2.
CLARAty is promising but there are different access privileges depending on Intellectual Prop-erty and ITAR restrictions. Therefore CLARAty is not a candidate for the proposed framework.
URBI is a client/server approach with its own scripting language. The layered structure as shown in figure 2.1 cannot be achieved with URBI and therefore URBI is dismissed.
[image:18.595.177.389.133.249.2]2. Software frameworks for robotics 9
Requirement Roboframe Orca Orocos URBI CLARAty YARP gCSP and CTC++
Abstraction levels + + + - + +
-Distributed system + + + - + +
-Resources efficiency + ? - ? + + +
Simulation + + + - + + +
Real-time - - + - ? - +
20-sim + + + + + + +
Finit State-machine + - + - - -
-documentation + + + + + +
-open source - + + + - +
-TABLE2.2 - Evaluation of software frameworks
Yarp and Orca scores positive on most of the requirements but lacks a defined structure. Both exists out of set of libraries and protocols. Because a defined structure is missing, the source code becomes unmaintainable when different students, in time, are working on variation of the robot. The Control Engineering group has experience this with 20Works.
Roboframe was proposed by Delft University of Technology in the TUlip project because Tech-nical University of Darmstadt succesfully implemented RoboFrame on humanoid robot. Robo-Frame scores positive on most of the requirements but misses Real-Time behavior. Lootsma (2008) proposed a solution to this problem and RoboFrame will be used in the TUlip humanoid.
“gCSP and CTC++” has succesfully implemented different control algorithms for Mechatronic setups. The concept of gCSP and CTC++ is promising but it is not mature enough to implement the layered structure as shown in figure 2.1.
Orocos scores positive and promising on all requirements except "Resourse efficiency". A demon-strator must show if the cost of Resourse inefficiency effects the total system. Beside “gCSP and CTC++” is Orocos the only framework supporting Hard Real-Time behavior.
Orocos is the proposed software framework in this project. The demonstrator (see section 4.3) will be programmed using Orocos and used as testcase.
11
3 Positioning using WLAN infrastructure
3.1 Introduction
Part goal of this project is to find an absolute positioning system which use Commercial off-the-shelf hardware and uses the existing WLAN infrastructure. This with minimal training and knowledge of the environment. The position retrieved will be used for navigating a mobile robot. Using the WLAN infrastructure is a cheap solution for indoor absolute position estima-tion. Cheap because all hardware is already in use for communication purposes and because the WLAN infrastructure is already present so no dedicated hardware has to be developed.
The accuracy taken from related work, see table 3.1, is between 1.5 and 8 m. It can be used for navigating or tracking and orientation purposes. Orientation means in this case “Am I in the right room”, “Which direction is the Mail room” etc.
3.2 Related work
Several studies were performed on positioning with WLAN, all with different goals and meth-ods. Most had as goal to use the position information to benefit the user with automatic trig-gered services. For example print to the nearest printer, building navigation etc. Ekahau, Inc provides a commercial Wireless LAN position system called Ekahau Positioning Engine (Eka-hau, 2008). The details of the system are patented and not publicly available.
The method of positioning differs between the different projects. An empirical method, based on a grid of known measurements, is used by Chen et al. (2007), de Moraes and Nunes (2006), Ladd et al. (2004) and Bahl and Padmanabhan (2000). With this method a grid with measure-ments must be made and through the nearest neighbor principle, based on resource intensive probability calculations, a position can be determined. Bahl and Padmanabhan (2000) and Kotanen et al. (2003) use a radio propagation model for determining a distance to an access-point. Through trilateration of these distances and know positions of the access-points, a po-sition can be calculated. This method needs no training before implementing, only known position of the radio beacons. It is therefore more flexible than the empirical method. Down-side is that it is less accurate (Bahl and Padmanabhan, 2000). Kwon et al. (2004) use a hybrid method of both a empirical grid and radio propagation. Results on accuracy and computation efficiency of these projects can be found in table 3.1.
Method Computation
Project Empirical Radio propagation efficiency
Chen et al. (2007) 2.5a
-de Moraes and Nunes (2006) 1.7b
-Ladd et al. (2004) 1.5
-Bahl and Padmanabhan (2000) 2.94c 8.16c -/+
Kotanen et al. (2003) 1.6b +
Kwon et al. (2004) 5 to 7 –
awith 0.9 error quantile bmean error
cmedian 50t hpercentile
TABLE3.1 - Accuracy in related projects (reported in meters)
12 A software solution for absolute position estimation using WLAN for robotics
As can be seen from the results in table 3.1 the accuracy differs greatly. This can be explained by the different environments in which the projects took place, more walls and greater distances between the access-points.
In this project, radio propagation models will be used to determine a position. The accuracy of an empirical method is better but is also less resource efficient. Therefore, it is not suitable for an embedded platform used on a robot. Furthermore, with the Radio propagation method the implementation is more flexible and extendable to other floors and buildings because no training is needed. The development of positioning with WLAN is explained in section 3.3.
3.3 Developing the WLAN positioning module
The global architecture of the WLAN positioning module is divided in four parts. This is shown in figure 3.1. Each part is described, implemented and validated in the following sections.
FIGURE3.1 - Global architecture of the WLAN positioning module
Extracting RSSI informationandCalculating Distance using Radio Propagation Modelare vali-dated using real measurements.TrilaterationandKalman filteringare verified with simulated positions and distances resembling the real situation. The final validation of the WLAN posi-tioning module use real measurements. During this final validation two situation wil be evalu-ated; Moving from point A to point B and stationary on a fix point.
From this final validation, the WLAN positioning module is evaluated if it is suitable for use in robotics. This is discussed in section 3.8.
All the measurements (real and simulated) for verification, validation and evaluation where taken at the Control Engineerling group located at floor eight. Figure 3.2 shows the layout of floor eight and the positions of the used Access-Points.
FIGURE3.2 - Layout of floor eight
3.4 Received Signal Strength Indicator (RSSI)
3.4.1 Background
The Received Signal Strength Indicator (RSSI) is part of the Physical layer (PHY) in the Open Systems Interconnection (OSI) Model for IEEE 802.11 wireless LAN. The OSI Model (see table 3.2) is a layered, abstract description for communications and computer network protocol de-sign. The RSSI is a parameter that has a value of 0 throughRSSI Max. This parameter is a measurement by the PHY of the energy observed at the antenna during data transfer. RSSI is
3. Positioning using WLAN infrastructure 13
intended to be used in a relative manner. Absolute accuracy of the RSSI reading is not specified (IEEE Std., 2003).
OSI Model
Data unit Layer Function
Host Layers Data
7. Application Network process to application 6. Presentation Data representation and
encryp-tion
5. Session Interhost communication
Segment 4. Transport End-to-end connections and reli-ability (TCP)
Media Layers
Packet/Datagram 3. Network Path determination and logical addressing (IP)
Frame 2. Data link Physical addressing (MAC & LLC)
Bit 1. Physical Media, signal and binary
trans-mission
TABLE3.2 - OSI Model
The Linux Wireless Extension (WE) (Tourrilhes, 2007) is an Open Source project sponsored by Hewlett Packard since 1996 and build with the contribution of many Linux users all over the world. The Wireless Extension is a generic Application Programming Interface (API) allowing the WLAN driver to be exposed to user-space. It enableling on the fly configuration and specific statistics to Wireless LANs, like Signal Strength, noise, frequency, AP MAC addresses etc.
3.4.2 Implementation
Within the driver for Wireless LANs an option exists to perform an environment scan of find-ing Access-Poits (AP) within range. When this option is executed, the driver returns a list of founded APs and there specific Wireless statistics, like MAC address, Extended Service Set ID (ESSID), noise indicator and RSSI. This option has as purpose roaming profiling, eg. switching between access-point when moving. The WE API provides functions and data structures for execution of this option in the driver.
The DriverWOM (Driver Wireless Orientation Module) program is written to perform an envi-ronment scan of nearby APs. It saves the retrieved information in a readable format, currently supported are; Comma-Separated Values (CSV) and Extensible Markup Language (XML). The DriverWOM program uses the WE API functions and datastructures to retrieve Wireless spe-cific statistics of these nearby APs. The RSSI and operating frequency are needed to calculate the distance to the AP. The MAC address of the AP is used to identify the AP for position pur-poses.
The DriverWOM program needs a configuration file and the WLAN device (eth0, wlan0 etc) to operate correctly. The configuration file is a XML file containing AP specific information, like ID, position, antennegain. An empty template in XML format is shown in listing 3.1. During the environment scan by the DriverWOM program all known information, Wireless specific and AP specific, is saved when an AP is found which is described in the Config file.
Listing 3.2 shows the command line options for the DriverWOM program. The DriverWOM has an output Channel option “Network”. This is not implemented altough a structure for imple-mentation is ready.
14 A software solution for absolute position estimation using WLAN for robotics
<?xml version="1.0" ?> <AP-config>
<AP> <!-- Next AP -->
<ID> </ID> <!-- MAC Address of AP used as ID --> <Name> </Name> <!-- ESSID of AP -->
<Desc> </Desc> <!-- Description -->
<X> </X> <!-- x-position of AP in cm --> <Y> </Y> <!-- y-position of AP in cm --> <Z> </Z> <!-- z-position of AP in cm --> <AntenneGain> </AntenneGain> <!-- Gain of antenna in dBi --> <Power> </Power> <!-- Transmit power in mW --> </AP>
</AP-config>
LISTING3.1 - DriverWOM config file in XML format
linux: \$ . /DriverWOM−h Help
Use . /DriverWOM
−c <config file> −w <WLAN device>
−C Channel = 1 : screen; 2 : Network; 4 : XML file; 8 : CSV file
−o <Channel output file> −p <UDP port number> −a <UDP Address> −l <loops>
LISTING3.2 - DriverWOM program options
3.4.3 Verification extracting RSSI
For this verification the DriverWOM performs an environment scan and saves the retrieved information in a CSV,- or XML file. Listing B.1 shows the output in CSV format. Listing B.2 shows the same information in XML format. From the timestamps in these listing can be seen that each 0.1 second an environment scan is performed and the retrieved data saved. This results in 10 measurements/sec.
During this project the CSV output is used to evaluate WLAN positioning with use of Matlab.
3.5 Wave propagation models
3.5.1 Background
The IEEE 802.11b standard uses radio frequencies in the 2.4-GHz band. Accurate prediction of signal strength is a complex and difficult task, since the signal propagates by unpredictable means. The 2.4-GHz frequency band is subject to interference from microwave ovens, Blue-tooth devices, 2.4-GHz cordless phones and overlap from IEEE 802.11 channel (figure 3.3(a)). Also signals of this frequency are absorbed by water, and consequently, people will also absorb signal since human bodies are almost 70% water. Furthermore the signal strength varies due to multipath fading (see figure 3.3(b)). This is caused by reflection, refraction and absorption of radio waves by masses standing in the wave area. Although many efforts have been made to model radio-signal distribution in an indoor environment a general model is not jet found. One of the main challenges for this project will be finding an approximation of radio-signal distribution which suits best for estimating a position.
In this project two radio wave propagation models will be evaluated. In general the radio wave propagation model can be described as equation 3.1.
3. Positioning using WLAN infrastructure 15
(a) WLAN channels and overlap (b) Radio signal multipath fading
FIGURE3.3 - Interference on Radio waves
Pr x −Gr x =Pt x +Gt x −L (3.1)
Where:
Pr x= received power at receiver [dB]. Gr x= Gain of the receiver antenna[dBi]. Pt x= Power of transmitter[dB].
Gt x= Gain of transmitter antenna.
L= Power loss defined by Path loss model.Lcontains all the interference, losses and distance information.
The decibel (dB) is a logarithmic unit of measurement that expresses the magnitude of a phys-ical quantity (usually power or intensity) relative to a specified or implied reference level. Since it expresses a ratio of two quantities and therefore it is a dimensionless unit.
• dBm: dB(1 mW) - power measurement relative to 1 milliwatt.
• dBi: dB(isotropic) - the forward gain of an antenna compared to the hypothetical isotropic antenna, which uniformly distributes energy in all directions.
3.5.2 Implementation
ITU indoor path loss model
The International Telecommunication Union (ITU) is an international organization established to standardize and regulate international radio and telecommunications. The ITU Indoor Prop-agation Model (ITU, 2005), also known as ITU Model for Indoor Attenuation, is a radio prop-agation model that estimates the path loss inside a room or a closed area inside a building delimited by walls of any form. Suitable for appliances designed for indoor use, this model approximates the total path loss an indoor link may experience.
The ITU indoor path loss model is expressed in equation 3.2.
L= 20 log(f)+N log(d)+Pf(n)−28 (3.2)
where,
L= The total path loss. Unit: decibel [dB].
f = Frequency of transmission. Unit: megahertz [MHz].
d= Distance [m].
N = The distance power loss coefficient.
16 A software solution for absolute position estimation using WLAN for robotics
n= Number of floors/walls between the transmitter and receiver.
[image:26.595.135.435.157.257.2]Pf(n) = The floor/wall loss penetration factor.
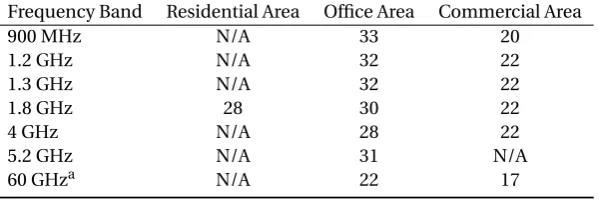
Table 3.3 shows representative values for the power loss coefficients, N, as given by the ITU and table 3.4 gives values for the floor penetration loss factor,Pf(n).
Frequency Band Residential Area Office Area Commercial Area
900 MHz N/A 33 20
1.2 GHz N/A 32 22
1.3 GHz N/A 32 22
1.8 GHz 28 30 22
4 GHz N/A 28 22
5.2 GHz N/A 31 N/A
60 GHza N/A 22 17
a60 GHz is assumed to be in the same room
TABLE3.3 - Power Loss Coefficient Values,N. ITU (2005)
Frequency Band Residential Area Office Area Commercial Area
900 MHz N/A 9(n=1) N/A
N/A 19(n=2) N/A
N/A 24(n=3) N/A
1.8 - 2 GHz 4n 15+4(n−1) 6+3(n−1)
5.2 GHz N/A 16(n=1 only) N/A
n is the number of floors penetrated (n≥1)
TABLE3.4 - Floor loss penetration factor,Pf(n). ITU (2005)
Log Distance Path Loss Model
The Log Distance Path Loss Model is an indoor radio propagation model that predicts the path loss a signal encounters inside a building over distance and is formally expressed in equation 3.3b.P L(d0) can be measured empirically at distanced0or calculated with the free space
equa-tion shown in equaequa-tion 3.3a. The log-distance path loss model is a modified power law with a log-normal variability, similar to log-normal shadowing.
P L(d0) =20 log10(f)+N·log10(d0)−27.54 (3.3a)
Lt ot al =P L(d0)+N·10 log10 d d0 +
Xg (3.3b)
where,
P L(d0) = The free space loss at reference distanced0. Unit: Decibel [dB] f = Frequency of transmission. Unit: megahertz [MHz].
d0= The reference distance. Unit: Metre [m]
Lt ot al= The total path loss inside a building. Unit:Decibel [dB] d= The length of the path. Unit: Metre [m]
N = The path loss distance exponent.
Xg = A Gaussian random variable with zero mean andσ dB standard deviation.
3.5.3 Evaluation Path Loss models
Both algorithms, “ITU indoor path loss model” and “Log Distance Path Loss Model” are evalu-ated using Matlab. For this evaluation a grid with known positions and known distances to the
[image:26.595.129.438.307.381.2]3. Positioning using WLAN infrastructure 17
AP, at the hallway of the Control Group has been created. The DriverWOM program is used to scan the environment and retrieve RSSI information. The DriverWOM program run on laptop. At each point in the grid, 150 RSSI measurements where taken and saved in a CSV file witch could can be imported by a Matlab script.
In the hallway two Acces-Point are present; AP-8242 and AP-8252, see figure 3.2. The Matlab script read CSV file and calculate the disctance to the two APs using the “ITU indoor path loss model” and “Log Distance Path Loss Model”. The results are compared with the real distances and shown in figures 3.4 and 3.5.
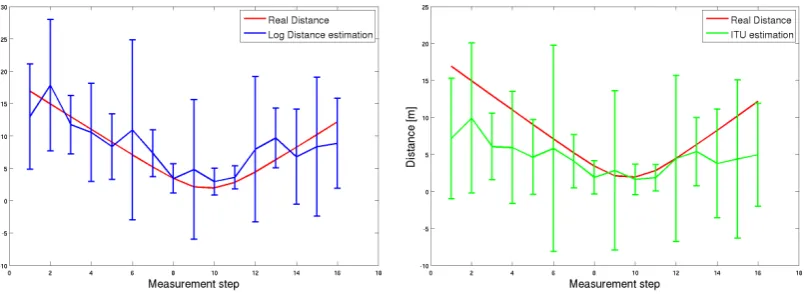
(a) Result using the Log Distance model (b) Results using the ITU model
FIGURE3.4 - Distance estimation when passing by AP-8242
(a) Result using the Log Distance model (b) Results using the ITU model
FIGURE3.5 - Distance estimation when moving from AP-8252
Figure 3.4 shows shows the results when passing by “AP-8242” and figure 3.5 shows shows the results moving from “AP-8252”. In the figures red shows the real distance to the Access-Points. Blue the estimated distance using the “Log Distance Path Loss Model”. Green represent the estimated distances using the “ITU indoor path loss model”. The figures shows that the esti-mated distances follows the real distances but the error increases when the distance from the Access-Points increases. The standard deviation, shown in the error bar, is large and could give problems in estimation positions using trilateration.
The increasing error when the distance to the Access-Point increased can be partly explained by the fact that the models include wall attenuations and these measurements where taken in line-of-sight of the APs. The high standard deviation can be explained by the environment
[image:27.595.111.515.219.366.2] [image:27.595.105.514.425.583.2]18 A software solution for absolute position estimation using WLAN for robotics
in whitch this experiment was taken. The experiment was taken on a typical workday. This means lots of computers,laptop and people witch can/are interfering with the measurements. Speaking from experience; the standard deviation will decrease on a quit day. This has however less impact on the mean value.
3.6 Trilateration
3.6.1 Background
Trilateration is a method of determining the relative positions of objects using the geometry of triangles in a similar fashion as triangulation. Unlike triangulation, which uses angle measure-ments to calculate a location, trilateration uses distances to known locations of tree or more reference points. To accurately and uniquely determine a location on a 2D plane at least 3 ref-erence points are needed. The basic problem is to find the intersection of 3 or more spheres with radiusli. This can be formalize in finding a solution [x y z]Tto the three or more nonlinear
equations shown in equations 3.4.
(x−x1)2+(y−y1)2+(z−z1)2=l12
(x−x2)2+(y−y2)2+(z−z2)2=l22
(x−xi)2+(y−yi)2+(z−zi)2=li2
(3.4)
WherePi=(xi,yi,zi),i=1, 2, 3 are coordinates of access-pointi andli is the distance
estima-tion associated with it, see figure 3.6(b).
3.6.2 Implementation
Linearization Method
From the problem of finding the intersection of several spheres, formalized in equation 3.4, a linear system, 3.5, can be constructed. The linearization process converts the problem into finding the point of intersection of several planes. This linearization process is in detail de-scribed in appendix C and results in 3.5 withA,−→x and→−b defined by 3.6.
A−→x = −→b (3.5)
with, A =
(x2−x1) (y2−y1) (z2−z1)
(x3−x1) (y3−y1) (z3−z1)
..
. ... ...
(xn−x1) (yn−y1) (zn−z1)
, −→x =
x−x1 y−y1 z−z1
, − → b b21 b31 .. . bn1 (3.6) where,
xi,yi,zi= The coordinates of access-pointi.i=1, 2, . . . ,n. n= Number of Acces-Points found.
The linear system 3.5 has (n −1) equations with three unknowns in xyz-plane or two unkowns in the xy-plane. Therefore, theoretically three reference points (n=3) are needed to determine a position in a xy-plane. Position (−→x) can derived with equation 3.7.
−
→x = A−1
∗→−b (3.7)
Coordinate-free method
A coordinate-free solution for trilateration is written by Thomas and Ros (2005). The propose method is an alternative closed-form formulation for trilateration based on constructive
3. Positioning using WLAN infrastructure 19
ometric arguments. By using barycentric coordinates (see figure 3.6(a)) a formula is derived (equation 3.8) containing a few number of Cayley – Menger determinants. Cayley – Menger determinants are used to characterize euclidean spaces in terms of distances between points. The formulation given by Thomas and Ros (2005) is coordinate-free because it only deals with inter-point distances. Hence, its numerical conditioning is independent from the chosen ref-erence frames.
p4=p1+
1
D¡
p1,p2,p3¢
·(−D¡
p1,p2,p3;p1,p3,p4¢·v1
+D¡
p1,p2,p3;p1,p3,p4¢·v2
±
q
D¡
p1,p2,p3,p4
¢
·(v1×v2))
(3.8)
where:
D(...) is a Cayley – Menger determinant.
piare point in the tetrahedron, see figure 3.6(b)
(a) Use of barycentric coordinates (b) Trilateration
FIGURE3.6 - Coordinate-free solution for trilateration. source Thomas and Ros (2005)
3.6.3 Evaluation trilateration methods
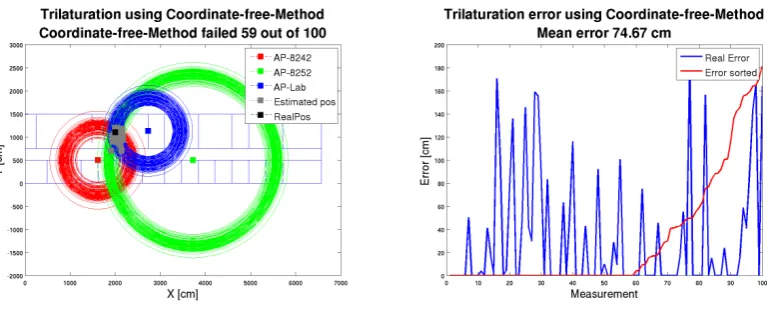
In section 3.5, two models for calculating distances from RSSI measurements where presented. The evaluation shows big variations in the calculated distance. These distances are needed in calculating a position using trilateration. The two trilateration models must be able to cope with these variations in distances. During this evaluation 100 random variations are applied on a simulated real distance. These noisy simulated distances are feeded to the trilateration models. The results can found in figures 3.7 and 3.8.
Figure 3.7(a) and 3.8(a) shows 3 circles. These circles resambles the distance associated with that Access-Point. The location of the Access-Points are the colored square in the center of the cicles. Positions estimated by trilateration are shown in grey. The black square is the real postion (in this case simulated).
[image:29.595.129.482.396.568.2]20 A software solution for absolute position estimation using WLAN for robotics
(a) Dispersion Coordinate-free method (b) Mean error
FIGURE3.7 - Evaluation Coordinate-free Method
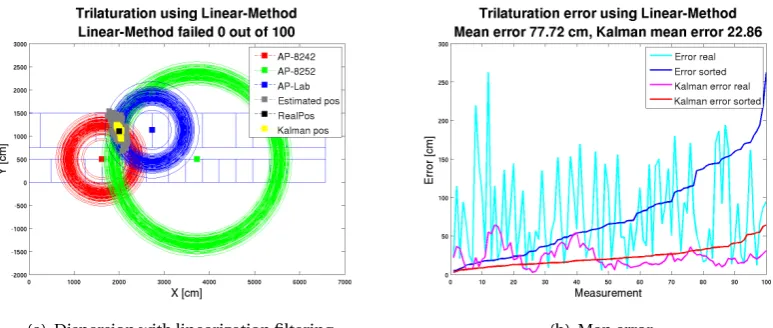
(a) Dispersion Linearization method (b) Man error
FIGURE3.8 - Evaluation linearization method
Figure 3.7(a) show the dispersion of the estimated positions using the Coordinate-free trilat-eration method. This method has an avarage error from the real position of 74 cm, see figure 3.7(b). Besides an avarage error of 74 cm the method was 59 times unable to calculate a posi-tion. A calculation failed when the lengths are not compatible with the size of the base.
Figure 3.8(a) show the dispersion of the calculated positions using the linearization method. This method has a avarage error from the real position of 82 cm and 100% successfully, see figure 3.8(b). The Coordinate-free method has a lower mean error but it is a false assumption to think it is beter then linearization method. The Coordinate-free method fails 59 times, each time it fails the error is zero. This has big impact on the mean value.
It can be concluded that the lineare trilateration method results in relaible positions because it never fails.
3.7 Kalman filtering
3.7.1 Background
Kalman filtering is a widely used filtering method to estimate states in a dynamic system from noisy measurements. It uses an internal system model to make a prediction of the next mea-surement where all the noise vectors are neglected since they are unknown. As soon as the new
[image:30.595.90.477.83.245.2] [image:30.595.85.471.104.472.2] [image:30.595.93.475.300.464.2]3. Positioning using WLAN infrastructure 21
measurement is available a correction is made on the estimated state vector based on the dif-ference between the predicted and actual measurement. The weight of this correction, called the Kalman gain, is determined by the ratio between the covariance of the measurement and process noise.
The model used in Kalman filters is a state space description of the model added with noise processes. Equation 3.9 show the general form of a linear state space model with noise factors.
xk=Axk−1+Buk−1+wk−1
yk=C xk+vk
(3.9)
where:
wk−1is the system noise with normal probability distribution:p(w)∼N(0,Q) vkis the measurement noise with normal probability distribution:p(v)∼N(0,R)
The kalman filter algorithm is given in equation 3.10 and resembles a predictor – corrector al-gorithm. Equations 3.10a and 3.10b as predictor and 3.10c, 3.10d and 3.10e the corrector.
ˆ
xk=Axk−1+Buk−1 (3.10a)
ˆ
Pk=APk−1AT+Q (3.10b)
Kk=PˆkCT¡CPˆkCT+R¢− 1
(3.10c)
xk=xˆk+Kk(zk−Cxˆk) (3.10d)
Pk=(I−KkC) ˆPk (3.10e)
A kalman filter can be tuned by adjustingQandR. When the measurement error covariance
Rin equation 3.10c approaches to zero, the gainKkweights the (zk−Cxˆk) more heavily. This
means that the actual measurementzk is “trusted” more and more, while the predicted
mea-surementCxˆkless and less. When ˆPkapproach to zero the gainKkweights the (zk−Cxˆk) less
heavily.
3.7.2 Implementing
When the movement of the target is unknown it can be modeled as a Brownian motion. Equa-tion 3.10a act as predicter for the Kalman filter. It wil predict unknown movement of the target using Brownian motion. The state space equation for Brownian motion is shown in equation 3.11. x ˙ x y ˙ y k =
1 4T 0 0
0 1 0 0
0 0 1 4T
0 0 0 1
k−1 · x ˙ x y ˙ y
k−1 + 0
wvx
0
wvy
k−1
(3.11)
3.7.3 Evaluation kalman filter
The Kalman filter is evaluated on the performance using the simulated noisy positions from trilateration evaluation. This evaluation is discribed in section 3.6.3 on page 19. The results of feeding these simulated positions to the Kalman filter are shown in figures 3.9 and 3.10.
22 A software solution for absolute position estimation using WLAN for robotics
Figure 3.9(a) and 3.10(a) shows 3 circles. These circles resambles the distance associated with that Access-Point. The location of the Access-Points are the colored square in the center of the cicles. Positions estimated by trilateration are shown in grey. Posistions filtered with the Kalman filter are shown in yellow. The black square is the real postion (in this case simulated).
(a) Dispersion with Coordinate-free method (b) Mean error of Coordinate-free method
FIGURE3.9 - Evaluation Coordinate-free method and Kalman filtering
(a) Dispersion with linearization filtering (b) Man error
FIGURE3.10 - Evaluation linearization method and Kalman filtering
It can be seen from both figures that the mean error is reduced when filtered by the kalman filter. The reduction in the mean error is biggest using the linearization method. This can be explained due to the fact that the dispersion on the linearization method positions resembles with White Noise and the dispersion in Coordinate-free method not. The kalman filter per-forms optimal when the noise is White Noise. The Coordinate-free method has no White Noise because it failed half the time and when the method failed it saves the last know location. If the method saves an error instead of the last know location the Kalman filter will fail totally.
3.8 Evaluating WLAN positioning
This section describes the evaluation of the WLAN position module. The global architecture for this module is shown in figure 3.1 are performed on a fixed point target and on a moving target, both with known real positions. Details about the results are shown in appendix D.
3.8.1 Fixed point target
During this experiment the DriverWOM program scans the environment while fixed on a
[image:32.595.88.479.146.313.2] [image:32.595.88.475.360.524.2]3. Positioning using WLAN infrastructure 23
fined point. The results are shown in appendix section D.1.
Figures in appendix section D.1 and 3.11(a) shows the location of the Access-Points with the colored squares. Positions estimated by trilateration are shown with a blue + and the Kalman filtered with the yellow +. The black square is the real postion.
(a) Positions (b) Errors
FIGURE3.11 - ITU path loss and linear trilateration
Estimating a position on a fixed point only get good results when using the ITU path loss model and the linear trilateration method, see figure 3.11. The other test, see figures D.2, D.3 and D.4, have a mean error too large to be of any use. The Coordinate-free trilateration method, see figures D.2(a) and D.4(a), fails to calculate a position in 99% of the time and with a mean error above the 13 meters (figures D.7(b) and D.9(b)) the position are also very unreliable.
3.8.2 Moving
During this experiment the DriverWOM program scans the environment while moving on a defined path acting as a moving target. The results are shown in appendix section D.2.
Following a moving target has bad results on all four tests, see pictures D.7, D.8, D.9 and D.10. With linear trilateration method the dispersion is to high that even a slow kalman filter cannot fix it, see figures D.8(a) and D.10(a). The mean error (figures D.8(b) and D.10(b)) of the kalman filtered positions is between the 6 and 8 meters is too high, even for orientation purposes. The Coordinate-free trilateration method, see figures D.7(a) and D.9(a), fails to calculate a position in 90% of the time and with a mean error between 7 and 8 meters (figures D.7(b) and D.9(b)) the position are also very unreliable.
3.8.3 Conclusion evaluation WLAN positioning
The conclusion of this evaluation is that positioning using the ITU path loss model and the lin-ear trilateration can be used for position estimation. With a mean error under the 3 meters (see figure 3.11(b)) and little dispersion (see figure 3.11(a)) after kalman filtering, it is able to locate a position on room basis. This can be used for orientation and room specific information.
The conclusion of positioning when moving is that due to the dipersion of estimated postions Navigation and orientation are not possible.
25
4 Implementation
4.1 Introduction
The demonstrator must show the capabilities of the chosen framework and the findings of positioning using the WLAN infrastructure. Orocos is chosen to be best suitable as software framework for robotics, see section 2.4. In this chapter the findings of implementing and the evaluation of the implementation are discussed. For the implementation the JIWY (section 4.3 and figure 4.2(a)) is chosen as test platform. Information of terminology used in chapter can be found in appendix F.
Orocos will be used in mechatronic setups like robots, interacting and controlling the mechan-ical setup. The performance of low level cq. loop control is therefore an import aspect. The performance of low level cq. loop control relies heavily on timing constraints due to discreet nature of using computers. The Orocos framework will be compared on these timing con-straints with the existing method, gCSP and CT, used at the Control Lab. This is explained in section 4.4 and 4.5. The results are discussed in section 4.6.
4.2 Positioning using WLAN
With the result from positioning of a moving target, discussed in section 3.8, it is not feasible to track a moving target. This excludes demonstrating tracking a moving target using the WLAN positioning as proposed in section 1.1.
The results of positioning on a fix position are much better and can be used for orientation purposes, like “In which room am I”, “Where is the nearest recharge station” etc. . . . The posi-tioning becomes part of world-modeling as can be seen in figure 4.1. This figure shows the top level (supervisory control) in the advised structure (figure 2.1) for the TUlip robot
FIGURE4.1 - Position WLAN positioning in framework
4.3 Test platform
JIWY is a mechatronic setup for holding a camera. The construction contains two joints that allow the camera to rotate on a horizontal axis and a vertical axis. The maximum swing is limited by mechanical end stops. The maximum angles between the end stops are respectively 300o and 150o. These end stops prevents full swings so that the wires cannot be twisted or damaged. Each joint is equipped with one DC motor and one incremental encoder. The JIWY is connected to a PC-104 embedded PC with an anything I/O card, see figure 4.2(a). On this stack Linux with RTAI 3.5 is installed.
26 A software solution for absolute position estimation using WLAN for robotics
(a) Test setup with a PC/104 and JIWY (b) Timing measurement method
FIGURE4.2 - Test setup and timing measurement method
Timing measurement setup
Timing performance will be measured using an oscilloscope and the parallel port. Figure 4.2(b) shows how to measure the operation time. Writing a value to the parallel port add a fixed la-tency of 2µs. This implies that the measured time on the oscilloscope includes 2µsswitching time of the parallel port. With the option “persist on” on the oscilloscope the variation in start time can be shown and measured.
Timing performance will be measured in two situations;idle loadandheavy load. In idle load, a minimum of background processes are active, all the systemload is from its own execution. Under heavy load, resource intensive processes are running next to the process own execu-tion. The hard real-time process must operate without performance loss due to these resource intensive processes.
4.4 JIWY with Orocos
This section will explain how the software for controlling the test setup is build using the Orocos framework. Extra information about the basics using Orocos can be found in appendix E.
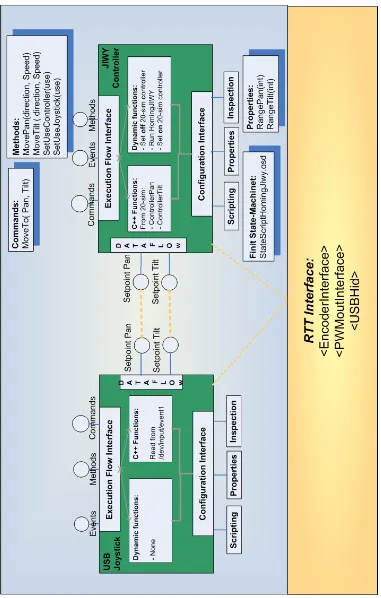
The software for the JIWY setup, shown in figure 4.3, contains two Orocos components. The “Joystick” component generates setpoints for the “JIWY Controller” component which calcu-late the control signals. Both components are build using the "TaskContext" primitive (figure E.3) and connected with each other through the ports Pan and Tilt. The “JIWY controller” is connected with the hardware through the abstract layer for device Interfaces. This layer ab-stracts away hardware specific code which implies that a Orocos component has the same set of functions for different hardware. Appendix A contains a detailed structure of the software for the JIWY setup.
The source of “Joystick” contains code for reading from a native Linux device driver. Interfacing with native Linux drivers cannot take place in RTAIs hard Real-Time environment. Therefore, this component is executed as a Periodic task in Soft Real-Time. The periodic task reads each period from the Linux HID (Human Interface Device) driver. Within Orocos this Periodic task is given the lowest priority. Time variation in this task has minimal effect on the total system because the “Joystick” generates setpoints and is therefore not part of the Loop-Control, which run in Hard Real-Time. Drawback from Soft Real-Time and Hard Real-Time constructions is the possibly of starvation of the Soft Real-Time task. This mean that the task is not executed because processes with higher priorities consumes all the CPU recourses.
The “JIWY Controller” calculates the control signals for the JIWY setup. Timing is an important aspect for a stable system. Therefore this “JIWY Controller” is executed in Hard Real-Time and
4. Implementation 27
FIGURE4.3 - Structure JIWY setup in Orocos
given Orocos’ highest priority. By using Orocos’ lock-free port interface, hard real-time compo-nents can exchange data with non real-time compocompo-nents and still maintain hard real-time.
The main code for the JIWY setup is shown in listing 4.1. Here the Components are created and connected with each other, furthermore the behavior of the components are determined. Periodic activities need a priority level and refresh time (in seconds). The RTT activity interface activates each period the periodic function of the Orocos component. A template of a Orocos component is shown listing E.1.
/ * Create the components * /
Jiwy jiwyController("JIWY_controller") ;
usbHid joystick("Joystick") ;
/ * Connect ports and peers * /
jiwyController.addPeer(&joystick) ;
connectPorts(&joystick, &jiwyController) ;
/ * Add component engine to A c t i v i t y i n t e r f a c e * /
PeriodicActivity periodicActivityA(OS: :HighestPriority, 0 . 0 0 1 , jiwyController.engine( ) ) ;
PeriodicActivity PeriodicActivityB(OS: :LowestPriority, joystick.engine( ) ) ;
/ * Confige the component * /
joystick.configure( ) ;
jiwyController.configure( ) ;
/ * Start the component * /
joystick.start( ) ;
jiwyController.start( ) ;
LISTING4.1 - Main Orocos source code
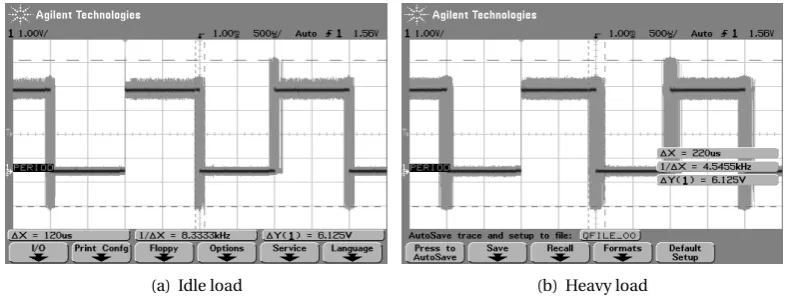
Timing variance in the start time of a periodic task can be measured using the timing measure-ment setup shown in figure 4.2(b). Each time the periodic task starts a bit on the parallel port will toggle. Figure 4.4 show the result of this timing test under idle (figure 4.4(a)) and heavy load (figure 4.4(b)).
In figure 4.4 each rising and failing flank resembles a start of the periodic task. The update frequency during this test is 1KHz and should results in pulses of 1ms. Variations in start time
28 A software solution for absolute position estimation using WLAN for robotics
(a) Idle load (b) Heavy load
FIGURE4.4 - Timing test of the Orocos framework
are shown in gray around the falling flank. Because the oscilloscope triggers on a rising edge no variation are seen on start of the pulse. Variation in start time are shown in variations of the start time of the next update. If this task is late and the next update is on time, the pulswidth is
<1ms. If this update is on time en the next update is late the pulswidth is>1ms.
Figure 4.4(a) shows the timing variations in a system with idle load. The variations are mea-sured using measurement tools on the oscilloscope and has value of 120µs. The timing varia-tions in a system with heavy load (see figure 4.4(b)) are measured 220µs.
4.5 JIWY with gCSP and CTC++
gCSP (Jovanovic et al., 2004) is a graphical tool for creating and editing CSP diagrams (Hilderink, 2005). CSP diagrams are dataflow diagrams, connecting processes with channels. Beside the dataflow, the concurrency structure is also indicated. Next to editing diagrams, gCSP does basic consistency checks and can generate code from the diagrams. The generated code needs the CTC++ library for implementing CSP primitives in modern programming languages and for general purpose microprocessors.
The gCSP-model for the JIWY setup is shown in figure 4.5. This model is used during the course Real-time software developmenti. The setup is controlled by three processes. Pan and Tilt calculates the control signal for the mechanical setup using the control models from 20-sim. Process SanityCheck is a safety layer and checks if the control signals are within defined range to prevent damaging the mechanical setup. A gCSP model is connected with the hardware through linkdrivers. Linkdrivers are objects within the CT library that communicate with hard-ware using the channel interface of CT. Linkdrivers abstract away hardhard-ware-dependent instruc-tions. In figure 4.5 linkdrivers are represented by the blue dots with a “?” or “!”.
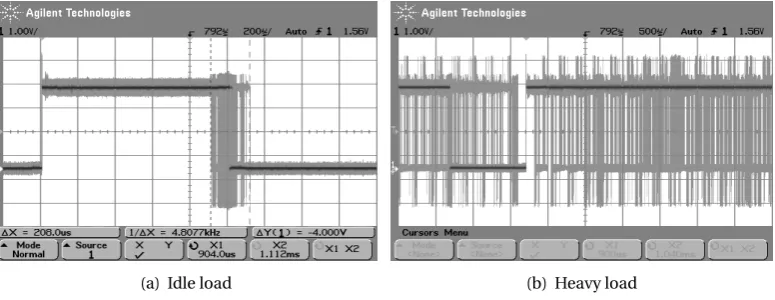
All three processes operate with an 1KHz frequency. To measure and evaluate the performance of gCSP and CTC++, the same timing test as with Orocos are performed. One under an idle system load and one under heavy system load. The results are shown in figure 4.6.
iinfo see:http://www.ce.utwente.nl/bnk/
[image:38.595.86.486.83.234.2]