J. FOR. SCI., 50, 2004 (12): 573–578 573
JOURNAL OF FOREST SCIENCE, 50, 2004 (12): 573–578
The total global emission of CO2 from soils is recog-nized as one of the largest fluxes in the global carbon cycle, and small changes in the magnitude of soil respira-tion could have a large effect on the concentrarespira-tion of CO2 in the atmosphere (SCHLESINGER, ANDREWS 2000). Understanding the role of forests in the global carbon cycling has been regarded to be important when consid-ering the possible role of forests as a significant carbon sink (DENNING et al. 1995; NORBY et al. 1999). In forest ecosystems, as in other ecosystem types, net CO2 is the residual between two large fluxes approximately similar in magnitude but opposite in sign (photosynthetic carbon uptake versus respiratory losses). However, the problem is much more complicated because we do not know whether the presumed forest-ecosystem sink capacity for carbon will continue as the forest stands grow. Sequestration of carbon into forest soil represents a major component of the terrestrial carbon cycle and is of particular interest because it could be a potential sink for carbon (RAICH, SCHLESINGER 1992).
Soil carbon efflux, as an index of the metabolic activity of heterotrophic microbes and plant roots (FANG et al. 1998), is thought to account for 60–80% of ecosystem respiration (EPRON et al. 1999a; DAVIDSON et al. 1998). However, as the efflux of CO2 from the soil is typically characterized by a large temporal and spatial variability, the high heterogeneity introduces an uncertainty in the estimations. Even though soil CO2 efflux has often been measured, more estimates are still required in different ecosystems (depending on site characteristics such as
spe-cies, climate, stand conditions, etc.) to add to the carbon budget establishment of European forests with the aim of better assessment of the contribution of soil CO2.
Our objective was to provide a reliable estimate of soil CO2 efflux in a Norway spruce forest stand using a port-able chamber connected to an infra-red gas analyser, to investigate the relationship between soil respiration and soil temperature and its dependence for a better under-standing of soil CO2 efflux, to achieve the dynamic of soil respiration during the vegetation season.
MATERIALS AND METHODS
Site description
The study was conducted at the Experimental Ecological Study Site Bílý Kříž (49°30´17´´N, 18°32´28´´E, 908 m a.s.l.) in the Moravian-Silesian Beskydy Mountains, Czech Republic. The selected forest plot covers 0.25 ha and is located on a slight slope (13°) with a SSE exposure; it is mainly composed of 22-year-old Norway spruce (Pi-cea abies [L.] Karst.) and silver fir (Abies alba Miller.), 98% and 2%, respectively (density: 2,500 trees/ha, last thinning in 1996). Understorey vegetation covered about 60% of the forest floor and consisted mainly of bilber-ries (Vaccinium myrtillus L.). Leaf Area Index was 7.3 in 1999. The mean annual air temperature is 5.5°C. The mean annual rainfall is 1,100–1,400 mm and no water deficit was reported for the study site during this period (data not shown). Soil is Ferric Podzols on sandstone (flysch
Supported by Government Research Intention of Landscape Ecology No. AVOZ6087904, Grant No. KJB3087301 of the Grant Agency of the Academy of Sciences.
Soil surface CO
2fluxes in a Norway spruce stand
M. A
COSTA, D. J
ANOUŠ, M. V. M
AREKResearch Centre of Mechanism, Ecophysiology and Biotechnology of Photosynthesis,
Institute of Landscape Ecology, Academy of Sciences of the Czech Republic,
Brno, Czech Republic
ABSTRACT: The measurements of soil CO2 efflux in a Norway spruce (Picea abies [L.] Karst.) forest stand are reported for a 6-month period (from May 1st to October 26th 1999). Forest floor CO
2 efflux was measured at four positions using a portable infra- red gas analyser (LI-COR), operating as a closed dynamic system and connected to a portable soil chamber. Soil CO2 efflux was measured 3–4 times per month. Soil temperature at a depth of 5 cm was recorded during the whole period with an interval of ten minutes. An exponential regression was used to describe the relationship between soil temperature and soil CO2 efflux. On the basis of this relationship Q10 values were calculated. The averaged value of Q10 for the studied Norway spruce forest stand was 3.74.
type) according to the F.A.O. classification and is covered with moder-type humus. Soil texture is loamy/sandy- loam with 30–40% of gravel, depth 60–80 cm. The pH/ H2O of the topsoil (0–35 cm) is 4.2 with N deposition of 11.5 kg/ha/year.
CO2 efflux measurement
To assess the soil surface CO2 efflux, four positions were randomly chosen within the experimental plot, in each po-sition a collar (circular-shaped, with a diameter of 16 cm and height of 11 cm) made of opaque PVC plastic material was installed. The collar edge was inserted in the soil to a depth of 5 cm while the upper collar part remained above the soil surface and covers 201 cm2 of soil (the objective of these collars was to provide better stability to the chamber and to locate sites where the measurements had to be done during the vegetation season, i.e. to measure exactly the same place each time). Collars were installed during the first days of May and remained permanently at their loca-tion for the whole data-collecting period. The first meas-urements were done two weeks after collar installation to be sure that soil disturbance due to the site preparation did not interfere in recording the data. The four selected locations represent the soil surface CO2 effluxin situ as a global component, i.e. root respiration, micro- and macro-fauna respiration and organic matter decomposition.
Posi-tions 1 and 2 were located in the inter-row of the stand, position 2 was close to a canopy gap, positions 3 and 4 were located in the row of the stand. The soil surface was free of plants at the collar positions.
A portable system for soil surface CO2 efflux measure-ments consisting of an infra-red gas analyser operating as a closed dynamic system (LI-6250 IRGA, LI-COR, Inc., Lincoln, Nebraska, USA) was used. Carbon dioxide efflux was measured from an opaque PVC cylinder-shape chamber that was hand made following the design of NOR -MAN et al. (1992). Its height was 17 cm with a diameter of 15.1 cm. The chamber is surrounded with a metal ring to gain weight and its edge encircled with neoprene to avoid air-tightness. Further, thermistors PT 1000 (Hit, Inc., Uherské Hradiště, Czech Republic) were perma-nently installed in the ground under each collar at a depth of approximately 5 cm from the soil surface. They were connected to a data logger (Delta-T Ltd., UK) to record the temperature during the whole measurement period (May to October). Every 10 minutes, an averaged temperature value was stored to provide a seasonal course of soil tem-perature for each selected position.
Procedure of soil surface CO2 efflux measurements
The chamber was placed on the collar only during meas-urements and immediately removed after measmeas-urements.
0 5 10 15 20
Month
So
il
te
m
pe
ra
tu
re
(°
C
)
Soil 1 Soli 2 Soil 3 Soil 4
May June July August September October
-10 -5 0 5 10 15 20 25 30 35
Month
A
ir
te
m
pe
ra
tu
re
(°
C
)
May June July August September October
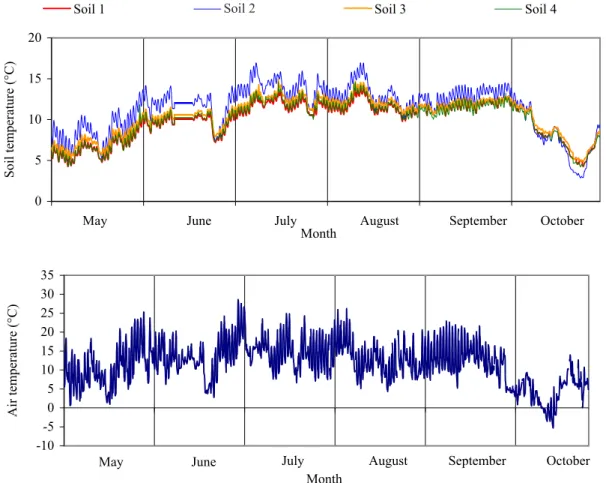
Fig. 1. Soil temperature (°C) at a depth of 5 cm per each measured position and air temperature (°C) at a height of 2 m from May (day 1st) to the end of October (day 26th) 1999 at the study site. Soil 01 – position 1, Soil 02 – position 2, Soil 03 – position 3, Soil 04 – position 4
J. FOR. SCI., 50, 2004 (12): 573–578 575 The respiration rate of each position was estimated as an
average from three series of 12 measurements with a time interval of five seconds, between each series of measure-ments the chamber was opened to permit the decrease of CO2 to ambient concentration and to avoid any effect of temperature inside the chamber. Data were collected only during days without rain to avoid the interaction of water with CO2 (film on soil or on chamber surface). The measurements were done only during the day from 8 a.m. to 6 p.m., on May 17th, 18th and 19th, on July 2nd, 9th and 29th, on June 1st, 20th, 22nd and 29th, on August 2nd, 10th, 24th and 31st, on September 9th, 15th and 22nd, on October 13th, 20th and 21st.
Data analysis
The dependence of soil CO2 efflux on soil temperature has been described frequently (LLOYD, TAYLOR 1994). To test the dependence and relationship between soil CO2 efflux and soil temperature an exponential regression was used:
y = βο . e(β1 . Τ) (1) where: β0and β1 – the regression coefficients,
T – the soil temperature (°C).
From regression (1), a value of Q10 was calculated:
Q10 =e(10 . β1) (2)
where: Q10 – the change in respiration resulting from a 10°C increase in temperature.
RESULTS AND DISCUSSION
The soil temperatures measured at a depth of 5 cm for the four selected positions were very close to each other during the whole vegetation season (Fig. 1). At the begin-ning of May, soil temperatures ranged around the value of 6°C. Then they increased gradually to reach a maximum at the beginning of July where they remained quite stable until the second week in August. The warmest periods were the first week in July and the second week inAugust, where the maximum soil temperature peaked 17°C and 16°C, respectively. However, the summer in 1999 was not so warm in comparison with the previous years. In the second part of October, soil temperature drastically fell to 4°C as consequence of early snow. For 3 of the 4 posi-tions, the temperature trend was of a similar magnitude, daily as well as seasonally. Considering position 2, the daily and seasonal pattern of soil CO2 efflux was higher than at the other three positions. It could be explained by the vicinity of the canopy gap that allowed the surface to become warmer than at the other three positions. The pattern for position 2 continued during all the season until the sudden early snowfall in the middle of October, when it had a lower temperature than the other positions. Air temperature at 2 m height was also recorded, the averaged values were 10.3°C for May, 12.5°C for June, 15.3°C for July, 13.3°C for August, 13.5°C for September and 4.29°C for October.
We plotted the soil surface CO2 efflux obtained during the whole measurement campaign against their current
Fig. 2. Relationship between soil CO2 efflux and soil temperature at a depth of 5 cm for the four measured positions. Soil F01 – position 1, Soil F02 – position 2, Soil F03 – position 3, Soil F04 – position 4Figure 2
R2 = 0.9061
0 2 4 6
0 5 10 15
Temperature(°C)
CO
2
e
ff
lu
x
(
�
mol/m
2 /s)
Soil F01
R2 = 0.9298
0 2 4 6 8
0 5 10 15 20
Temperature (°C)
CO
2
e
ff
lu
x
(
�
mol/m
2 /s)
Soil F02
R2 = 0.9586
0 2 4 6
0 5 10 15
Temperature (°C)
CO
2
e
ff
lu
x
(
�
mol/m
2 /s)
Soil F03
R2 = 0.8998
0 2 4 6
0 5 10 15
Temperature (°C)
CO
2
e
ff
lu
x
(�
mol/m
2 /s)
Soil F04
Temperature (°C) Temperature (°C)
576 J. FOR. SCI., 50, 2004 (12): 573–578 temperatures measured at a depth of 5 cm at the same
measured locations. For each of the four positions we observed a strong correlation when fitting the data. It confirmed the exponential relationship frequently reported in literature (LLOYD, TAYLOR 1994; BUCHMANN 2000). The correlation coefficient ranged from 0.89 to 0.95 (Fig. 2). The highest correlation was found in position 3. Combining the measured data of all four positions a high correlation between soil CO2 efflux and soil temperature was found (r2 = 0.87) (Fig. 3).
Soil CO2 efflux exhibited seasonal variations (Table 1) which clearly reflected seasonal changes in soil temperature (Fig. 1). The monthly average values of measured soil CO2 efflux ranged from 1.64 µmol CO2 m2/s in October with a mean soil temperature of 5.4°C to 4.33 μmol CO2 m2/s in August with a mean soil temperature of 12.2°C.
During the first three months of the measured period all four positions quickly exhibited an increase in soil CO2 efflux. It could be the result of active root growth during spring and early summer. CO2 efflux values for soil posi-tions number 1, 3 and 4 were very close to each other while position 2 showed the highest soil flux; this is prob-ably due to the location itself or others factors, i.e. spatial heterogeneity, sun exposure, microbial activity. BAL
-DOCCHI and MEYERS (1991) and HANSON et al. (1993) pointed out that precipitation, aboveground pressure differences and turbulences above the soil surface could influence the efflux as well, and add more uncertainties to the yet not fully understood processes dealing with the soil respiration. On the other hand, it is well known that forest soil CO2 efflux is usually characterized by a large spatial variability (MOISER 1990). This variability could be explained by a range of biotic and abiotic factors.
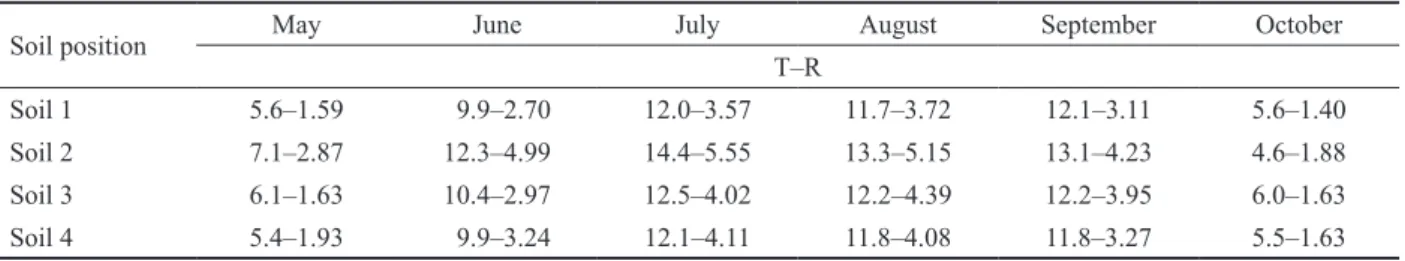
The measured soil CO2 efflux at each position was integrated in a graph according to the day of the year (Fig. 4); all four positions showed a seasonal trend with a maximum in the respiration rate occurring between the middle of July and the beginning of August, the mean respiration rate for all positions combined together was 3.39 µmol CO2 m2/s. The used exponential regression (1) described the relationship between soil temperature at a depth of 5 cm and soil CO2 efflux (Table 2) at four meas-ured positions. The averaged value Q10 for the experimen-tal Norway spruce forest stand was 3.74. KIRSCHBAUM (1995) reported that Q10 of organic matter decomposition was about 2.5 at 20°C and 4.5 at 10°C. Because the soil temperature at the study site ranged from 6°C to 17°C, rather a high Q10 value was not unexpected. However, our Table 1. The average monthly values of measured soil CO2 efflux for each soil position, where T is the mean temperature (°C) at a depth of 5 cm and R is the average measured respiration rate (µmol CO2 m2/s)
Soil position May June July August September October
T–R
Soil 1 5.6–1.59 9.9–2.70 12.0–3.57 11.7–3.72 12.1–3.11 5.6–1.40
Soil 2 7.1–2.87 12.3–4.99 14.4–5.55 13.3–5.15 13.1–4.23 4.6–1.88
Soil 3 6.1–1.63 10.4–2.97 12.5–4.02 12.2–4.39 12.2–3.95 6.0–1.63
Soil 4 5.4–1.93 9.9–3.24 12.1–4.11 11.8–4.08 11.8–3.27 5.5–1.63
R2 = 0.8793
0 2 4 6 8
0 5 10 15 20
Temperature (°C)
CO
2
efflux (
�
m
ol
/m
2 /s
)
Site combination
Table 2. Relationships between soil CO2 efflux (μmol CO2 m2/s) and soil temperatures (°C) at a depth of 5 cm during the 1999 vegetation season. Q10 is the change in respiration resulting from a 10°C increase in temperature
Soil position y = βο . e(β1 . Τ) Q
10
Soil 1 y = 0.65 . e(0.141 . T) 4.09
Soil 2 y = 1.18 . e(0.107 . T) 2.91
Soil 3 y = 0.62 . e(0.152 . T) 4.57
Soil 4 y = 0.89 . e(0.123 . T) 3.42
J. FOR. SCI., 50, 2004 (12): 573–578 577 calculated Q10 is in the range of previously reported Q10
by different authors (EPRON et al. 1999b; BUCHMANN 2000).
CONCLUSIONS
After one season of measurements we concluded that the methodology and equipment used to measure soil CO2 efflux during this study was reliable. From the obtained results it is possible to evaluate a seasonal variability of the soil respiration and its dependence on soil temperature. Even though the quantity of measurements done during the vegetation period of 1999 was not so extensive, it helps to know how much CO2 is given off by forest soil in our region and to make future comparisons between other locations. However, it is evident that long-term measurement campaigns are extremely important for a better estimation of soil CO2 effluxes and for the necessity of profound study of the ability of forest soil to sequester carbon and its importance in the carbon cycle.
References
BALDOCCHI D.D., MEYERS T.P., 1991. Trace gas exchange above the floor of a deciduous forest. 1. Evaporation and CO2 efflux. J. Geophys. Res.,96: 7271–7285.
BUCHMANN N., 2000. Biotic and abiotic factors controlling soil respiration rates in Picea abies stands. Soil Biol. Biochem., 32: 1625–1635.
DAVIDSON E.A., BELK E., BOONE R.D., 1998. Soil water content and temperature as independent or confounded factors controlling soil respiration in a temperate mixed hardwood forest. Global Change Biol., 4: 217–227.
DENNING A.S., FUNG I.Y., RANDALL D., 1995. Latitudinal gradient of atmospheric CO2 due to seasonal change with land biota. Nature, 376: 240–246.
EPRON D., FARQUE L., LUCOT E., BADOT P.M., 1999a. Soil CO2 efflux in a beech forest: the contribution of root respiration. Ann. For. Sci., 56: 289–295.
EPRON D., FARQUE L., LUCOT E., BADOT P.M., 1999b. Soil CO2 efflux in a beech forest: dependence on soil temperature and soil water content. Ann. For. Sci., 56: 221–226.
FANG C., MONCRIEFF J.B., GHOLZ H.L., CLARK K.L., 1998. Soil CO2 efflux and its spatial variation in a Florida slash pine plantation. Plant Soil, 205: 135–146.
HANSON P.J., WULLSCHLEGER S.D., BOHLMAN S.A., TODD D.E., 1993. Seasonal and topographic patterns of forest floor CO2 efflux from an upland oak forest. Tree Physiol., 13: 1–15.
KIRSCHBAUM M.U.F., 1995. The temperature dependence of soil organic matter decomposition, and the effect of global warning on soil organic storage. Soil Biol. Biochem., 27: 735–760.
LLOYD J., TAYLOR J.A., 1994. On the temperature dependence of soil respiration. Functional Ecol., 8: 315–323.
MOSIER A.R., 1990. Gas flux measurement techniques with special reference to techniques with special reference to techniques suitable for measurements over large ecological uniform areas. In: BOUWMAN A.F. (ed.), Soils and the Greenhouse Effect. Chichester, John Willey & Sons Ltd.: 289–301.
NORBY R.J., WULLSCHLEGER S.D., GUNDERSON C.A., JOHNSON D.W., CEULEMANS R., 1999. Tree response to rising CO2 in field experiments: implications for the future forest. Plant, Cell Envir., 22: 683–714.
R2 = 0.6569
0 1 2 3 4 5 6
130 180 230 280
Day of year
Soil CO
2
efflux
(
�
m
ol
/m
2 /s
)
Soil 1 R2 = 0.7211
0 2 4 6 8
130 180 230 280
Day of year
Soil CO
2
efflux
(�
m
ol
/m
2 /s
)
Soil 2
R2 = 0.674
0 1 2 3 4 5 6
130 180 230 280
Day of year
Soil CO
2
e
ff
lu
x
(
�
mol/m
2 /s)
Soil 3 R2 = 0.7819
0 1 2 3 4 5 6
130 180 230 280
Day of year
Soil CO
2
e
ff
lu
x
(�
mol/m
2 /s)
Soil 4
Fig. 4. Seasonal course of soil CO2 efflux during the vegetation period of 1999 in Norway spruce stand. Soil F01 – position 1, Soil F02 – position 2, Soil F03 – position 3, Soil F04 – position 4
NORMAN J.M., GARCIA R., VERMA S.B., 1992. Soil surface CO2 fluxes and the carbon budget of a grassland. J. Geophys. Res., 97: 18845–18853.
RAICH J.W., SCHLESINGER W.H., 1992. The global carbon dioxide flux in soil respiration and its relationship to vegetation and climate. Tellus, 44B: 81–99.
ROUT S.K., GUPTA S.R., 1989. Soil respiration in relation to abiotic factors, forest floor litter, root biomass and litter
qual-ity in forest ecosystems of Siwaliks in northern India. Acta Oecol./Oecol. Plantarum, 10: 229–244.
SCHLESINGER W.H., ANDREWS J.A., 2000. Soil respiration and the global carbon cycle. Bigeochemistry, 48: 7–20.
Received for publication April 9, 2004 Accepted after corrections July 20, 2004
Tok CO
2z povrchu půdy ve smrkovém porostu
M. ACOSTA, D. JANOUŠ, M. V. MAREK
Oddělení ekologické fyziologie lesních dřevin, Ústav ekologie krajiny AV ČR, Brno, Česká republika
ABSTRAKT: V příspěvku je prezentováno měření toku CO2 z půdy ve smrkovém porostu (Picea abies [L.] Karst.) na Expe-rimentálním ekologickém pracovišti Bílý Kříž v Moravskoslezských Beskydech. Tok CO2 byl měřen v kampaních v období od 1. 5. do 26. 10. 1999. K měření byl použit uzavřený gazometrický systém tvořený infračerveným analyzátorem plynů (LI-6250 IRGA, LI-COR, USA), připojeným k přenosné půdní respirační komoře, která byla umisťována na cylindrické základy zapuštěné asi 5 cm hluboko, dlouhodobě umístěné na měřicích stanovištích. Tok CO2 z půdy byl měřen třikrát až čtyřikrát za měsíc. Během celého období byla měřena teplota půdy v hloubce 5 cm v intervalu 10 minut. Pro vyjádření závislosti toku CO2 na teplotě půdy byla použita exponenciální regrese. Z této závislosti byl vypočten koeficient Q10. Průměrná hodnota Q10 pro sledovaný smrkový porost byla 3,74.
Klíčová slova: smrk ztepilý; Picea abies; tok CO2 z půdy; Q10
Tok CO2 z půdy je považován za jeden z největších toků v globálním uhlíkovém cyklu. I malé změny ve ve-likosti půdní respirace mohou mít velký vliv na koncent-raci CO2 v atmosféře. Pochopení funkce lesa v globálním uhlíkovém cyklu bývá považováno za důležité, pokud uvážíme možnou funkci lesa jako významného spotře-biče uhlíku. V lesním ekosystému (stejně jako v ostat-ních typech ekosystémů) je čistý zisk CO2 dán rozdílem mezi dvěma významnými toky přibližně stejně velkými, ale s opačnými znaménky (příjem uhlíku při fotosynté-ze oproti respiračním ztrátám). Tok uhlíku z půdy, na který lze pohlížet jako na „index“ metabolické aktivity heterotrofních mikroorganismů a kořenů rostlin (FANG et al. 1998), se podílí na celkové respiraci ekosystému 60–80 %. Tok CO2 je charakterizován velkou časovou a prostorovou variabilitou. Měření je příspěvkem ke sta-novení uhlíkové bilance evropských lesů s cílem lepšího odhadu podílu CO2 v půdě.
K ohodnocení toku CO2 z půdního povrchu byly ná-hodně vybrány 4 pozice na experimentální ploše, na
kaž-dé pozici byly nainstalovány cylindrické základy vyro-bené z neprůhledného PVC materiálu o průměru 16 cm a výšce 11 cm. Cylindrické základy byly zapuštěny do hloubky 5 cm a povrch základu tvořil 201 cm2 (tyto zá-klady poskytují lepší stabilitu komory a umožňují opako-vat měření na stejné pozici).
Z výsledků měření toku CO2 z půdy vyplynuly sezonní změny (tab. 1), které odrážejí sezonní chody teploty půdy (obr. 1). Měsíční průměrné hodnoty toku CO2 z půdy se pohybovaly od 1,64 µmol CO2 m2/s (v říjnu) s průměr-nou teplotou půdy 5,4 °C do 4,33 µmol CO2 m2/s (v srp-nu) s průměrnou teplotou půdy 12,2 °C. Všechna měře-ní toku CO2 z půdy ze čtyř pozic ukazují sezonní vývoj s maximálními hodnotami respirace v polovině července až začátkem srpna (obr. 4). Průměrná hodnota respirace pro všechny výchozí pozice byla 3,39. Korelační koe-ficient se pohyboval od 0,89 do 0,95 (obr. 2). Nejvyšší korelace byla nalezena na pozici č. 3. Vysoká korelace byla nalezena mezi tokem CO2 z půdy a teplotou půdy (R2 = 0,87, obr. 3).
Corresponding author:
Ing. MANUEL ACOSTA, Ústav ekologie krajiny AV ČR, Oddělení ekologické fyziologie lesních dřevin, Poříčí 3b, 603 00 Brno, Česká republika