S Bandyopadhyay, D S Sharma and R Sangal. Proc. of the 14th Intl. Conference on Natural Language Processing, pages 348–355, Kolkata, India. December 2017. c2016 NLP Association of India (NLPAI)
Document Embedding Generation for Cyber-Aggressive Comment
Detection using Supervised Machine Learning Approach
Shylaja S S, Abhishek Narayanan∗, Abhijith Venugopal∗, Abhishek Prasad∗ Department of Computer Science and Engineering
PES University, Bangalore, India
[email protected], [email protected], [email protected], [email protected]
Abstract
Cyber-bullying may be defined as the em-ployment of technological means for the purpose of harassing, threatening, embar-rassing, or targeting a particular person. It is also possible for Cyber-bullying to have occurred accidentally. One of the major challenges in identifying cyber-bullying or cyber-aggressive comments is to detect a sender’s tone in a particular text mes-sage, email or comments on social me-dia, since what a person may consider to be a joke, may act as a hurting insult to another. Nevertheless, cyber-bullying may prove to be non-accidental in spe-cific cases where a repetition in the pat-tern of text in emails, messages, and on-line posts is existent. In order to curb such a social threat, this Paper proposes the us-age of a combination of document em-beddings along with different supervised machine learning algorithms to get opti-mized results in flagging cyber-aggressive comments. Extensive experimentation in-dicates that the SVM model with rbf ker-nel combined with document embeddings is capable of efficiently classifying unseen test comments with an accuracy score of 88.465 % and has surpassed other models in various evaluation metrics.
1 Introduction
Social media may be thought of as interactive me-dia which let people read and write their views. Social media lets people present their talent as it gives the user freedom to build content and share it with ease, to large groups or to the society. Hence, social media is a platform where users not only
∗Authors contributed equally
generate data, but also consume it. Hence, any per-son having an access to internet holds the ability to produce media contents. As social media is popu-lar among adolescents, cyber-bullying reports are increasing day by day. Smith et al (2008), defined cyber-bullying as an aggressive and intentional be-havior of an individual or a particular group us-ing electronic forms of contact that is carried out repeatedly and over time against an individual or a certain group who cannot easily defend them-selves. Going by the definition of cyber-bullying by Smith et al (2008), any behaviour showing signs of bullying on social media is also consid-ered cyber-bullying. Also, since it occurs online and is anonymous to a certain extent, tracing such behaviour to it’s source can be challenging. Hence there is a need to have an effective cyber-bullying detection system to monitor comments posted in social media and efficiently flag comments as cy-ber aggressive or safe.
The first step in this objective is to obtain manu-ally labelled data for training and testing purposes, in which comments have been collected from var-ious social networking sites and have been la-belled according to whether they are cyber ag-gressive or not. Such labelled comments have been taken from various sources in Kaggle and Github websites. After accumulating a large num-ber of comments from various datasets containing manually labelled comments scraped from various social media sites, they were split into datasets containing 20645 training and 8817 testing com-ments. Corresponding to the comments contained in the datasets, vector representations or document embeddings are generated by Doc2Vec which are subsequently fed to the supervised machine learn-ing algorithms for trainlearn-ing and then predictlearn-ing test labels.
been elaborated in Section 2. The methodology proposed has been explained in Section 3. Sec-tion 4 includes the results obtained. The conclu-sions obtained from these results has been given in Section 5 along with a brief mention of the fu-ture work to be carried out.
2 Related Work
Despoina Chatzakou et al (2017), in an at-tempt to flag cyber-aggressive comments pre-sented a method of classification by identifying behavioural aspects of cyber-bullies which dif-ferentiated their comments from others.They pre-sented a principled and scalable approach for elic-iting user, text, and network-based attributes of Twitter users, by extracting a total of 30 features and identifying the differentiating features. This paper has used word embeddings among their fea-tures.
In order to optimize detection of cyber aggres-sive comments, Vikas S Chavan and Shylaja S S (2015), proposed that using two additional fea-tures, simultaneously with conventional feature extraction techniques like TF-IDF and N-gram, in-creases the accuracy of the system up to 86% us-ing logistic regression. This paper included two new features, which included pronoun capturing and the use of skip-grams.
Liew Choong Hon and Kasturi Dewi Varathan (2015), proposed a cyber-bullying detection sys-tem for tweets, with their focus on five types of words indicating cyber-bullying, which they de-duced through their study. They used keyword matching for flagging cyber-bullying in tweets af-ter capturing the keywords from tweets by various users.
Among other research activities carried out in the field include an effort by Kelly Reynolds and April Kontosthatis (2011), in which the data was accu-mulated from the Formspring.me website and la-belled using Amazon’s Mechanical Turk service. This labelled data was then employed to train a machine learning model to identify cyber-bullying comments through the usage of the weka toolkit. In related text classification problems such as sen-timent analysis of comments, the incorporation of paragraph vectors or document embeddings has been found to be efficient for the purpose of gen-erating dense and low dimensional feature vec-tors for semantically representing entire comments or paragraphs unlike the feature matrices obtained
from standard feature extraction techniques like n-grams or it’s special case bag-of-words. An ex-pedition was carried out by Parinya Sanguansat (2016) in which the employment of an unsuper-vised deep learning technique for numerically rep-resenting text comments in the form of document embeddings or paragraph vectors with machine learning algorithms proved to be more effective than standard methods for the task of sentiment analysis of comments on social media. Since the detection of cyber-aggressive comments is also a binary text classification task, this Paper proposes the incorporation of paragraph vectors as features to be learnt for classification by machine learning algorithms. Various classifiers are subsequently tested and evaluated to come up with an effective model for identification of cyber-aggressive com-ments.
3 Proposed Method
The preliminary step involved in our proposed methodology is to generate a vector sequence for each of the comments in the dataset, that repre-sents the semantic meaning of the document or the comment, which can then be processed by machine learning algorithms to associate test data with labels. We perform extensive experimenta-tion and evaluaexperimenta-tion on several machine learning algorithms and compare the results based on these parameters to find a suitable model which can ef-ficiently perform the task involved.
3.1 Pre-Processing
tained from other models such as word2vec, which may be incorporated as well, but are more pre-ferred in problems involving identification of anal-ogous words or classification of topics in a sen-tence. In order to tackle this issue of obtaining a favourable feature matrix for the task, this Pa-per proposes the incorporation of document em-beddings or paragraph vectors generated through Doc2Vec which is an unsupervised learning algo-rithm to effectively generate semantic vector rep-resentation of comments and paragraphs which fits our purpose, as we deal with multiple line comments as well. Though Doc2Vec consists of two architectures for generating paragraph vec-tors, namely the Distributed Bag of Words (PV-DBOW) and the Distributed Memory (PV-DM ) models, the PV-DM architecture has been incor-porated in our pre-processing step, not only due to the fact that it outperforms the PV-DBOW model as per the report by T Mikolov (2014) but also because it takes into account word order, leading to better results in flagging cyber-aggressive com-ments.
Further details include a brief summarization of the distributed memory model of Doc2Vec as used in our pre-processing step.
In the distributed memory framework, every
com-Figure 1: The above figure portrays framework for the purpose of learning paragraph vectors.This framework includes the addition of paragraph to-ken that is mapped to a vector via matrix D. In order to predict the fourth, word the average or concatenation of this vector with a context of three words is used in this model. The paragraph vector not only represents the missing information from the current context but can also act as a memory of the topic of the paragraph. Figure adapted from the report in T Mikolov(2014)
ment or set of comments and all of the words are associated with a corresponding unique
vec-tor representation for each depicted by separate column matrices for comments and words. The model is trained such that the vector representa-tions play a role in predicting succeeding words, taking into account various contexts which are sampled from the comments. Typically, this pre-diction task is performed by softmax or other multi-class classifiers. The framework performs concatenation operation for aggregating the vector representations. Generally using stochastic gra-dient descent, where the gragra-dients are obtained through the back-propagation algorithm, the vec-tors are then trained. Therefore, since the er-ror may be calculated at each step and be em-ployed to upgrade the parameters of the model, the framework is capable of capturing semantics even though the vectors were initialized randomly. Using gradient descent while performing an infer-ence step , we retrieve the vectors corresponding to a new comment or multiple lines of comments. Thus, once the weights and vectors for seen com-ments are obtained, the inference step helps in re-trieving vectors for unseen comments as well.
In our experimentation, the sentences are
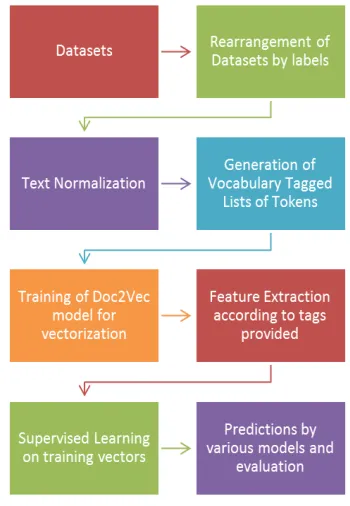
tok-Figure 2: Methodology involved in our proposed method
[image:3.612.336.511.381.634.2] [image:3.612.82.290.425.535.2]the document ids with respect to the files the com-ments come from, because of which the training and testing data is split into a pair of files each con-taining cyber-aggressive and non cyber-aggressive comments. The tags are then conveniently gen-erated with a prefix indicating whether the data is from training or testing dataset and whether it is cyber-aggressive or non cyber-aggressive. This prefix is coupled with a unique index for each comment for uniqueness and to facilitate re-trieval of vectors after training. This aggregation of tagged tokenized comments from training and testing pairs of datasets are shuffled randomly for better training and eliminating any dependency on the order of feeding the input, are then fed to the Doc2Vec model for training. The training has been performed for 10 epochs in order to obtain better results. Though the number of epochs here improves the training and model performance, yet it is not a fixed parameter as such and is to be tuned according to the purpose. Typically 10 epochs is found to be sufficiently suitable for generat-ing favourable features and therefore our experi-mentation includes this parameter as such. After training is performed, we extract the feature vec-tors for training and testing data into separate rays with their corresponding labels in separate ar-rays, for being fed to machine learning algorithms for classification. The number of dimensions of the dense feature vectors has been chosen to be 100, found to be optimum, neither being too high or too low a value for being learnt by machine learning algorithms. Since the training arrays are arranged such that the cyber-aggressive and non cyber-aggressive comments are grouped together, we shuffle the arrays randomly to ensure that the models remain independent of the feeding order of the input vectors.
3.2 Classification
Following are the various Machine Learning Clas-sification algorithms which have been trained us-ing the document embeddus-ings and tested for gen-erating the predicted labels of test data :
3.2.1 Support Vector Machines (SVM)
Support vector machine, commonly referred as SVM, is one of the most common machine learn-ing algorithm used for performlearn-ing binary classifi-cation on data.It has always proved itself worthy in the field of supervised machine learning.They are motivated by the principle of optimal
sepa-ration, the idea that a good classifier finds the largest gap possible between data points of differ-ent classes.Ideally, the classification boundary will be a curve or a hyper-plane that goes right down the middle of the gap between classes, because this would be the classification boundary which will have the maximum distance from the nearest data points (referred to as support vectors). This algorithm being based on the principle of optimum separation, is aimed at finding the largest distance between data points of separate classes. Ideally, the decision boundary for this classifier is a curve or a hyper-plane such that it possesses the maxi-mum distance to the nearest data points known as support vectors. After training for classification task, an SVM is capable of efficiently predicting the class in which other data points fall, since there is only a necessity of few support vectors, due to which other data points may be neglected. We use the following three kernels for the SVM model for flagging cyber-aggressive comments.
linear kernel
K(X, Y) =XTY (1) polynomial kernel
K(X, Y) = (γXTY +r)d, γ >0 (2) rbf (radial bias function) kernel
K(X, Y) =exp(−γ kX−Y k2 /2σ2), γ >0
(3) Where r,d and gamma refer to the kernel param-eters and K(X,Y) corresponds to the dot product of input points mapped into the feature space Y by the transformation function. However, only the results for rbf kernel have been portrayed in Sec-tion 4 since it is found to have maximum accuracy among the three kernels and it also has surpassed other kernels in various other evaluation metrics.
3.2.2 Logistic Regression
Logistic regression refers to the fitting of a linear model to the data which gives a real number. Since this number does not directly contribute to classi-fication, it is fed into the logistic function which is :
σ= 1
1 +e−x (4)
3.2.3 Bernoulli Naive Bayes Algorithm
The Bernoulli Naive Bayes classifier uses the im-plementation of Naive Bayes training along with it’s outstanding classification algorithms for the given data, assuming the data distribution to be a multivariate Bernoulli distribution, wherein mul-tiple features may be included, however individ-ual features are assumed to possess binary values. Hence it is necessary for samples to be represented as feature vectors with binary values. It is there-fore necessary for the classifier implementation to binarize data before learning if the data handled is already not in the required form. Bernoulli naive Bayes’s decision rule is build on :
P(xi |y) =P(i|y)xi+ (1−P(i|y))(1−xi)
(5)
3.2.4 Decision Trees
Decision Trees work on a sequence of test queries and answers with conditions which have been structured as a tree. In such trees, the root node and internal nodes consist of characteristic test conditions for the purpose of segregating data with different attributes. The terminal nodes of such trees possesses an assigned label which is typi-cally a 0 or a 1. For the purpose of classifica-tion using a decision tree, the process begins at the root node where the test condition is applied to a data instance. Depending on the result of this step, the relevant branch is chosen and followed subse-quently, thereby leading to either another internal node where a different test case is to be applied to decide the further path or to a terminal leaf node, where the data instance is associated with a class label.
3.2.5 Random Forest Classifier
Random Forest Classifiers are composed of set of diverse decision trees with the incorporation of randomness in their construction. The predictions of the individual classifiers are averaged to gener-ate the prediction of the ensemble. The individual trees of such an ensemble are sampled from the training set with replacement. In these trees, when a particular node is split, the split is performed only after discovering the best way of splitting among a subset of features which are chosen ran-domly instead of the set of all features. There-fore, random forest classifiers possess greater bias than a single tree without randomness. However this is compensated, often in excess by the lower
variance of random forests due to which an overall good model is created.
4 Results
Extensive experimentation is performed by testing and evaluating the models using the test dataset consisting of 8817 comments in all.A detailed comparison has been made by applying various evaluation metrics on the different models.
4.1 Evaluation Metrics on various Models
The various evaluation parameters that we have applied to compare the models when applied to the test dataset are as follows :
4.1.1 Accuracy score
The accuracy score is a metric used in multi-label classification tasks, which corresponds to a mea-sure of the number of data samples which have been accurately labelled according to the set of test labels provided.
4.1.2 K-Fold Cross Validation
For evaluating a model using the K-fold cross-validation technique, we take the original sam-ple and then randomly split it into equal sized k sub-samples , of which only a single sub-sample is assigned for testing purpose, which is known as the validation set. The remaining sub-samples are used for the purpose of training of the models to be evaluated. We repeat the process of cross-validation k times , taking care that each of these k sub-samples is involved in the process of testing or validation only once. In order to obtain a single value to evaluate the models, the arithmetic mean of all of the k results thus obtained is taken. The value of k has been taken as 20 in our experimenta-tion, but in general k remains an unfixed parameter as such.
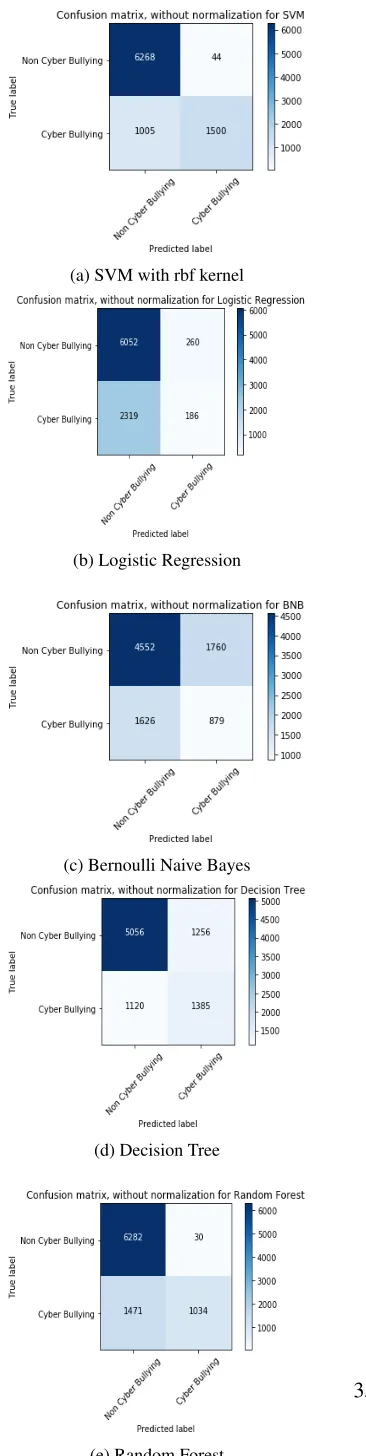
4.1.3 Confusion matrices
A confusion matrix is an evaluation metric which summarizes the prediction results obtained for a classification problem. It provides exact counts of the number of accurate and inaccurate predictions made by a classifier for each class. For a binary classifier, the information provided by such matri-ces include all four possible ways by which data may has been classified as follows :
(a) SVM with rbf kernel
(b) Logistic Regression
(c) Bernoulli Naive Bayes
(d) Decision Tree
[image:6.612.111.294.36.764.2](e) Random Forest
Figure 3: Confusion Matrices for the various mod-els tested
• Frequency of accurate predictions stating an
in-stance to be negative.
• Frequency of inaccurate predictions stating an instance to be positive.
• Frequency of inaccurate predictions stating an
instance to be negative.
• Frequency of accurate predictions stating an in-stance to be positive.
4.1.4 Precision
Precision corresponds to a measure of relevance of the results obtained from a model. It is given by.
P recision= T P
T P +F P (6)
where TP refers to the frequency count of true pos-itives, whereas FP is the frequency count of false positives.
4.1.5 Recall
Recall value is an evaluation metric which corre-sponds to a measure of how many of the results obtained from a model are actually relevant. Re-call may be written as :
Recall= T P
T P +F N (7)
where TP corresponds to the frequency of true positive predictions while the term FNP corre-sponds to frequency of false negative predictions.
4.1.6 F-Beta-score
This metric corresponds to the weighted mean of precision and recall . The best value of this metric when evaluating a model is 1, the worst being 0. The value of beta acts as the factor which deter-mines the weight of precision final score. A beta value less than 1 signifies that precision is weighed more whereas a beta value greater than 1 indicates recall is favoured. A beta value equal to one as used in our evaluation indicates both are weighed equally.
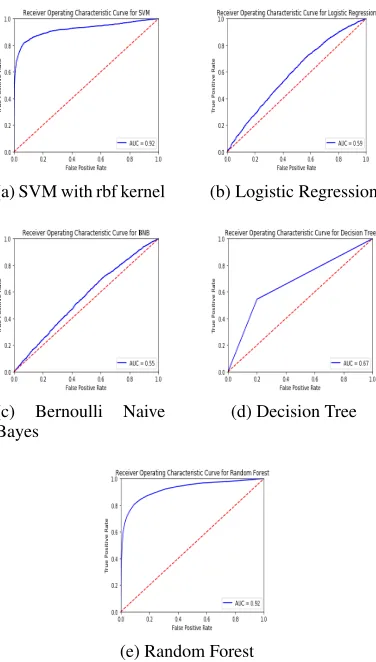
4.1.7 Area under ROC Curve
curve acts as an evaluation metric to obtain an op-timum model. The best value of this score for an ideal model is 1.0.
(a) SVM with rbf kernel (b) Logistic Regression
(c) Bernoulli Naive
Bayes (d) Decision Tree
[image:7.612.316.561.37.299.2](e) Random Forest
[image:7.612.82.570.52.705.2]Figure 4: Receiver Operating Characteristic Curves for the various modes tested
Figure 5: Comparison of the various models based on Accuracy Score and 20-Fold Cross Validation
RESULTS Algorithm Accuracy
Score 20-FoldCross Validation Score
Time con-sumed for training and pre-diction (in seconds)
SVM (rbf
kernel) 88.465 % 82.179 % 1619.232 Logistic
Regres-sion
70.749 % 73.979 % 0.943
Bernoulli Naive Bayes
61.506 % 68.951 % 0.243
Random
Forest 83.033 % 78.759 % 17.489 Decision
Tree
72.734 % 70.666 % 13.303
Table 1: EVALUATION METRICS
RESULTS Algorithm AUROC
Score Precision Recall F-score
SVM (rbf kernel)
0.92 0.89 0.88 0.88
Logistic Regres-sion
0.59 0.63 0.71 0.62
Bernoulli Naive Bayes
0.55 0.62 0.62 0.62
Random
Forest 0.92 0.86 0.83 0.80 Decision
[image:7.612.96.284.116.447.2]Tree 0.67 0.73 0.73 0.73
Table 2: EVALUATION METRICS
Figure 6: Comparison of the various models based on AUROC Score and F1-Score
[image:7.612.83.538.571.702.2]4.2 Inference
Based on our experiments with the tested mod-els , in labelling the test comments as cyber aggressive/non cyber aggressive, we have made a detailed summarization of various models. The metrics results have been specified in Table 1, Table 2 and in figures 3-6. Table 1 reflects the contrast between the models with respect to accuracy score, 20-fold cross validation score and time consumed for training and prediction, whereas in Table 2, we have evaluated the models based on AUROC-Score, precision, recall and f-score. Our evaluation of the tested models indicate that the highest accuracy achieved is that of the SVM model using rbf kernel, which is approximately 88.465% with an AUROC score of 0.92. Having surpassed other tested models in effectively labelling the unseen test dataset, such a model may effectively be used to flag cyber-aggressive comments which may later be used to estimate the performance of a manual based flagging system over automated approaches.
5 Conclusion and Future Work
In this Paper, we have proposed the usage of Doc2Vec to generate paragraph vectors or docu-ment embeddings as features for supervised ma-chine learning for flagging cyber-aggressive com-ments. Document embeddings have been gener-ated using Doc2Vec. We built a range of models by learning the vector representations of various comments by few supervised machine learning al-gorithms, and applied various evaluation metrics on the models to obtain a good efficiency in clas-sifying comments. As a consequence of such an experiment, we found that the Doc2Vec ap-proach coupled with SVM classifier using rbf ker-nel, gives an increased accuracy of approximately 88.465% in labelling test comments as cyber ag-gressive/non cyber- aggressive.
Further future work may be directed towards fur-ther optimization of the results obtained by apply-ing deep learnapply-ing techniques to the existapply-ing model. Further work may also be directed towards incor-porating an application programming interface for real time identification of cyber-aggressive com-ments on social media using a model efficient in terms of both accuracy in classification as well as time taken.
References
Despoina Chatzakou, Nicolas Kourtellis, Jeremy Blackburn, Emiliano De Cristofaro, Gianluca Stringhini, and Athena Vakali. 2017. Mean birds: Detecting aggression and bullying on twitter. arXiv preprint arXiv:1702.06877.
Vikas S Chavan and SS Shylaja. 2015. Machine learn-ing approach for detection of cyber-aggressive com-ments by peers on social media network. In Ad-vances in computing, communications and informat-ics (ICACCI), 2015 International Conference on, pages 2354–2358. IEEE.
L Hon and K Varathan. 2015. Cyberbullying detection system on twitter.IJABM, 1(1).
Jey Han Lau and Timothy Baldwin. 2016. An empiri-cal evaluation of doc2vec with practiempiri-cal insights into document embedding generation. arXiv preprint arXiv:1607.05368.
Quoc Le and Tomas Mikolov. 2014. Distributed repre-sentations of sentences and documents. In Proceed-ings of the 31st International Conference on Ma-chine Learning (ICML-14), pages 1188–1196. Radim Rehurek and Petr Sojka. 2010. Software
frame-work for topic modelling with large corpora. InIn Proceedings of the LREC 2010 Workshop on New Challenges for NLP Frameworks. Citeseer.
Kelly Reynolds, April Kontostathis, and Lynne Ed-wards. 2011. Using machine learning to detect cy-berbullying. InMachine learning and applications and workshops (ICMLA), 2011 10th International Conference on, volume 2, pages 241–244. IEEE.
Parinya Sanguansat. 2016. Paragraph2vec-based sen-timent analysis on social media for business in thai-land. InKnowledge and Smart Technology (KST), 2016 8th International Conference on, pages 175– 178. IEEE.
Peter K Smith, Jess Mahdavi, Manuel Carvalho, Sonja Fisher, Shanette Russell, and Neil Tippett. 2008. Cyberbullying: Its nature and impact in secondary school pupils. Journal of child psychology and psy-chiatry, 49(4):376–385.
a. For training dataset :. http://www.github.com. b. For testing dataset :. http://www.kaggle.com.