Evaluating Energy-Efficiency using Thermal Imaging
Huber Flores
Jonatan Hamberg
Xin Li
Department of Computer Science University of Helsinki
Helsinki, Finland [email protected]
Titti Malmivirta
Agustin Zuniga
Eemil Lagerspetz
Department of Computer Science University of Helsinki
Helsinki, Finland [email protected]
Petteri Nurmi
Lancaster University Lancaster, United Kingdom Department of Computer Science
University of Helsinki Helsinki, Finland [email protected]
ABSTRACT
Energy-efficiency remains a critical design consideration for mo-bile and wearable systems, particularly those operating continuous sensing. Energy footprint of these systems has traditionally been measured using hardware power monitors (such as Monsoon power meter) which tend to provide the most accurate and holistic view of instantaneous power use. Unfortunately applicability of this ap-proach is diminishing due to lack of detachable batteries in modern devices. In this paper, we propose an innovative and novel approach for assessing energy footprint of mobile and wearable systems using thermal imaging. In our approach, an off-the-shelf thermal camera is used to monitor thermal radiation of a device while it is operating an application. We develop the general theory of thermal energy-efficiency, and demonstrate its feasibility through experimental benchmarks where we compare energy estimates obtained through thermal imaging against a hardware power monitor.
CCS CONCEPTS
•Computer systems organization→Embedded systems; • Hardware→Power and energy;Power estimation and optimization; Temperature monitoring.
KEYWORDS
energy measurement, IoT, smart devices, wearable, drones, thermal imaging, thermal sensing
ACM Reference Format:
Huber Flores, Jonatan Hamberg, Xin Li, Titti Malmivirta, Agustin Zuniga, Eemil Lagerspetz, and Petteri Nurmi. 2019. Evaluating Energy-Efficiency using Thermal Imaging. InThe 20th International Workshop on Mobile Com-puting Systems and Applications (HotMobile ’19), February 27–28, 2019, Santa Cruz, CA, USA.ACM, New York, NY, USA, 6 pages. https://doi.org/10.1145/ 3301293.3302364
1
INTRODUCTION
Computing and sensing capabilities of smartphones, wearables and other Internet of Things (IoT) devices are continually increasing. Indeed, most contemporary smartphones are equipped with pow-erful CPUs and wide range of sensors such as GPS or heart rate sensors – with new sensing modalities regularly emerging. As an
HotMobile ’19, February 27–28, 2019, Santa Cruz, CA, USA
© 2019 Association for Computing Machinery.
This is the author’s version of the work. It is posted here for your personal use. Not for redistribution. The definitive Version of Record was published inThe 20th International Workshop on Mobile Computing Systems and Applications (HotMobile ’19), February 27–28, 2019, Santa Cruz, CA, USA, https://doi.org/10.1145/3301293.3302364.
example, the Caterpillar CAT S61 smartphone1integrates built-in thermal imaging and air quality sensors. These advances in sensing, however, have only been followed by moderate improvements in battery technology, making it difficult to fully take advantage of the available sensing capabilities. Indeed,energy-efficiencyremains a critical design goal.
Despite the importance of energy, assessing the energy footprint of mobile and wearable solutions has become increasingly difficult in recent years. The most widely accepted solution has been to use a hardware power monitor (such as Monsoon power meter) to measure energy footprint while the device is being operated. This method generally provides the most accurate and holistic view of instantaneous power usage. Unfortunately, power meters need to be connected between the device being measured and its battery (or other power source). Hence, this approach only works on de-vices that have a detachable battery. While common in the past, detachable batteries are becoming infrequent on latest generations of smartphones and wearables. Furthermore, as computing and sensing capabilities are integrated into small-scale affordable IoT devices, a method for measuring power without access to the device battery is needed. Indeed, rather than consuming power, devices may even generate it, e.g., energy harvesting [10] or fuel cells [4]. While some alternatives to hardware monitors have been devel-oped, such as energy profiles or software based measurements (see section 2), these solutions also are insufficient as they are sensitive to platform and test-bed configuration. Moreover, in the case of software measurements, the energy measurements are affected by the software mechanism gathering them. Novel solutions that are capable of overcoming these limitations of current techniques are thus needed for assessing energy footprint of emerging mobile, wearable, and IoT solutions.
In this paper, we contribute by proposingthermal imagingas an innovative and novel way to estimate power drain of emerging mobile, wearable and IoT devices. In our approach, an off-the-shelf thermal camera is used to monitor thermal radiation emitted by a device while it is operating an application whose energy footprint is being measured. By capturing changes in thermal footprint of the device, differences in energy consumption can be identified. We contribute by developing the general theory behind thermal energy-efficiency, and demonstrating its feasibility through benchmark experiments conducted on two different devices and using three different applications. We demonstrate that, while not sufficient for deriving absolute estimates of energy consumption, our approach
is capable of capturing relative differences in energy footprints of different applications.
2
RELATED RESEARCH
Energy Measurement:For devices with detachable batteries, it is possible to measure the energy drained by the device, by replacing the battery with a laboratory power source. In this case voltage and current can be captured by typical multimeters. For smart TVs and smart refrigerators, we can connect multimeters directly between the wall socket and the appliance. A more advanced alternative for multimeters is a combined power source and measurement de-vice, such as the Monsoon Power Monitor2. However, for newer smartphones and IoT devices, batteries are not detachable, making measurement difficult. For some devices, with partial disassembly we can gain access to the battery and measure energy consump-tion. For others, the battery may be soldered to other components, making measurement impossible.
Power Profiling:Measurements collected with the above methods can be either used directly or they can be used to create apower profilethat gives approximate estimates during runtime use [11]. While this approach can be highly accurate, particularly when esti-mating instantaneous power drain, it is only applicable to devices with detachable batteries as capturing measurements requires using a controlled power source instead of the battery.
Energy modelling:Energy modeling attempts to construct math-ematical models that help to explain energy consumption from computational operations of devices. While models can be used, e.g., to understand long-term effects of sensors on battery life [8] and to develop new mechanisms to mitigate energy consumption issues [13], they are usually limited by factors such as the method used to sample energy use [15], characteristics of the devices or contexts of usage [14]. Embedded software sampling [2] overcomes some of these issues, but the sampling of energy on the device increases power consumption of the device. On the other hand, models that profile energy through hardware measurements by dedicated instruments [1, 9, 12] are not intrusive, but they offer poor generality as the measurements are sensitive to platforms and test-beds used for measurements. Another possibility is to use col-laborative large-scale data collection [6, 16] to characterize energy consumption. While these crowd-based approaches can charac-terize energy usage across a wide range of contexts, they tend to have coarse granularity and only be suitable for aggregate level information.
Mobile thermal sensing:The energy that is periodically radiated by mobile devices makes them heat sources. Several studies have used thermal readings to illustrate the heating behaviour of com-ponents in smartphones. Xie et al. [18] recognize the CPU, GPU and battery as the principal heat generators. Therminator [17] sim-ulates how the temperature of parts of the device is linked with its layers. Paterna et al. [7] models the thermal patterns at circuit board-level considering the variations in ambient condition. While several work offers insights about hot-energy metrics in mobile devices, most of it requires intrusive methods of instrumentation. In this work, we mitigate this issue by modelling the energy profile of
2https://www.msoon.com/online-store
devices using thermal images. Unlike existing work, our approach does not require devices to be instrumented with mechanisms to measure energy consumption.
3
THERMAL ENERGY-EFFICIENCY
Our proposed method for energy footprint estimation relies on common off-the-shelf thermal camera that is used to monitor how the thermal radiation of a device changes as it is being used. In this section we detail the general theory of thermal estimation, and give details of a prototype system that we have developed as a proof-of-concept.
Theoretical Background:In practice, a sensing device always absorbs some of the thermal energy conducted by its heat gen-erating components such as the CPU and battery. Assuming the device is in thermal equilibrium with its environment before any thermal energy is generated, any operations of the device cause heat conduction to the outermost parts of the device, eventually warming up its casing. The casing then radiates thermal power proportional to the fourth power of its temperature, as described by the Stefan-Boltzmann law:P=AϵσT4, whereAis the surface area,ϵis theemissivityof the casing material,σis the constant of proportionality3, andTis the observed surface temperature in degrees Kelvin.
Surface Area Estimation:To estimate size of the surface areaA, we can either conduct a manual measurement to get the dimen-sions or estimate them programmatically from a cropped thermal image of the surface if distance between camera and target device is known. There are standard approaches for detecting and cropping to a Region Of Interest (ROI) in thermal images, such as the seg-mentation algorithms presented by Duarte et al. [3]. For calculating the distance, we can either use an inbuilt depth sensor (CAT S61) or exploit the availability of separate RGB and thermal cameras to perform stereo imaging. Another option would be to use a multi-device setup where 2-4 thermal cameras monitor the multi-device being evaluated from different vantage points. By establishing visual cor-respondence between multiple ROI, the surface area of the object can be estimate when the size of the imaging sensor is known.
Emissivity:Another challenge for thermal imaging is related to emissivity of objects. Emissivityϵis the ratio in which the target emits its energy as radiation compared to an ideal black surface, or blackbody (which hasϵ=1.0). Different materials have different emissivity values, e.g., black plastic hasϵ≈0.95 while emissivity of glass ranges fromϵ ≈ 0.70 to 0.97 depending on production process4. On contemporary smartphones, the cover is typically designed from polycarbonate, which is capable of absorbing a sig-nificant portion of the thermal radiation emitted by the device. However, even with these devices, it is possible to capture thermal radiation through the camera aperture which has better thermal reflectivity. Emissivity of the target surface can also be estimated by comparing it against an object with well-known emissivity value, such as a glass of water. For this, both objects need to have a uni-form temperature (e.g. room temperature) after which we can set P1=P2and solve forϵ1=ϵ1AA21 since we know both temperatures.
This procedure takes some time, but only needs to be performed once for each measured device and its surface materials.
Mobile Thermal Imaging:To estimate the power drain of a de-vice, we measure its thermal radiation using a forward looking infrared (FLIR) camera. In our feasibility evaluation, described in the section 4, we build a prototype based on an integrated FLIR era of a Caterpillar S61 device as the sensor. Besides thermal cam-eras becoming highly available and integrated into smartphones, affordable USB connected cameras (such as FLIR One) are also in-creasingly available. The alternative to a smart phone sensor would be using a standalone thermal camera (e.g. FLIR TG167). These, however, usually lack the capabilities for automatic capturing – convenient for measuring continuous changes in thermal radiation over time.
4
FEASIBILITY EVALUATION
We next demonstrate feasibility of thermal energy-efficiency as-sessment through proof-of-concept benchmarks conducted using three computationally intensive applications and smartphone mod-els. As reference we consider energy measurements obtained on a Monsoon power monitor.
4.1
Experimental Setup
Devices:We consider S5 (i9505) and Nexus (i9250) smartphones as we need models that can be instrumented with the power meter to obtain ground truth energy measurements. We used a thermal camera of the smartphone CAT S60 for capturing the thermal foot-print of these devices while running the applications. We used the pre-installed software of S60 to take thermal images.
Applications:We consider three apps downloaded from Google Play store and chosen as representative examples of apps with high resource consumption. To generalize our results, the apps were chosen from different categories. Only apps compatible with both devices were chosen.
Augment:5is an augmented reality application where one can manipulate and view virtual objects in the physical environment. We used the app to display a virtual chair for 5 minutes, and repeated the experiment 5 times. The average time and power were stable, t=303.24sandp=3138.92mW, respectively.
Chess:6is a puzzle game that implements a minimax algorithm to challenge users. We ran the application with a new game of Chess each time, keeping the game running for 5 minutes at a time. The average time and power were stable,t =304.11sand p=2067.49mW, respectively.
Face recognition:7is an application that allows the device to iden-tify a registered person based on their facial features. We ran the face detection feature of the application for roughly 5 minutes and repeated the experiment 5 times. The average time and power were stable,t=297.55sandp=2509.736mW, respectively.
(a) 100 (b) 50 (c) 10
[image:3.612.320.556.80.326.2](d) 100 (e) 50 (f) 10
Figure 1: Thermal radiation at different battery levels, S5 (a,b,c) and Nexus (d,e,f)
4.2
Battery thermal footprint
As battery life is critical to primary operations of most mobile, wear-able and IoT devices, the devices typically employ power saving techniques that can influence the energy usage. These can poten-tially influence energy estimates even if the device load remains approximately constant over time. Before using thermal images for evaluating energy of apps, we first analyze the differences in thermal footprint when the battery is charged at different levels. To achieve this, we analyze the overall discharging of a battery from 100% to 0%. We took thermal images from the backside of both smartphones. Images are captured each time in intervals of 10, e.g., when battery level is 100%, 90% until 10%. In the last interval, the battery of both devices is drained until reaching 2%. Lastly, a thermal image is taken when the device was completely depleted (off). The draining of the battery between intervals is induced by running a separate resource intensive application (Youtube) on the phone. Right before approaching an interval, each phone is left to cool down for 10 minutes before taking the thermal image for the interval.
Results:We find that thermal radiation captured by the images is similar at different battery levels with an average error in tempera-ture (Celsius) of±0.77 (Figure 1), i.e., the thermal images correctly suggest that device load remains stable over time. However, this is more difficult to observe in power meter measurements since notifications, background services, and other operations of the de-vice cause spikes in instantaneous energy footprint. To highlight
5https://play.google.com/store/apps/details?id=com.ar.augment 6https://github.com/huberflores/CodeOffloadingChess
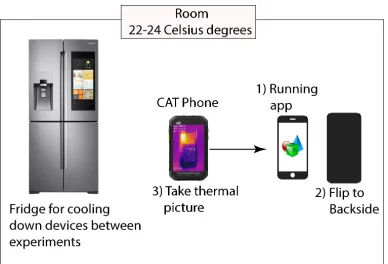
Figure 2: Experimental setup. The FLIR camera of a CAT S60 smartphone is used for taking thermal images of devices running different applications.
this, we measure the average time and power when the device does not have any application in the foreground and just the screen is on, we perform each experiment 5 times, for S5;t =301.60sand p=1167.30mW; and Nexus;t =310.28sandp=2038.21mW, respectively. When the device is completely idle and screen is off, we have, for S5;t = 306.78sandp = 27.98mW; and Nexus; t =308.09sandp = 87.938mW, respectively. Despite devices activating internal operations in the background, or even going to idle mode, thermal imaging can identify resource usage footprints that depict the normal operations of the device.
4.3
App usage thermal footprint
We then proceed to capture the thermal footprint during application usage. Our experimental setup is illustrated in Figure 2. The goal of this experiment is to identify how a thermal image translates into energy footprint for a particular application. In this experiment, we execute three test applications for 5 minutes each, and took thermal images at minute 1, minute 3 and minute 5. We then place the phone into a refrigerator for 5 minutes to cool down the thermal camera before carrying out the next set of measurements. This ensures that the thermal image is representative of the load experienced by the CPU of devices. Cooling down the thermal camera is essential to correctly identify the unique thermal footprint of each application. Five thermal images are taken each time, we use the difference of the temperature between the five consecutive thermal images and take the mean value of them at each time slot as the delta to indicate the energy footprint. In addition, the cooling down period helps to preserve the accuracy of thermal imaging, which otherwise requires continuous re-calibration of the camera [5].
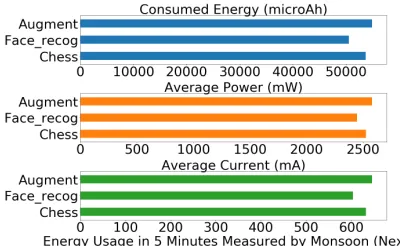
Results:The thermal footprint of applications used in the study is shown in Figure 3 for one minute of execution. We can observe that the thermal radiation emitted by the device intensifies based on the resource intensiveness of the app. For instance, for S5 (top row), we can observe the thermal footprint to be larger for the Augmented app and smaller for the Chess app. Moreover,we can observe a similar pattern for the Nexus device (bottom row). This matches therelative orderingof energy footprint given by our baseline mea-surements obtained with the Monsoon power meter appliance (see Figure 4 and 5), which suggests that it is possible to estimate - at
(a) Chess (b) Face (c) Augment
(d) Chess (e) Face (f) Augment
Figure 3: Thermal footprint of different applications run-ning in devices, S5 (a,b,c) and Nexus (d,e,f). We can observe that each application has its own thermal footprint during runtime.
least on a relative level - variations in the expected energy con-sumption of an app from its thermal footprint. In addition, when we proceed to estimate energy consumption from thermal imag-ing (Table 1), we can still observe that same relative estimations between both remain.
4.4
Limitations
[image:4.612.78.272.81.213.2]Augment Face Chess Monsoon S5 3138.93 2509.74 2067.50 Thermal S5 15544.51 14654.03 14917.53 Table 1: Temperature to energy estimation using thermal sensing: Conversion from Celsius degrees to micro watts us-ing a standard coefficient of1.8991. Total energy consump-tion is estimated in the interval of1−5minusing an integral of30speriods.
[image:5.612.78.268.83.117.2]Figure 4: Energy profile of different applications running in S5 device. Energy estimation is obtained by using Monsoon measurements (baseline).
Figure 5: Energy profile of different applications running in Nexus device. Energy estimation is obtained by using Mon-soon measurements (baseline).
5
DISCUSSION
Naturally, there is room for further research and improvements. We discuss the most relevant points here.
[image:5.612.67.273.201.324.2]Accuracy:While we show that it is possible to relate thermal radia-tion to applicaradia-tion usage, many further details need to be addressed to reach a higher level of accuracy. In our experiments, we took thermal images from the back cover of a device. However, different application heat up different components of the device which can-not be solely captured by a backside picture, e.g., the front screen when using a camera app such as augment. One way in which this can be overcome is by taking multiple pictures from different angles of the device, such that the overall estimation of energy is
Figure 6: Difference in estimated temperatures for different applications running on S5 device. Energy profile obtained from thermal imaging.
aggregated from several images. Other anomalies such as hardware failures, sub-optimal settings of devices, and environmental fac-tors can cause overheating that can influence the accuracy of the thermal imaging estimations.
Sealed devices:Increasingly many devices do not have a detach-able battery and cannot be disassembled to gain access to the in-ternal battery. Indeed, devices with sealed batteries are more con-venient for device manufactures to provide better designs, e.g., thinner and smaller devices; and enhanced features, e.g., water re-sistance. As a result, accessing the battery of devices will require a higher cost of instrumentation. Our method works with all devices, without the need to access the battery. Moreover, it also reduces significantly the cost of examining energy of devices. This is very relevant for large-scale deployments of devices in the wild8. Older vs newer devices:Since the computational capabilities of devices are increasing constantly, the cost of executing an app differs between older and newer devices. This suggest that ther-mal footprint of applications varies between devices. Thus, before estimating energy consumption via thermal imaging, the character-istics of devices need to considered for tailoring thermal imaging for a particular device. We rely on older devices as they provide bet-ter visualization of thermal footprint to distinguish easily different applications.
Multiple contexts:With a charging measurement device such as the Charger Doctor9, we can measure the charging voltage and current when a battery-powered device is being charged via a USB cable. Other traditional measurement tools also work in this type of scenario. However, when we take the device off the charger, we can no longer use such a device. The method presented in this paper is independent of the power source and charging/discharging state of the device. Activity that results in high energy drain on the device will generate heat, and the resulting thermal radiation can be captured with our method, and energy drain estimated.
Heat conduction:In our method, we need to consider other ef-fects, such as external and internal heat conduction.External heat
8
http://mitsloan.mit.edu/ideas-made-to-matter/energy-efficiency-new-mit-company-tests-thermal-imaging-and-analytics-drone
[image:5.612.67.267.383.506.2]conductiononly becomes evident when both the measured device casing and the testbed are coated with highly conductive materials, e.g., aluminum, and they share the surface area. Fortunately, this type of interference is easily corrected by securing the device on a tripod or any weakly conductive platform.Internal heat conduc-tionis observed as thermal energy being transferred through the wires, components, and soldering of the device — especially its copper elements. Non-conducting components shield heat from the thermal camera, slowing its progress to the case. The thermal energy originating from a CPU or the battery also spread over a wide area or conduct to a whole different part of the casing, making component-wise measurement difficult. Another source of heat that can be transferred to devices, it is the one produce when the device enters in contact with the user, e.g., hand holding the device. Surface emissivity:The emissivity of the casing affects how much of the thermal output can be measured. Measuring the thermal radiation of surface materials with a very low emissivity value (e.g. polished aluminium,ϵ≈0.05) may not be possible because of software and hardware limitations. However, this is limitation can be overcome by attaching any highly conductive material with a known emissivity value to the surface, e.g., adhesive copper tape. It should be noted that when attempting to measuring specific components or other areas, only those should be covered with the emissive material to prevent heat distribution. In practice, most devices are made of materials suitable for using our approach. Additional considerations:While our preliminary results demon-strate relative matching between estimated energy appliance and thermal imaging, additional considerations such as ambient tem-perature, thermal estimation duration period, proximity to target (device) estimation, and thermal imaging quality/resolution, among others; are factors to be taken into consideration to further tune our approach. For instance, thermal imaging may need calibration to work in a cold outdoor environment to provide accurate energy estimations. Another example, a drone flying over an IoT deploy-ment needs to get close enough to devices to correctly monitor their energy consumption.
Other applications:While our study focuses on estimating en-ergy consumption of devices, the thermal footprint can be used also to identify heating patterns of individual components and get insights about the relationship between their location and energy efficiency within the structure of devices. In addition, our approach can be utilized to identify anomalies in components, e.g., battery, by distinguishing abnormal behaviors; and to detect energy bugs and computationally heavy applications.
6
SUMMARY AND CONCLUSION
We contributed by developing a novel approach for measuring en-ergy footprint of mobile and wearable systems through thermal sensing, and demonstrated the feasibility of our idea through con-trolled benchmarks. Our initial results suggest that thermal imaging can indeed be used to assessrelativedifferences in energy across applications run on the same device, even if theirabsoluteenergy footprint cannot be estimated. Our approach is useful for emerging sensing solutions running on devices lacking detachable batteries,
such as recent smartphones (latest Apple or Samsung phones have non detachable batteries), smartwatches and fitness trackers.
7
ACKNOWLEDGMENTS
This research has been financially supported by Academy of Finland grants 296139, 297741, 303825 and 317875, and by the Jorma Ollila Grant from the Nokia Foundation.
REFERENCES
[1] Niranjan Balasubramanian, Aruna Balasubramanian, and Arun Venkataramani. 2009. Energy consumption in mobile phones: a measurement study and im-plications for network apim-plications. InProceedings of the 9th ACM SIGCOMM Conference on Internet Measurement (IMC 2009). ACM, Chicago, Illinois, 280–293. [2] Mian Dong and Lin Zhong. 2011. Self-constructive high-rate system energy
modeling for battery-powered mobile systems. InProceedings of the 9th inter-national conference on Mobile systems, applications, and services (MobiSys 2011). ACM, Washington, DC, USA, 335–348.
[3] A Duarte, L Carrão, M Espanha, T Viana, D Freitas, P Bártolo, P Faria, and HA Almeida. 2014. Segmentation algorithms for thermal images.Procedia Technology
16 (2014), 1560–1569.
[4] Rutvik Vasudev Lathia, Kevin S. Dobariya, and Ankit Patel. 2017. Hydrogen Fuel Cells for Road Vehicles.Journal of Cleaner Production141 (2017), 462. [5] Titti Malmivirta, Jonatan Hamberg, Eemil Lagerspetz, Xin Lin, Ella Peltonen,
Hu-ber Flores, and Petteri Nurmi. 2019. Hot or Not? Robust and Accurate Continuous Thermal Imaging on FLIR cameras. InIn Proceedings of the IEEE International Conference on Pervasive Computing and Communications (PerCom 2019). IEEE, Kyoto, Japan.
[6] Adam J Oliner, Anand P Iyer, Ion Stoica, Eemil Lagerspetz, and Sasu Tarkoma. 2013. Carat: Collaborative energy diagnosis for mobile devices. InProceedings of the ACM Conference on Embedded Networked Sensor Systems (SenSys 2013). ACM, Rome, Italy, 1–14.
[7] Francesco Paterna, Joe Zanotelli, and Tajana Simunic Rosing. 2014. Ambient variation-tolerant and inter components aware thermal management for mobile system on chips. InProceedings of IEEE Design, Automation and Test in Europe Conference and Exhibition (DATE 2014). IEEE, Dresden, Germany, 1–6. [8] Ella Peltonen, Eemil Lagerspetz, Petteri Nurmi, and Sasu Tarkoma. 2015. Energy
modeling of system settings: A crowdsourced approach. InProceedings of Inter-national Conference on Pervasive Computing and Communications (PerCom 2015). IEEE, St. Louis, MO, USA, 37–45.
[9] Andrew Rice and Simon Hay. 2010. Decomposing power measurements for mobile devices. InProceedings of IEEE International Conference on Pervasive Computing and Communications (PerCom 2010). IEEE, Mannheim, Germany, 70–78. [10] Sujesha Sudevalayam and Purushottam Kulkarni. 2011. Energy harvesting sensor
nodes: Survey and implications.IEEE Communications Surveys & Tutorials13, 3 (2011), 443–461.
[11] Sasu Tarkoma, Matti Siekkinen, Eemil Lagerspetz, and Yu Xiao. 2014.Smartphone energy consumption: modeling and optimization. Cambridge University Press. [12] Narendran Thiagarajan, Gaurav Aggarwal, Angela Nicoara, Dan Boneh, and
Jatinder Pal Singh. 2012. Who killed my battery?: analyzing mobile browser energy consumption. InProceedings of the 21st ACM International Conference on World Wide Web (WWW 2012). ACM, Lyon, France, 41–50.
[13] Narseo Vallina-Rodriguez and Jon Crowcroft. 2013. Energy management tech-niques in modern mobile handsets.IEEE Communications Surveys & Tutorials15, 1 (2013), 179–198.
[14] Narseo Vallina-Rodriguez, Pan Hui, Jon Crowcroft, and Andrew Rice. 2010. Ex-hausting battery statistics: understanding the energy demands on mobile hand-sets. InProceedings of the second ACM SIGCOMM workshop on Networking, systems, and applications on mobile handhelds. ACM, New Delhi, India, 9–14. [15] Thomas Vincent and Olivier Philippot. 2018. Software Measurement of Energy
Consumption on Smartphones. InGreening Video Distribution Networks. Springer, 127–132.
[16] Jiangtao Wang, Yasha Wang, Daqing Zhang, and Sumi Helal. 2018. Energy Saving Techniques in Mobile Crowd Sensing: Current State and Future Opportunities.
IEEE Communications Magazine56, 5 (2018), 164–169.
[17] Qing Xie, Mohammad Javad Dousti, and Massoud Pedram. 2014. Therminator: a thermal simulator for smartphones producing accurate chip and skin temperature maps. InProceedings of the ACM International symposium on Low power electronics and design (ISLPED 2014). ACM, La Jolla, CA USA, 117–122.