REVIEW ARTICLE
DETERMINANT SAMPLING SCHEME FOR RATIO AND REGRESSION
METHODS OF ESTIMATION
Subramani, J
Department of Statistics, Pondicherry University, R V Nagar, Kalapet,
Puducherry – 605 014, India
ARTICLE INFO ABSTRACT
In this paper, determinant sampling scheme for estimation of a finite population mean is extended for the ratio and regression
estimation. The relative performance of determinant sampling along with those of the simple random and systematic sampling are assessed for certain natural populations for estimation of the finite population means through the methods of ratio an
INTRODUCTION
As stated by Subramani (2009), it is of interests for many research workers in their statistical investigations to estimate the finite population mean
N
i i
Y N Y
1
1 on the basis of a random sample
selected from the populationU, where Uis a finite population S{u1,u2,...,u3} of N distinct and identifiable units. LetY be a real variable with value Yimeasured on Ui,i1,2,3,...,N giving a vectorY(Y1,Y2,...,YN). Any ordered sequence
} U ..., , U , {U } u ..., , u , {u
S 1 2 3 i1 i2 in ,1il Nand1ln
is called a random sample of size n to be used to get an estimate for the population meanY.
*Corresponding author: [email protected]
In several sampling schemes including, simple random sampling, systematic sampling, trend free Sampling, diagonal systematic sampling, generalized diagonal systematic sampling, determinant sampling schemes the resulting sample mean
population mean
schemes such as balanced systematic sampling, centered systematic sampling, truncated systematic sampling, etc, the resulting estimators are not un
the population values. For a detailed discussion about the above sampling schemes and their advantageous, the readers are referred to Cochran (1997),
(1989), (1969)
Subramani and Tracy
ISSN:
0975-833X
International Journal of Current Research Vol.11, pp.222-227, December
Key words:
Determinant Sampling, Simple Random sampling, Systematic Sampling, Natural population,
Linear trend, Trend free sampling. Article History:
Received 12th September, 2010
Received in revised form 15th October, 2010
Accepted 13th November, 2010
Published online 28th December, 2010
ARTICLE
SCHEME FOR RATIO AND REGRESSION
METHODS OF ESTIMATION
Subramani, J
Pondicherry University, R V Nagar, Kalapet,
605 014, India
In this paper, determinant sampling scheme for estimation of a finite population mean is extended for the ratio and regression methods of estimation. The relative performance of determinant sampling along with those of the simple random and systematic sampling are assessed for certain natural populations for estimation of the finite population means through the methods of ratio and regression estimation.
In several sampling schemes including, simple random sampling, systematic sampling, trend free Sampling, diagonal systematic sampling, generalized diagonal systematic sampling, determinant sampling schemes the resulting sample mean yturns out to be an unbiased estimate of the population meanY, where as the other sampling schemes such as balanced systematic sampling, centered systematic sampling, truncated systematic sampling, etc, the resulting estimators are not unbiased unless there is a perfect liner trend among the population values. For a detailed discussion about the above sampling schemes and their advantageous, the readers are referred to Cochran (1997), Murthy (1967), Fountain and Pathak (1989), Mukerjee and Sengupta (1990), Rao (1969), Subramani (2000; 2009 and 2010). Subramani and Tracy (1999) and the references ternational Journal of Current Research
, December, 2010
INTERNATIONAL JOURNAL OF CURRENT RESEARCH
cited there in. It is often used the auxiliary information in estimation techniques of sample surveys to increase the precision of the sample mean. The two important and widely used methods are the ratio and regression methods of estimation, which provide better estimators than the usual estimators based on simple random sampling. These methods involve an auxiliary variable
X
correlated with the study variableY
, and the pair of values(
x
i,
y
i)
is measured for each and every unit in the sample. Further it is assumed that the population meanX
of the auxiliary variableX
is known in advance. This has motivated the present study and the determinant sampling scheme has been extended for estimating finite population means through the methods of ratio and regression estimators. The explicit expressions for the variance of ratio and regression estimators based on determinant sampling scheme are derived. Further the relative performance of determinant sampling, simple random sampling and systematic sampling schemes are assessed for certain natural populations considered by Rao (1969). As a result it has been observed that the determinant sampling scheme performs better than the simple random sampling and the linear systematic sampling means for estimating the finite population mean using ratio and regression methods of estimation.2. Determinant Sampling Scheme
For the sake of simplicity and for the benefit of the readers, the steps involved in selecting a determinant sample of size n from a population of size
N
kn
are reproduced here. LetN
kn
wherenk, be the population size. The population units U1, U2,..., UN are arranged in a
k
n
matrix M (say) and the j-th row of M is denoted byRj, j1,2,...,n. The elements of Rj are {U(j-1)ki,i1,2,...,k}. The determinant sampling scheme consists of drawing nunits from the matrix M randomly such that the selected nunits are from different rows and from different columns of the matrix M. Hence no two selected units are not from the same row or from the same column. The steps involved in the determinant
sampling scheme for selecting a random sample of size n are given below:
1. Arrange the Npopulation units
U ..., , U ,
U1 2 N in an
n
k
matrix M (say).2. Select
n
random numberst
...,
,
t
,
t
1 2 n one by one such thatt
t
i
j wheneveri
j
,t
i beingthe random number obtained at the
th
i
draw, with1
t
i
k
andn
i
1
.3. The selected sampling units are
n t 1)k -(n 2
t k 1
t
,
U
,
...,
U
U
,located respectively in the positions
)
t
)...(n,
t
(2,
),
t
(1,
1 2 n of the matrixM.It is to be noted that the first order and second order inclusion probabilities are obtained as given below:
N i
for k
i , 1,2,3...
1
and
Otherwise
columns different from and rows different from are j and i if k k
ij
0 ) 1 (
1
The first order inclusion probabilities are the same for both the systematic sampling and the determinant sampling schemes but the difference is on the second order inclusion probabilities. The two units in the same column will get the same probability
k
1in the case of systematic sampling
where as the two units from different rows and from different columns will get the same probability
) 1 (
1
k k
in the case of determinant
sampling and zero for other pair of units.
Let Yij be the observation corresponding to the unit
in the ith row and jthcolumn, which is corresponding to the unitU(i1)kj, then the
sample observations are denoted by }
Y ..., , Y , {Y
S t1 kt2 (n-1)ktn . The mean of a
( 1) 2 2 2
) 1 ( 1 )( d k N S NnSc NkSr
k Nn y
V
where
k i n j ij Y Y N S 1 1 2
2 ( )
) 1 ( 1 , k i i
c Y Y
k S
1 2
2 1 ( ) ,
n
i j
r Y Y
n S
1
2
2 1 ( )
n j ij i Y n Y 1
1 ,
k i ij j Y k Y 1
1 and
k i n j ij Y N Y 1 1 1 .
It has also been proved by Subramani and Tracy (1999) that the determinant sampling scheme performs better than the simple random sampling, systematic sampling and stratified random sampling with unit per stratum schemes for the populations with a perfect linear trend among the population values. Consider the hypothetical population with a perfect linear trend among the population values. Then the values of N population units are in arithmetic progression. That is, Yiaib, i1,2,...,N , where
a
and
b
are constants. For the above population with a linear trend, the variances of the simple random sample meanV(yr), systematic sample meanV(ysy),
determinant sample man V(yd) and stratified random sample mean with unit per stratum
)
(
y
stV
are obtained as given below:12 ) 1 )( 1 ( ) ( 2 b N k y V r
,
12 ) 1 )( 1 ( ) ( 2 b k k y V sy ,
n b k n k y V d 12 ] 1 )[ ( ) ( 2 and n b k n k y V st 12 ) 1 )( ( ) ( 2 By comparing the various variance expressions given above, one can easily find that determinant sampling is more efficient than the other sampling schemes. In fact V(yd)V(yst)V(ysy)V(yr)
.The equality sign attains only when
n
1
. The following theorem gives the expression for covariance betweenx
dandy
d, which will be useful for deriving the variances of the Ratio estimator yRd and linear regression estimatory
ld of the population mean Y based on determinant sampling. Here suffices Rdand ldare used to represent ratio and linear regression estimators based on determinant sampling.Theorem 2.1: If
x
i,
y
iare a pair of valuesobserved on the
i
thunit of the population of sizeN
andx
d,
y
dare the corresponding means of a determinant sample of sizen
, then the covariance is given by
xy cxy rxy
d
d k N S NnS NkS
k Nn y x
Cov
( 1)
) 1 ( 1 ) , ( k i n
j ij ij
xy X X Y Y
N S 1 1 ) )( ( 1 , ) ( ) ( 1 1 Y Y X X k
S k i
i i
cxy
, ) ( ) ( 1 1 Y Y X X n S j n i j
rxy
, n j ij i Y n Y 1 1 , k i ij j Y k Y 1
1 and
k i n j ij Y N Y 1 1 1 .
The above theorem can be easily proved by following the steps similar to the theorem 2.3 of Cochran (1977, page 25). When each XijYijthen the expression given above turns out to be the expression given forV(yd).
3. Ratio Methods of Estimation based on Determinant Sampling Scheme
In general the ratio estimator
Y
ˆ
Rof the populationmean
Y
and its varianceV
(
Y
ˆ
R)
are respectively given byX x y
YˆR (3.1)
and
)
,
(
2
)
(
)
(
)
ˆ
(
Y
V
y
R
2V
x
RCov
x
y
V
R
(3.2)where
x
andy
are the sample means of the)
,
(
x
y
Cov
obtained through various sampling schemes in the equation (3.2) given above, one may get the appropriate expressions for the variance of the ratio estimators. The derivations of the above expressions are straightforward and hence they are omitted here and only the final results are given. For the sake of convenience of the readers, the variances of the ratio estimators of the population mean based on simple random sampling, systematic sampling and determinant sampling schemes are given below:
y x xy
Rr S R S RS
Nn n N Y
V(ˆ )( ) 2 2 22 (3.3)
cxy cx
cy
Rsy
S
R
S
RS
Y
V
(
ˆ
)
2
2 2
2
(3.4) ) 2 ( ) 2 ( ) 2 )( 1 ( ) 1 ( 1 ) ˆ ( 2 2 2 2 2 2 2 2 2 rxy rx ry cxy cx cy xy x y Rd RS S R S Nk RS S R S Nn RS S R S N k k Nn Y V (3.5)
4. Regression Methods of Estimation based on Determinant Sampling Scheme
In general the linear regression estimator
Y
ˆ
lrof the population meanY
and its variance V(Yˆlr) arerespectively given by
) ( ˆ y b X x
Ylr (4.1)
and V(Yˆlr)V(y)b2V(x)2bCov(x,y) (4.2)
where
b
is the known constants;x
andy
are thesample means of the auxiliary variable
X
and the study variableY
. By substituting the sample means of the variablesX
andY
obtained through various sampling schemes in the above equation (4.1), one may get the corresponding linear regression estimators for the population meanY
. Similarly by substituting the corresponding expressions ofV
(
y
)
,V
(
x
)
andCov
(
x
,
y
)
obtained through various sampling schemes in the equation (4.2) given above, one may get the appropriate expressions for the variance of the linear regression estimators. If the value of
b
is unknown then it can be replaced by the estimate of the regression coefficient. However it has beenshown in literature (Cochran, 1977) that
V
(
y
lr)
attains minimum when) ( ) , ( x V y x Cov
b . For assessing
the relative performance of determinant sampling with that of simple random sampling and systematic sampling schemes, we have considered the minimum value of the respective variances. The derivations of the above expressions are straightforward and hence they are omitted here and only the final results are given. For the sake of convenience of the readers, the variances of the linear regression estimators of the population mean based on simple random sampling, systematic sampling and determinant sampling schemes are given below:
y r x r xy
lr S b S b S
Nn n N Y
V(ˆ ) ( ) 2 2 2 2 (4.3)
cxy sy cx sy cy
lrsy
S
b
S
b
S
Y
V
(
ˆ
)
2
2 2
2
(4.4) ) 2 ( ) 2 ( ) 2 )( 1 ( ) 1 ( 1 ) ˆ ( 2 2 2 2 2 2 2 2 2 rxy d rx d ry cxy d cx d cy xy d x d y lrd S b S b S Nk S b S b S Nn S b S b S N k k Nn Y V (4.5) Where ) ( ) , ( r r r r x V y x Cov
b ,
) ( ) , ( sy sy sy sy x V y x Cov
b and
) ( ) , ( d d d d x V y x Cov
b . That is,
b
r,b
syandb
darerespectively the regression coefficients obtained through simple random sampling, systematic sampling and determinant sampling schemes.
5. Relative Performance of Determinant Sampling for a Certain Natural Populations
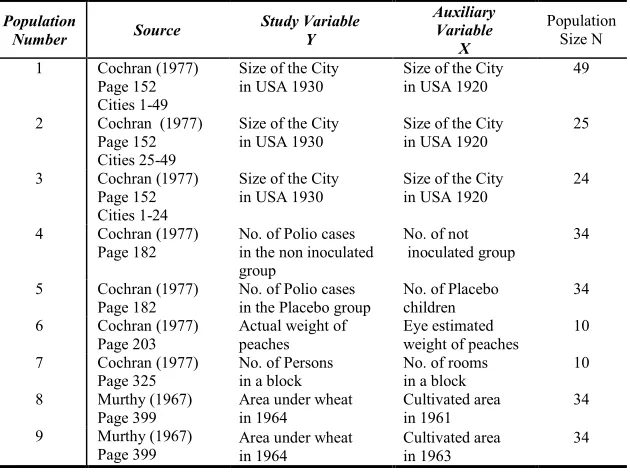
Table 5.1: Description of the Populations considered for the Empirical Study
Population
Number Source
Study Variable Y
Auxiliary Variable
X
Population Size N
1 Cochran (1977) Page 152 Cities 1-49
Size of the City in USA 1930
Size of the City in USA 1920
49
2 Cochran (1977) Page 152 Cities 25-49
Size of the City in USA 1930
Size of the City in USA 1920
25
3 Cochran (1977) Page 152 Cities 1-24
Size of the City in USA 1930
Size of the City in USA 1920
24
4 Cochran (1977) Page 182
No. of Polio cases in the non inoculated group
No. of not inoculated group
34
5 Cochran (1977) Page 182
No. of Polio cases in the Placebo group
No. of Placebo children
34
6 Cochran (1977) Page 203
Actual weight of peaches
Eye estimated weight of peaches
10
7 Cochran (1977) Page 325
No. of Persons in a block
No. of rooms in a block
10
8
9
Murthy (1967) Page 399 Murthy (1967) Page 399
Area under wheat in 1964
Cultivated area in 1961
34
Area under wheat in 1964
Cultivated area in 1963
[image:5.504.136.353.355.478.2]34
Table 5.2: Comparison of Ratio Estimators based on simple random, systematic and determinant sampling for the population
Population Number
n
(
)
Rr
y
V
V
(
y
Rsy)
V
(
y
Rd)
1 7 75.9807 45.8327 80.2353 2 5 139.4397 104.6067 135.2278 3 2 200.6973 322.8438 177.7578 3 127.7119 84.1308 135.1133 4 91.2265 136.7700 77.5781 4 2 2.6903 2.8459 2.7224 5 2 2.2649 2.4256 2.3298 6 2 2.9484 2.9913 2.4026 7 2 60.0763 73.4718 55.9298 8 2 2078.2930 1819.6810 2160.1780 9 2 424.5352 510.3750 411.7852
Table 5.3: Comparison of Linear Regression Estimators based on simple random, systematic and determinant sampling for the population
Population Number
n
(
)
lr
y
V
V
(
y
lrsy)
V
(
y
lrd)
[image:5.504.136.352.515.638.2]auxiliary variable
X
and the population sizeN
. We have considered all possible cases ofk
andn
and hence we have totally 11 cases. The variances of ratio estimators and the linear regression estimators obtained through determinant sampling, simple random sampling and systematic sampling schemes are respectively presented in Table 5.2 and Table 5.3.
The following strategies are used to evaluate the relative performance of the ratio and linear regression estimators based on these three different sampling schemes.
1. An estimator is said to be the best it is has the minimum variance among the estimators considered here.
2. An estimator is said to be the worst it is has the maximum variance among the estimators considered here.
3. An estimator is said to be a favourable estimator if it has minimum variance more frequently and maximum variance rarely.
The following are the tentative conclusions we have arrived at the following conclusions based on the results of the empirical study conducted and the results presented in Tables 5.2 and 5.3 respectively for the cases of ratio estimators and the linear regression estimators. The observations made on the relative performance of these different sampling schemes are as follows:
Among the 9 populations with 11 possible cases considered, the variances of the ratio estimators presented in Table 5.2, the simple random sampling, systematic sampling and determinant sampling have minimum variances respectively in 2, 4 and 5 cases. On the other hand these estimators have maximum variances respectively in 1, 7, 3 cases.
Similar results have been obtained from Table 5.3 for the case of linear regression estimators. That is, the regression estimators
based on simple random sampling, systematic sampling and determinant sampling schemes have minimum (maximum) variances respectively in 2(0), 4(7) and 5(4) cases.
Hence we conclude that for practical purposes one may use the determinant sampling scheme for estimating the population mean through the methods of ratio and linear regression estimation compared to simple random sampling and systematic sampling schemes.
REFERENCES
Cochran, W.G. 1977. Sampling Techniques, 3rd Edition, John Wiley and Sons, New York Fountain, R.L and Pathak, P.L.1989. Systematic
and non-random sampling in the presence of Linear Trends Communications in statistics.
Theory and Methods, 18: 2511-2526.
Mukerjee, R and Sengupta, S 1990. Optimal Estimation of a Finite Population Means in the
Presence of Linear Trend, Biometrika., 77: 625-630.
Murthy, M.N. 1967. Sampling theory and Methods, Statistical Publishing House, Calcutta, India. Rao, J N K. 1969. Ratio and Regression Estimators
– in New Developments in Survey Sampling, Ed. By N L Johnson and H.Smith, Jr., 213-234. Subramani, J. 2000. Diagonal Systematic Sampling
Scheme for Finite Populations, Jour. Ind. Soc. Ag. Statistics 53(2): 187-195.
Subramani, J. 2009 Further Results on Diagonal Systematic Sampling Scheme for Finite Populations, Journal of Indian Society of Agricultural Statistics.63 (3): 277-282.
Subramani, J. 2010 Generalization of Diagonal Systematic Sampling Scheme for Finite Populations. Model Assisted Statistics and
Applications, 5: 117-128.
Subramani, J. and Tracy, D. S. 1999. Determinant Sampling Scheme for Finite Populations.