Long Term Load Forecasting and Recommendations for
China Based on Support Vector Regression
Shijie Ye1, Guangfu Zhu1, Zhi Xiao2*
1
School of Economics and Business Administration, Chongqing City Management College, Chongqing, China
2
School of Economics and Business Administration, Chongqing University, Chongqing, China Email: [email protected], [email protected], *[email protected]
Received July 7,2012; revised August 10, 2012; accepted August 22, 2012
ABSTRACT
Long-term load forecasting (LTLF) is a challenging task because of the complex relationships between load and factors affecting load. However, it is crucial for the economic growth of fast developing countries like China as the growth rate of gross domestic product (GDP) is expected to be 7.5%, according to China’s 11th Five-Year Plan (2006-2010). In this paper, LTLF with an economic factor, GDP, is implemented. A support vector regression (SVR) is applied as the training algo-rithm to obtain the nonlinear relationship between load and the economic factor GDP to improve the accuracy of forecasting.
Keywords: Long Term Load Forecasting; Support Vector Regression; China
1. Introduction
The time horizon for long-term forecasting ranges between a few weeks and several years. For example, the time horizon is set as 5, 10, 20 years ahead for the planning of power systems, the schedule of construction of new gen- erating capacity and the purchase of generating units [1]. It is difficult to forecast load demand accurately over a planning period of this length because there are a large number of factors affecting load characterized by direct or indirect effect on the underlying forecasting process. Moreover, all the factors are uncertain and uncontrollable. Therefore, any LTLF by nature is inaccurate [2]. In the last few decades, many methods have been applied to improve the accuracy of LTLF. These can be classified into parametric and artificial intelligence methods. Para- metric methods construct a statistical model of load by mining the qualitative relationships between load and fac- tors affecting load. These methods, such as multiple lin- ear regression, autoregressive and moving average, need assumed parameters estimated from historical data [3-5]. Usually they can’t deal with nonlinear or random rela- tionships between load and factors affecting load. Recently, artificial intelligence methods including fuzzy logic and artificial neural networks (ANNs) have been implemented as a substitute for parametric methods because of the ro- bustness of the load prediction system and their fitness to nonlinear relationships [6-10]. Other artificial intelligence methods such as dynamic simulation theory (DS) [1], parti- cle-swarm optimization (PSO) [11], fuzzy logic [12,13]
and grey relational grade [14] have been applied, too. Be- sides these, there are also various hybrid methods [8,10, 12,13,15] that combine the ability of individual methods to improve the accuracy of LTLF. However, there are some problems with these methods. Fuzzy logic has difficulty in inheriting the knowledge of the previous mathematical models and is poor at solving logic problems [1]. Multi- layered feed forward network with one hidden neuron layer has drawbacks in that it does not clarify the relationship between input and output variables due to a black-box description [1]. Inherit learning algorithms like DS and PSO have the ability to search for the global optimal so- lutions, but the search need lots of information and data which are limited in LTLF [1].
Recently, a soft computing algorithm based on support vector machines (SVMs), i.e. support vector regression (SVR), has been proposed for load forecasting because of the structural risk minimization (SRM) principle to mini- mize the upper bound on the generalization error. Both SVMs and SVR have been successfully applied to short- term load forecasting already. Ao, Wang and Zhang [16] proposed a hybrid model based on dual support vector machines to deal with short-term load forecasting. The first SVM takes the recent samples in the vicinity of the demand day as training samples, and the second one takes the same season’s load samples in historic years to reflect the season-period rule [16]. Hong applied immune algo- rithm and chaotic particle swarm optimization algorithm separately to confirm the parameters of a SVR model for short term load forecasting [17,18]. SVR has also been integrated with other algorithms like regression to improve
the accuracy of the new hybrid methods [19]. However, compared with application of SVR in short-term load fore- casting, there is far less application in LTLF.
In this paper, SVR is proposed for a five-year load fore- casting within China. And an economic factor, GDP, is included rather than using methods which just employ the historical data of the load [4,6,7-9,11]. It is important to note that total load consumption is a key indicator of eco- nomical growth, especially for recovery from a global eco- nomic recession. Thus, it is necessary to include economic factors in load forecasting. It is also helpful to assess the effect of forecasting results on economic growth. Weather factors are omitted in our study because economical fac- tors are more influential than weather conditions in LTLF [13]. We put focus on the relationship between load and GDP, and discuss the effect of this relationship on the expected economic growth of China to provide recommend- dations. SVR is applied in this paper because of the SRM principle rather than the minimization of training errors which is used by ANNs [18]. So it is feasible to perform LTLF with better accuracy. Besides, SVR provides a map- ping to transfer the actual time series into a multi-dimen- sional space to depict the nonlinear relationship [17] be- tween GDP and load represented by load output, load imports and load export. Moreover, it is not necessary to collect a great amount of historical data for the learning of SVR. Thus, it is easy to implement LTLF with limited data by SVR.
2. Support Vector Regression
Support vector machines (SVMs), proposed by Vapnik [20], are one of the significant developments in overcoming shortcomings of ANNs mentioned above. Rather than by implementing the empirical risk minimization (ERM) pri- nciple to minimize the training error, SVMs apply the str- uctural risk minimization (SRM) principle to minimize an upper bound on the generalization error. SVMs could theoretically guarantee to achieve the global optimum, ins- tead of trapping local optimum like ANNs models. Thus, the solution of a nonlinear problem in the original lower dimensional input space could find its linear solution in
the higher dimensional feature space. Particularly, along with the introduction of Vapnik’s ε-insensitive loss function, SVMs also have been extended to solve nonlinear re- gression estimation problems, which are so-called sup- port vector regression (SVR).
2.1. SVR Function
The key idea of SVMs for regression is the nonlinear mapping. A nonlinear mapping f
* :RnRnh
,
is defi- ned to map the input data
1
N
i i i into a high dime-
nsional feature space, (Figures 1(a) and (b)). Then, in the high dimensional feature space, there theoretically exists a linear function, g, to formulate the nonlinear re- lationship between the input data and the output data. Such a linear function, namely, the SVR function, is as Equation (1),
x y
h
n R
T
g x w f x b (1)
g
where x depicts the numerical forecasting results, and the coefficients w w R
nh
R
*
1
N
i i i
i
w f x
* ,
and b b are adjusta- ble parameters.
The parameter vector w in Equation (1) could be ob- tained as,
(2)
where i i
are obtained by solving a quadratic pro- gram and are the Lagrangian multipliers.
2.2. Minimization of the Empirical Risk
As mentioned above, the SVM method attempts to mini- mize the empirical risk,
1 1
,
N
T
emp i i
i
R g y w g x b
N
(3)
where y g x,
is the ε-insensitive loss function (the
thick line in Figure 1(c)) defined as (4):
, ,
0 otherwise
g x y if g x y
y g x
(4)
In addition, is employed to find the op-timum hyperplane on the high dimensional feature space (Figure 1(b)) to maximize the distance separating the train-ing data into two subsets. Thus, the SVR focuses on find-ing the optimum hyperplane and minimizfind-ing the trainfind-ing error between the input data and the ε-insensitive loss function.
y g x,
2.3. SVR Model
SVR minimizes the overall errors, thus:
* * 1 , , N i i i R w C * , , , Min 1 2 w b T w w
, 1, 2, ,
, 1, 2, ,
1, 2, ,
1, 2, ,
i i i N i N i N i N
(5)
with the constraints
* * 0, 0, T i i T i i i iy w f x b
y w f x b
The first term of Equation (5) is used to regularize weight sizes, penalize large weights and maintain regression func-tion flatness. The second term penalizes training errors of
g x
*
and y by using the ε-insensitive loss function. C is a parameter to trade off these two terms. Training errors above ε are denoted as i whereas training errors below
εare denoted as i (Figure 1(b)).
2.4. Kernel Function
Finally, the SVR function is obtained as (6) in the dual space:
*1
N
i i
i
i,
g x
k x x b
,
(6)
where K x xi j
is called the kernel function, and the value of the kernel equals the inner product of two vec-tors, xi and xj, in the feature space f x
i and f x
j
,respectively; that is, K x x
i, j
f x
i f xj . Thereare several types of kernel function. However, it has been hard to determine the type of kernel function for specific data patterns until now. The most used kernel functions are the Gaussian radial basis functions (RBF) with a width as follows.
:K x xi, j exp 0.5 2 2
i j
x x
Load = LoadOutput + LoadImports LoadExports
(7)
The Gaussian RBF kernel is not only easier to imple-ment, but also capable of nonlinearly mapping the train-ing data into an infinite dimensional space. Thus, it is suit-able for dealing with nonlinear relationship problems. Therefore, the Gaussian RBF kernel function is specified in this paper.
3. LTLF Based on SVR
In Section 2, we set up a forecasting method based on SVR with the Gaussian RBF kernel function. In this sec-tion, we use the historical data from 1995 to 2008 for the learning of the parameters of SVR. SVR is then applied for a five-year load forecasting within China. Finally, sev-eral recommendations are provided on load output, load imports and load exports according to the expected growth of annual GDP of 7.5% mentioned in China’s 11th Five- Year Plan (2006-2010). The data of load output and GDP are found to be identical with the rapid economic growth and the intensive pattern of power consumption in China from 1995, the beginning of the 9th Five-Year Plan (1995- 2000). It is also observed that the growth rates of load output and GDP in 2008 are lower than those at the be-ginning of the Five-Year Plan, which can be taken as a reflection of the global economic recession starting at the end of 2007. Although the trend of load output is similar to that of GDP, there is no parallel relationship among GDP, load imports and load exports. In this paper, the load is calculated by (8). Thus, the relationship between GDP and load is a nonlinear one from 1995 to 2008.
(8)
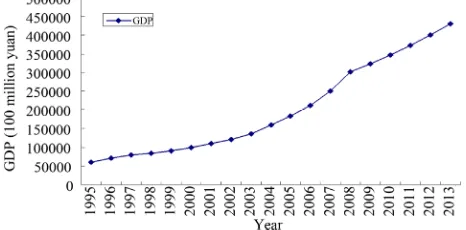
Taking the historical data above as the learning sam-ples, we implement the learning of SVR. In detail, the pa-rameters of Gaussian RBF kernel function used in SVR, ε and σ, are optimized according to the value of the in-dependent variable, GDP, and the value of the in-dependent variables, load output, load imports and load exports, respectively. After the learning of SVR, we perform the load forecasting for China from 2009 to 2013. According to China’s 11th Five-Year Plan, the expected growth rate of GDP from 2006 to 2010 is 7.5%. Thus we use the rate of 7.5% in this paper (Figure 2). Finally, Table 1 shows the numerical results of predicted load output, load imports and load exports for China from 2009 to 2013 using SVR.
3.1. Recommendations
[image:3.595.307.540.604.719.2]In order to show the superiority of the proposed model and the reliability of recommendations according to China’s
Table 1. Load output, load imports and load exports forecasting using SVR.
Year Load Output (100 million kwh)
Load Imports (100 million kwh)
Load Exports (100 million kwh) 2009 37358.88 6.61773 194.2092 2010 42094.51 21.74397 239.6624 2011 49987.23 41.91229 241.0398 2012 57353.77 46.00898 272.7193 2013 64983.4 35.60969 301.644
11th Five-Year Plan (2006-2010), we also apply other methods like linear regression (LR) and back-propagation neural network (BPNN) as comparisons. In China’s 11th Five-Year Plan, the supply of power load is vital to the function of economic activity. Concerning electric power, due to the 3 - 4 years lead time of power infrastructure construction, proper recommendations and active strate- gies for electric power supply should be drawn up. The policy of “electricity supply leads economic growth” has been implemented by the Chinese Government in the cur- rent period of power shortage and should be continued for a long period. That is, China should meet more and more domestic power load demand by itself, especially for the expected economic growth in the recession.
3.1.1. Recommendations on Load Output
In Table 2, the growth rate of load output was more than 10% from 2001 to 2007, falling to 5% in 2008 due to the global economic recession. It will take time for the growth rate to return to a level of 10%. It is obvious that the growth rate in 2009 obtained from LR or BPNN is more than 15%, and that the growth rate will fall and stay at 7% in the remaining years. Conversely, SVR provides a posi- tive growth rate curve of load output, starting at 8% in 2009 and reaching 13% in 2013, coinciding with the ex- pected GDP of China. Thus, it is recommended that China should take actions on the development of the domestic electricity market and increase of the load supply to in- dustry for the expected economic growth. It is also sug- gested that attention should be paid to the diversity of energy supply with preference on renewable energy such as wind and solar power.
3.1.2. Recommendations on Load Imports
[image:4.595.308.540.112.208.2]In Table 3, all methods provide positive curves of load imports. The starting points of the curves obtained from LR and BPNN are higher than the amount of load imports in 2008. However, these are unreliable due to the eco- nomic challenges China is facing currently. Power load imports have always been an international dispute and are sensitive to disruption by international political affairs, geostrategic riffles and even subtle sentimental changes. Up to now the national level of strategic load reserve in
Table 2. The results of forecasting methods for growth rate of load output.
Year Predicted Growth Rate with LR
Predicted Growth Rate with BPNN
Predicted Growth Rate with SVR
2009 0.16 0.17 0.08
2010 0.07 0.08 0.13
2011 0.07 0.06 0.19
2012 0.07 0.08 0.15
2013 0.07 0.07 0.13
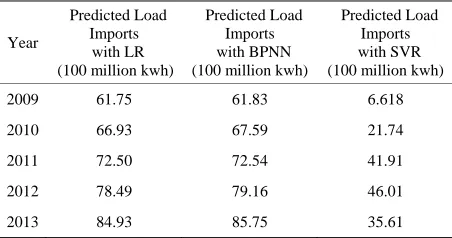
Table 3. The results of forecasting methods for load imports.
Year
Predicted Load Imports
with LR (100 million kwh)
Predicted Load Imports with BPNN (100 million kwh)
Predicted Load Imports with SVR (100 million kwh)
2009 61.75 61.83 6.618
2010 66.93 67.59 21.74
2011 72.50 72.54 41.91
2012 78.49 79.16 46.01
2013 84.93 85.75 35.61
China is yet to be established. Without sufficient pre-action, the Chinese domestic economy will be vulnerable to change of international power load trade. For example, the amount of quarterly load imports from Russia was more than 1.0 (100 million kwh) in 2007. Since the appearance of the global economic recession in 2008, it has declined to 0.2 (100 million kwh). In 2009, it even reached 0 for the 1st quarter. So the estimated load imports based on SVR are more consistent with the situation of load imports of China. Therefore, it is important for China to prepare for the chal- lenge, that is, to achieve the expected GDP by adjusting the industrial output structure and the development of re- newable energy rather than load imports.
3.1.3. Recommendations on Load Exports
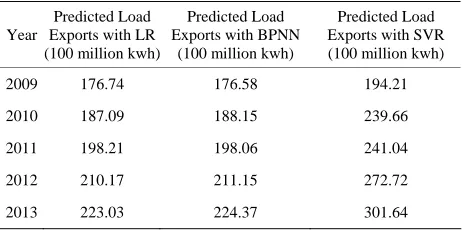
Based on the forecasting results in Table4, it will be a challenge for China to get the expected growth of GDP through increasing load exports. However, it would help the recovery of countries and regions in Asia from eco- nomic recession. For example, the amount of load exports to Hong Kong, Macao and Vietnam all kept rising in 2008, and then dropped a little in the first quarter of 2009. More- over, the curve provided by SVR is above those by LR and BPNN, indicating SVR is more reliable for the ex- pected growth of GDP.
4. Conclusions
[image:4.595.310.536.237.356.2]Table 4. The results of forecasting methods for load exports.
Year
Predicted Load Exports with LR (100 million kwh)
Predicted Load Exports with BPNN
(100 million kwh)
Predicted Load Exports with SVR (100 million kwh) 2009 176.74 176.58 194.21
2010 187.09 188.15 239.66
2011 198.21 198.06 241.04
2012 210.17 211.15 272.72
2013 223.03 224.37 301.64
In developing countries, where demand for power is in- creasing more dramatically, LTLF is even more import- ant. Thus, it is necessary to find a nonlinear relationship between load and economic factors like GDP, when im- plementing LTLF.
In this paper, we propose SVR for LTLF within China and provide recommendations on future load output, load imports and load exports. Using mapping to transfer the nonlinear relationship in the original lower dimensional input space into a higher dimensional feature space, SVR can identify the relationship between load and GDP. SVR is also suitable for small-sample cases like LTLF. We first took the historical annual data of load output, load im- ports, load exports and GDP from 1995 to 2008 as learn- ing samples to perform the learning of SVR. We then applied SVR for LTLF within China from 2009 to 2013. According to the expected GDP in China’s 11th Five-Year Plan (2006-2010), we assessed the performance of SVR in comparison with LR and BPNN. We found that the recommendations based on the forecasting results obtained from SVR are more reliable and feasible for the current role China plays in international trade in the global eco- nomic recession.
It would be interesting to see long load forecasting for more types of load and of factors affecting load within China. Employing more than one economic factor to make a comprehensive study on load forecasting with other fac-tors according to the characteristics of economic growth of China would also be of value. In our current work, we are investigating the relationship between load and eco-nomic factors using soft computing methods or models like SVR. The benefit of the application of soft comput-ing methods is that complicated and indiscernible relation-ships can be modified with high accuracy.
5. Acknowledgements
The numerical results with support vector regression and back-propagation neural network were obtained using LS-SVMlab Toolbox 1.5 and Neural Network Toolbox of MATLAB 6.5, respectively. The language of this pa-per is edited by International Science Editing.
REFERENCES
[1] L. Ghods, M. Kalantar and Ieee, “Methods for Long- Term Electric Load Demand Forecasting; A Comprehen-sive Investigation,” IEEE International Conference on
Industrial Technology, Chengdu, 2008, pp. 855-858. [2] H. M. Al-Hamadi and S. A. Soliman, “One Year Long-
Term Electric Load Forecasting Based on Multiple Re-gression Models and Kalman Filtering Algorithm,”
En-gineering Intelligent Systems for Electrical EnEn-gineering and Communications, Vol. 14, 2006, pp. 79-88.
[3] H. M. Al-Hamadi and S. A. Soliman, “Long-Term/Mid- Term Electric Load Forecasting Based on Short-Term Correlation and Annual Growth,” Electric Power Systems
Research, Vol. 74, No. 3, 2005, pp. 353-361. doi:10.1016/j.epsr.2004.10.015
[4] L. D. Duan, D. X. Niu and Z. H. Gu, “Long and Medium Term Power Load Forecasting with Multi-Level Recur-sive Regression Analysis,” 2nd International Symposium on Intelligent Information Technology Application, Shang- hai, 20-22 December 2008, pp. 514-518.
doi:10.1109/IITA.2008.397
[5] O. Carpinteiro, I. Lima, R. C. Leme, A. de Souza, E. M. Moreira and C. Pinheiro, “A Hierarchical Neural Model with Time Windows in Long-Term Electrical Load Fore-casting,” Neural Computing & Applications, Vol. 16, No. 4-5, 2007, pp. 465-470. doi:10.1007/s00521-006-0072-8 [6] O. Carpinteiro, R. C. Leme, A. de Souza, C. Pinheiro and
E. M. Moreira, “Long-Term Load Forecasting via a Hier-archical Neural Model with Time Integrators,” Electric Power Systems Research, Vol. 77, No. 3-4, 2007, pp. 371-378. doi:10.1016/j.epsr.2006.03.014
[7] O. Carpinteiro, I. Lima, R. C. Leme, A. de Souza, E. M. Moreira and C. Pinheiro, “A Hybrid Neural Model in Long-Term Electrical Load Forecasting,” Artificial
Neu-ral Networks—ICANN 2006, Vol. 4132, 2006, pp. 717- 725.
[8] A. A. Abou El-Ela, A. A. El-Zeftawy, S. M. Allam and G. Atta, “Long-Term Load Forecasting and Economical Op-eration of Wind Farms for Egyptian Electrical Network,”
Electric Power Systems Research, Vol. 79, No. 7, 2009, pp. 1032-1037. doi:10.1016/j.epsr.2009.01.003
[9] O. A. S. Carpinteiro, I. Lima, R. C. Leme, A. C. Z. de Souza, E. M. Moreira and C. A. M. Pinheiro, “A Hybrid Neural Model in Long-Term Electrical Load Forecast-ing,” 16th International Conference on Artificial Neural
Networks (ICANN 2006), Athens, 2006, pp. 717-725. [10] N. X. Jia, R. Yokoyama, Y. C. Zhou and Z. Y. Gao, “A
Flexible Long-Term Load Forecasting Approach Based on New Dynamic Simulation Theory—GSIM,”
Interna-tional Journal of Electrical Power & Energy Systems, Vol. 23, No. 7, 2001, pp. 549-556.
doi:10.1016/S0142-0615(00)00078-8
[11] D. Niu, J. Li, J. Li and D. Liu, “Middle-Long Power Load Forecasting Based on Particle Swarm Optimization,”
Computers and Mathematics with Applications, Vol. 57, No. 11-12, 2009, pp. 1883-1889.
doi:10.1016/j.camwa.2008.10.044
Clustering Neural Network Approach for Middle and Long Term Load Forecasting,” Grey Systems and Intelli-gent Services, 2007, pp. 963-967.
[13] M. M. Dalvand, S. B. Z. Azami, H. Tarimoradi and Ieee, “Long-Term Load Forecasting of Iranian Power Grid Us-ing Fuzzy and Artificial Neural Networks,” 43rd
Interna-tional-Universities-Power-Engineering Conference, Pa-dova, 2008, pp. 559-562.
[14] D. X. Niu, J. R. Jia, J. L. Lv, Y. Zhang and S. O. C. Ieee Computer, “Study on Intelligent Optimization Model Based on Grey Relational Grade in Long-Medium Term Power Load Rolling Forecasting,” 2nd International Conference on Risk Management and Engineering Man-agement, Beijing, 2008, pp. 227-232.
[15] S. Yingling, Y. Hongsong, D. Yawei and P. Nansheng, “Research on Long Term Load Forecasting Based on Im-proved Genetic Neural Network,” Computational Intelli-gence and Industrial Application, 2008, pp. 80-84. [16] L. M. Ao, Y. C. Wang and Q. Zhang, “Application of a
Hybrid Model on Short-Term Load Forecasting Based on Support Vector Machines (SVM),” New Zealand Journal of Agricultural Research, Vol. 50, No. 5, 2007, pp. 567- 572. doi:10.1080/00288230709510324
[17] W. C. Hong, “Chaotic Particle Swarm Optimization Al-gorithm in a Support Vector Regression Electric Load Forecasting Model,” Energy Conversion and
Manage-ment, Vol. 50, No. 1, 2009, pp. 105-117. doi:10.1016/j.enconman.2008.08.031
[18] W. C. Hong, “Electric Load Forecasting by Support Vec-tor Model,” Applied Mathematical Modelling, Vol. 33, No. 5, 2009, pp. 2444-2454.
doi:10.1016/j.apm.2008.07.010
[19] J. Shen, Y. Syau and E. S. Lee, “Support Vector Fuzzy Adaptive Network in Regression Analysis,” Computers &
Mathematics with Applications, Vol. 54, No. 11-12, 2007, pp. 1353-1366. doi:10.1016/j.camwa.2007.03.006 [20] V. Vapnik, “The Nature of Statistical Learning Theory,”