http://wrap.warwick.ac.uk
Original citation:
Lin, Xufeng, Li, Chang-Tsun and Hu, Yongjian (2013) Exposing image forgery through
detecting contrast enhancement. In: ICIP 2013, Melbourne, Australia, 15-18 Sep 2013.
Published in: Proceedings of 2013 20th IEEE International Conference on Image
Processing pp. 4467-4471.
http://dx.doi.org/10.1109/ICIP.2013.6738920
Permanent WRAP url:
http://wrap.warwick.ac.uk/65205
Copyright and reuse:
The Warwick Research Archive Portal (WRAP) makes this work by researchers of the
University of Warwick available open access under the following conditions. Copyright ©
and all moral rights to the version of the paper presented here belong to the individual
author(s) and/or other copyright owners. To the extent reasonable and practicable the
material made available in WRAP has been checked for eligibility before being made
available.
Copies of full items can be used for personal research or study, educational, or not-for
profit purposes without prior permission or charge. Provided that the authors, title and
full bibliographic details are credited, a hyperlink and/or URL is given for the original
metadata page and the content is not changed in any way.
Publisher’s statement:
“© 2013 IEEE. Personal use of this material is permitted. Permission from IEEE must be
obtained for all other uses, in any current or future media, including reprinting
/republishing this material for advertising or promotional purposes, creating new
collective works, for resale or redistribution to servers or lists, or reuse of any
copyrighted component of this work in other works.”
A note on versions:
The version presented here may differ from the published version or, version of record, if
you wish to cite this item you are advised to consult the publisher’s version. Please see
the ‘permanent WRAP url’ above for details on accessing the published version and note
that access may require a subscription.
EXPOSING IMAGE FORGERY THROUGH THE DETECTION OF CONTRAST
ENHANCEMENT
Xufeng Lin
1, Chang-Tsun Li
1and Yongjian Hu
1,21
Department of Computer Science, University of Warwick, UK
2South China University of Technology, Guangzhou, China
ABSTRACT
In this paper, a novel forensic method of exposing cut-and-paste im-age forgery through detecting contrast enhancement is proposed. We reveal the channel correlation introduced by color image inter-polation, and show how a linear or nonlinear contrast enhancemen-t can disenhancemen-turb enhancemen-this naenhancemen-tural inenhancemen-ter-channel dependency. We enhancemen-then con-struct a metric to measure these correlations, which are useful in distinguishing the original and contrast enhanced images. The ef-fectiveness of the proposed algorithm is experimentally validated on natural color images captured by commercial cameras. Finally, its robustness against some anti-forensic algorithms is also discussed.
Index Terms— Digital forensics, contrast enhancement, demo-saicking, inter-channel correlation
1. INTRODUCTION
In an image subjected to the typical cut-and-paste forgery, the con-trast between the background and the pasted region is not usually consistent with that of the original image due to different lighting conditions. Consequently, contrast enhancement is widely used by the attacker to avoid leaving obvious visual clues after forging an image. However, a number of contrast enhancement operations are equivalent to pixel value mappings, which introduce some statisti-cal traces. Therefore, we can expose cut-and-paste image forgery by detecting contrast enhancement. A blind method is proposed in [1] to detect globally and locally applied contrast enhancement op-erations, which introduce sudden peaks and zeros in the histogram and therefore increase high-frequency components in the histogram spectrum. It achieves good results by comparing the high-frequency measurement of histogram spectrum with a threshold. But it is not convenient to use in practice as there are some parameters to be de-termined. What is more is that some corresponding anti-forensic algorithms have been put forward. In this work, we propose a novel contrast enhancement detection approach using inter-channel simi-larities of high-frequency components. In comparison with the algo-rithm described in [1], the performance of our method is presented based on experimental results under both forensic and anti-forensic scenarios.
The remainder of this paper is organized as follows. Section 2 briefly reviews the method in [1]. Section 3 describes the proposed detection scheme in details. Experimental results and conclusions are provided in Section 4 and Section 5, respectively.
2. HISTOGRAM-BASED DETECTION OF CONTRAST ENHANCEMENT
Due to observational noise [2], sampling effects, complex lighting environments and CFA interpolation, image histograms do not
con-tain sudden zeros or impulsive peaks. So the variation of the his-togram of an unaltered image is low, while contrast enhancement manipulation will expand or squeeze the original histogram and lead to sudden peaks and gaps in the histogram, which causes the increase of high-frequency energy in the histogram spectrum. Based on this observation, Stamm and Liu proposed a general contrast enhance-ment detection algorithm [1] as follows.
(1) Obtain the image’s histogramh(x)and calculate the modi-fied histogramg(x)as follows,
g(x) =h(x)p(x) (1)
wherep(x)is a pinch off function, whose role is to eliminate the low end or high end saturated effect in images.
(2) Transformg(x)into the discrete Fourier frequency domain,
G(k), and calculate the high-frequency measurementF according to
F = 1
N
∑
k
|β(k)G(k)|, k= 0,1, ...,255 (2)
whereNis the total number of pixels, andβ(k)is the cutoff function deemphasizing the low frequency components ofG(k):
β(k) =
{
1, T ≤k≤255−T
0,else (3)
whereTcorresponds to a desired cutoff frequency.
(3) Finally, F is compared with a threshold τ to determine whether contrast enhancement has been applied.
Local contrast enhancement can be detected through applying the above procedures block by block. But there are some parameters need to be determined by users, such as the pinch off function and the cutoff frequencyT. It is not convenient in practice as the optimal parameters may vary with different forms of contrast enhancements. Most importantly, as the histogram of image can be easily tampered, this kind of histogram-based forensic methods will fail if the traces left on the image histogram have been concealed by attackers. For example, Cao et al. remove the peak and gap artifacts of histogram introduced by contrast enhancement using local random dithering [3], which essentially adds Gaussian noise with appropriate variance onto the contrast enhanced image. In [4], Barni et al. also propose a universal anti-forensic technique against histogram-based contrast enhancement detector. The histogramhyof an enhanced image is
modified according to the most similar histogramhxfrom a
3. PROPOSED ALGORITHM
3.1. Motivation
In the imaging process of most commercial digital cameras, a col-or filter array (CFA) is placed befcol-ore the senscol-or to capture one of the primary colors for each pixel while the other color components are interpolated with a specific demosaicking algorithm. Consider a color image composed of R, G and B channels. As human eyes are more sensitive to the green components of visible light, most CFAs tend to sample the G channel at a higher rate than R and B chan-nels. Given any natural image sampled on the Bayer CFA, one of the constraints imposed by most demosaicking methods is that high frequencies between G and R, B channels are largely identical [5, 6]. This is effective and important because after sampling on the CFA, the G channel has twice the number of samples compared to R or B and is hence relatively free of aliasing. The consequence produced by the constraint can be represented as
Rh≈Gh≈Bh (4)
whereRh, Ghand Bhdenote the high-frequency bands of
inter-polated color planeR,GandB. Equation (4) can be interpreted as thatRandB“copies” the high-frequency components ofG[7]. However, this inter-channel similarity may be altered by some image manipulations, one of which is contrast enhancement. The reasons will be investigated in the following sub-section.
3.2. Proposed algorithm
In this sub-section, we will first show how the contrast enhancement can disturb the inter-channel similarities of high-frequency compo-nents, and then propose our detection scheme.
To explore what will happen to the high-frequency components of an image if it is enhanced, we draw the 3D scatter plots of the average high-frequency wavelet coefficients of 100 original images and the corresponding enhanced images in Fig. 1(a) and 1(b). The coordinates of each point denote the values of R, G, and B wavelet coefficients in the diagonal subband, taken at the same pixel loca-tion. In general, the points of the original images are compactly clustered along the vector(1,1,1), which implies the strong corre-lation and approximate equality of the wavelet coefficients [8]. For the enhanced images, however, the points deviate from the line sug-gesting the inter-channel correlation has been reduced. Next, the reasons for why a linear or nonlinear contrast enhancement can dis-turb the inter-channel similarity are explained as follows.
(1) Linear contrast enhancement
Consider an 8-bit image as a signalx(n), and 0 ≤ x(n) ≤ 255. After applying Discrete Wavelet Transform (DWT) tox(n), the wavelet coefficients at levelj+ 1can be written as [9]:
dj+1(k) =
p−1
∑
m=0
h(m)xj(2k−m) (5)
whereh(m)is the coefficients of a filter, depending on the chosen wavelet function, andpis the length ofh(m).xj(n)
is the approx-imation coefficients at levelj, andx0(n) =x(n). Ifxj(n)is mul-tiplied by a linear scaling factorw,xj(n)can be divided into two sets:
{
X1={xj(n)|w∗xj(n)≤255}
X2={xj(n)|w∗xj(n)>255}
(6)
Then the wavelet coefficients become:
e
dj+1(k) =w ∑
xj∈X1
h(m)xj(2k−m)
+w ∑
xj∈X
2
h(m)xj(2k−m) (7)
Ifw ≤1, thenX2 =∅, anddej+1(k) =w∗dj+1(k), which
means all coefficients are multiplied by the same factor. Therefore, the inter-channel similarity still holds if we separately enhanceR,
GandBchannel. However, it rarely happens in the cut-and-paste forgery scenario as it will result in chromatic aberration. The most common situation is that the RGB image is converted into YUV col-or space, and contrast enhancement will be only applied in Y chan-nel. In this case, the inter-channel similarity will be disturbed by the mapping from YUV back to RGB. Ifw >1, thenX2̸=∅, and all
data inX2will be truncated to 255, so the approximate equality of
high-frequency components will be disturbed in this case. (2) Nonlinear contrast enhancement
As any signal can be decomposed into cosine waves, for the sake of simplicity, we take two simple 1D signals composed of a sum of two zero-phase cosinusoids for example:
{
x(n) =acos(ω1n) +ccos(ω2n)
y(n) =bcos(ω1n) +ccos(ω2n)
(8)
whereω1 andω2 represent the low-frequency and high-frequency,
respectively. Therefore, x(n) and y(n) have the same high-frequency component but different low-high-frequency components. If they both undergo the same nonlinear transformation functionT(x), then we can rewriteT(x)in terms of its Taylor series expansion:
T(x) = T(x0) +T′(x0)(x−x0) +
T′′(x0)(x−x0)2
2
+
∞
∑
i=3
T(i)(x0)(x−x0)i
i! (9)
By only considering the first three terms of the right-hand side of Equation (9), we have ax2(n)and ay2(n)term for the nonlinear transformations ofx(n)andy(n), respectively:
x2(n) = a
2
2 cos(2ω1n) +
c2
2 cos(2ω2n) + accos((ω1−ω2)n) +
a2+c2
2 (10)
+ accos((ω1+ω2)n)
y2(n) = b
2
2 cos(2ω1n) +
c2
2 cos(2ω2n) + bccos((ω1−ω2)n) +
b2+c2
2 (11)
+ bccos((ω1+ω2)n)
Notice the amplitudes of new frequencies2ω1,2ω2,ω1−ω2
andω1+ω2are correlated to the amplitudes of the original
frequen-cies, which means the equalities of high-frequency components may be disturbed by the inequalities of low-frequency components. For example, the amplitudes of the potential high-frequencyω1 +ω2
consider a simplified form of a signal. However, this analysis can be generalized to more complex signals. Actually, the increasing-ly complex signals will aggravate the interference between different frequency components, and finally lead to the destruction of inter-channel high-frequency components.
Based on the above analysis, we propose a metricSto measure the similarity between the high-frequency components of different color channels. If the 2D wavelet coefficients of color channelcin the diagonal subband at leveljis denoted byDjc(m, n), the
mea-surement of inter-channel similarity of high-frequency components can be defined as:
S= 1
M N
M∑−1
m=0
N∑−1
n=0
Dc11(m, n)−D
1
c2(m, n) (12)
wherec1, c2 ∈ {R, G, B}, c1 ̸= c2. M andN is the width and
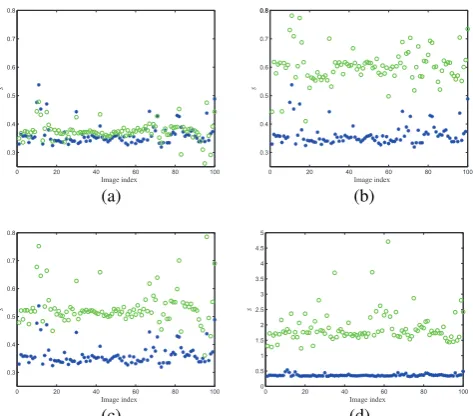
height of the diagonal subband. A value ofS greater than the de-cision thresholdηsignifies the detection of contrast enhancement. Similar to [1], we applied block-wise detection for local contrast en-hancement. Conceivably, theSof unaltered image is closer to zero than that of altered image. S extracted from linear and nonlinear contrast enhanced images are shown in Fig. 2(a)-(d), which confor-m to our analysis above. In Fig. 2(b) and 2(c), it is straightforward to show that aside from exceptional cases, the original and enhanced images can be distinguished clearly. In Fig. (d), taking histogram equalization as a nonlinear contrast enhancement example, all the unaltered and altered images can be classified perfectly using the proposed detection scheme.
(a) (b)
Fig. 1. Scatter plots of wavelet coefficients in the diagonal subband
for (a) the original images and (b) the enhanced images.
4. EXPERIMENTS
4.1. Experimental setup
To evaluate the performance of the proposed method, 100 uncom-pressed color images sized1600×1200captured by commercial cameras are used in the experiment. As in the previous work in [1, 3, 4], these images were enhanced by power law transformation (γcorrection):
T(x) = [255( x 255)
γ
] (13)
where[·]is a rounding operation, andγis randomly chosen from the set{0.5;0.8;1.2;1.5;1.8;2.0}. These enhanced images were com-bined with the unaltered images to create a testing database of 700 color images. To test the performance of the proposed method on local contrast enhancement, we simply cropped blocks of differen-t sizes from differen-the upper-lefdifferen-t corner of differen-the original andγ correction enhanced images. Each block was then classified as enhanced or unaltered by our proposed detection scheme using a variety of dif-ferent thresholds to get a series of receiver operating characteristic (ROC) curves. Although we gained good results for different forms
0 20 40 60 80 100
0.3 0.4 0.5 0.6 0.7 0.8
S
Image index (a)
0 20 40 60 80 100
0.3 0.4 0.5 0.6 0.7 0.8 0.8
S
Image index (b)
0 20 40 60 80 100
0.3 0.4 0.5 0.6 0.7 0.8
S
Image index (c)
0 20 40 60 80 100
0 0.5 1 1.5 2 2.5 3 3.5 4 4.5 5
S
Image index (d)
Fig. 2. Scatter plots ofSfor original (blue asterisks) and enhanced
(green circles) images. (a) Linear,w = 0.6(R, G and B channels separated), (b) linear,w= 0.6, (c) linear,w= 1.2, (d) Histogram equalization.
of contrast enhancements such as linear enhancement and histogram equalization, the results will be shown only forγcorrection. Notice that we did not enhance each color channel separately so as to avoid chromatic aberration. Instead, we converted RGB images into YUV color space and only applied contrast enhancement in Y channel as most contrast enhancement schemes do. Finally, the enhanced im-age will be converted back to RGB space. To provide a practical validation, we will show the detection results of a real cut-and-paste forgery.
4.2. Performance evaluation
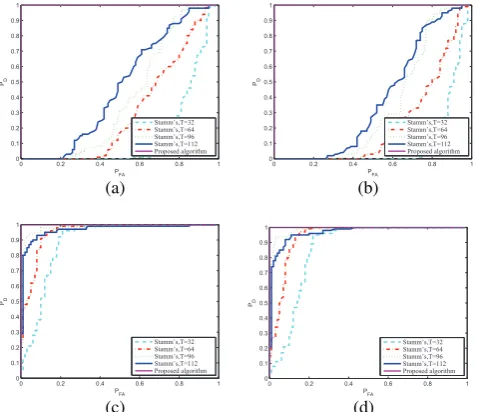
The series of ROC curves forc1 =Gandc2 =Rin (12) are
dis-played in Fig. 3(a)-(d). PDandPF Amarked in the figures denote
the true positive rates and false positive rates, respectively. ηis in-creased by 0.001 from 0 to 1.The results shown in Fig. 3 indicate that local contrast enhancement can be reliably detected even for testing blocks sized16×16pixels. With aPF Aof less than 5%, our method
achieves aPDof at least 90% using16×16pixels blocks for power
law transformation and aPDof around 95% using128×128pixels
blocks. One can see that the proposed method achieves better results than Stamm’s algorithm with different cutoff frequenciesT in case of small blocks sized16×16pixels and comparable performance for large blocks sized128×128pixels. Because for small blocks, the statistical significance of the calculated histogram would be reduced, so it is difficult to perform reliable contrast enhancement detection for small blocks sized below50×50pixels using histogram-based methods like [1]. It makes sense that larger blocks are more likely to contain sufficient high-frequency evidence, but the performance of the proposed method decreases very little with the diminishing block sizes, implying theSextracted from small blocks, like16×16 pixels, are feasible for the classification task.
[image:4.595.318.555.74.282.2] [image:4.595.58.293.375.463.2]on each block for evidence of contrast enhancement, settingη = 0.67. In Fig. 4(c), the blocks detected as contrast enhanced are highlighted in red square. Although the proposed algorithm fails on some all-white and all-black blocks as they do not contain enough high-frequency content to provide trustworthy evidence, most of the enhanced blocks are reliably detected.
4.3. Performance under anti-forensic scenario
To investigate the performance of the proposed algorithm under anti-forensic scenario, two anti-anti-forensic schemes proposed in [3] and [4] are used.
For the method in [3], we added Gaussian noiseN(0, σ2) to
each channel of the contrast enhanced image. Detection results for image blocks sized128×128pixels are illustrated in Fig. 5(a)-(b). As expected, the proposed algorithm has good robustness a-gainst Gaussian noise. Because the additional noise can provide ex-tra high-frequency evidence and therefore increase our confidence in the inter-channel similarities of high-frequency components, making it easier to detect contrast enhancement in case of additive noise.
0 0.2 0.4 0.6 0.8 1
0 0.1 0.2 0.3 0.4 0.5 0.6 0.7 0.8 0.9 1 P FA PD Stamm’s,T=32 Stamm’s,T=64 Stamm’s,T=96 Stamm’s,T=112 Proposed algorithm (a)
0 0.2 0.4 0.6 0.8 1
0 0.1 0.2 0.3 0.4 0.5 0.6 0.7 0.8 0.9 1 P FA PD Stamm’s,T=32 Stamm’s,T=64 Stamm’s,T=96 Stamm’s,T=112 Proposed algorithm (b)
0 0.2 0.4 0.6 0.8 1
0 0.1 0.2 0.3 0.4 0.5 0.6 0.7 0.8 0.9 1 P FA PD Stamm’s,T=32 Stamm’s,T=64 Stamm’s,T=96 Stamm’s,T=112
Proposed algorithm
(c)
0 0.2 0.4 0.6 0.8 1
0 0.1 0.2 0.3 0.4 0.5 0.6 0.7 0.8 0.9 1 P FA PD Stamm’s,T=32 Stamm’s,T=64 Stamm’s,T=96 Stamm’s,T=112
Proposed algorithm
(d)
Fig. 3. Detection ROC curves for images altered byγcorrection. (a)
γ= 0.8, blocksize=128×128, (b)γ= 0.8, blocksize=16×16, (c)
γ= 1.5, blocksize=128×128, (d)γ= 1.5, blocksize=16×16.
(a) (b) (c)
Fig. 4. Cut-and-paste forgery detection example using64×64pixels
blocks. (a) The original image from which an object is cut, (b) the original image onto which the cut object is pasted, (c) the detection result.
Next, for the remapping scheme described in [4], it modifies the histogramhyof an enhanced image according to the most similar
histogramhx from a reference histogram database by pixel
remap-ping. It is worth mentioning that instead of applying remapping in the enhanced Y channel, we remapped R, G and B channels of
the enhanced image for the reason that the conversion from YU-V to RGB color space is essentially a per-pixel mapping, which will again introduce artifacts into histogram and neutralize the effect of anti-forensic algorithm. The comparison between the proposed method and Stamm’s in [1] is given in Fig. 5(c)-(d). As we can see, remapped images can still be detected by Stamm’s algorithm when the block size is128×128pixels, although the histogram of anti-forensic images is smoother than that of the enhanced images. But our algorithm still obtains better result. Actually, it achieves almost perfect result since the pixel remapping scheme is highly nonlinear, which will certainly disturb the inter-channel similarity as demon-strated in Section 3.2.
0 0.2 0.4 0.6 0.8 1
0 0.1 0.2 0.3 0.4 0.5 0.6 0.7 0.8 0.9 1 P FA PD Stamm’s,T=32 Stamm’s,T=64 Stamm’s,T=96 Stamm’s,T=112
Proposed algorithm
(a)
0 0.2 0.4 0.6 0.8 1
0 0.1 0.2 0.3 0.4 0.5 0.6 0.7 0.8 0.9 1 P FA PD Stamm’s,T=32 Stamm’s,T=64 Stamm’s,T=96 Stamm’s,T=112
Proposed algorithm
(b)
0 0.2 0.4 0.6 0.8 1
0 0.1 0.2 0.3 0.4 0.5 0.6 0.7 0.8 0.9 1 P FA PD Stamm’s,T=32 Stamm’s,T=64 Stamm’s,T=96 Stamm’s,T=112
Proposed algorithm
(c)
0 0.2 0.4 0.6 0.8 1
0 0.1 0.2 0.3 0.4 0.5 0.6 0.7 0.8 0.9 1 P FA PD Stamm’s,T=32 Stamm’s,T=64 Stamm’s,T=96 Stamm’s,T=112
Proposed algorithm
(d)
Fig. 5. Detection ROC curves under anti-forensic scenarios. (a)
γ = 1.2, σ2 = 0.01, (b) γ = 1.2, σ2 = 0.05, (c) γ = 0.5,
blocksize=128×128, (d)γ= 1.2, blocksize=128×128.
5. CONCLUSIONS
In this paper, we present a novel forensic method to expose cut-and-paste image forgery by detecting contrast enhancement in color im-ages. Compared with the algorithm in [1], our proposed method is easier to implement and use, good results are still gained for small blocks sized16×16pixels in terms of ROC curves. Besides, it has good robustness against some state-of-the-art anti-forensic schemes. When the detection block size is large enough, the traces left in the histogram can provide adequately reliable evidence, while the inter-channel similarity metricS become more convincing when block size is reduced to a certain degree. Therefore, a further enhancement would be a potential fusion of the proposed algorithm and the find-ings of [1]. However, both our proposed algorithm and that described in [1] suffer from poor robustness against JPEG compression, so dis-covering specific effects of JPEG compression on the histogram and choosing those wavelet coefficients less affected by image compres-sion would be the main focus of our future work.
6. ACKNOWLEDGEMENT
[image:5.595.316.555.205.411.2] [image:5.595.56.294.287.497.2] [image:5.595.57.295.549.623.2]7. REFERENCES
[1] M.C. Stamm and K.J.R. Liu, “Forensic detection of image ma-nipulation using statistical intrinsic fingerprints,” IEEE Trans-actions on Information Forensics and Security, vol. 5, no. 3, pp. 492–506, Sept. 2010.
[2] G.E. Healey and R. Kondepudy, “Radiometric ccd camera cal-ibration and noise estimation,” IEEE Transactions on Pattern Analysis and Machine Intelligence, vol. 16, no. 3, pp. 267–276, 1994.
[3] G. Cao, Y. Zhao, R. Ni, and H. Tian, “Anti-forensics of con-trast enhancement in digital images,” inProceedings of the 12th ACM Workshop on Multimedia and Security, Roma, Italy, 2010, MM&Sec’10, pp. 25–34.
[4] M. Barni, M. Fontani, and B. Tondi, “A universal technique to hide traces of histogram-based image manipulations,” in Pro-ceedings of the 14th ACM Workshop on Multimedia and Securi-ty, Coventry, UK, 2012, MM&Sec’12, pp. 97–104.
[5] I. Pekkucuksen and Y. Altunbasak, “Edge strength filter based color filter array interpolation,” IEEE Transactions on Image Processing, vol. 21, no. 1, pp. 393 –397, Jan. 2012.
[6] B.K. Gunturk, J. Glotzbach, Y. Altunbasak, R.W. Schafer, and R.M. Mersereau, “Demosaicking: color filter array interpola-tion,” IEEE Signal Processing Magazine, vol. 22, no. 1, pp. 44–54, Jan. 2005.
[7] N.X. Lian, L. Chang, Y.P. Tan, and V. Zagorodnov, “Adaptive filtering for color filter array demosaicking,”IEEE Transactions on Image Processing, vol. 16, no. 10, pp. 2515–2525, Oct. 2007.
[8] N.X. Lian, V. Zagorodnov, and Y.P. Tan, “Edge-preserving im-age denoising via optimal color space projection,”IEEE Trans-actions on Image Processing, vol. 15, no. 9, pp. 2575–2587, Sept. 2006.