Munich Personal RePEc Archive
Retail Sector and Economic Development
Ngotran, Duong and Ngo, Tien
State University of New York, University at Albany, US, Banking
Academy, Vietnam
July 2013
Online at
https://mpra.ub.uni-muenchen.de/61590/
Retail Sector and Economic Development
∗
Duong Ngotran
†SUNY Albany, US
Tien Ngo
‡Banking Academy, Vietnam
Abstract
We build a model for emerging economies where households could search goods through two
retail platforms: the legal organized (supermarket) and the informal unorganized (mom-and-pop
store). We highlight the role of the retail sector as a special two-sided platform in goods market.
A positive shock on the productivity of supermarket pulls both consumers (demand) and firms
(supply) to make transactions there. This effect is amplified through the interaction between
demand and supply, motivating manufacturing firms to become formal to supply goods through
this channel. We do the quantitative exercise for the Indian economy; a 1 percent increase in
the productivity of organized retailers leads to an increase in the aggregate productivity of 0.3
percent, 80 percent of which is contributed indirectly by the shift in the manufacturing sector.
Keywords: Retail sector; Platform; Manufacturing sector; Informal firms; India; Tax
∗We wishes to thank Adrian Master, Betty Daniel and John Jones for helpful comments and discussions. We
1
Introduction
As one of the sectors with the largest employment, the retail sector has a special role in the
econ-omy, playing as the platform to match demand and supply in goods market. This functionality,
which is often ignored in models with frictionless goods market, rarely attracts the economists’
attention. The lack of interest is partly originated from the fact that the structures of the retail
industry in developed countries are stable and well organized, having few implications for the
structure of the supply side.
This is not the case with developing countries. The retail sector in developing countries has
two distinctive retail platforms: the legal organized retailing (big boxes, supermarkets) and the
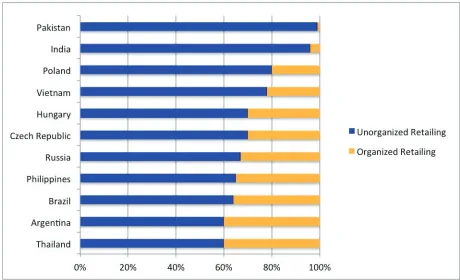
informal unorganized retailing (mom and pop stores, street vendors); where the latter is usually
a dominant force in the market (Figure 1). There is an important link between the informal
retail platform and the informality in the the manufacturing sector as informal firms could only
supply goods to consumers through this platform. Therefore, this paper shows that an increase
in the productivity of the organized retailing does not end at itself, but has a large transmission
mechanism to the manufacturing sector due to the platform effect. This makes the role of the
retail sector in developing countries much more important than the traditional view, which only
highlights the big employment size of this sector.
This paper builds a dynamic general equilibrium model with directed search to clarify the
link between the retail sector, the manufacturing sector, the government budget and the
ag-gregate productivity in developing countries. The most significant result shows that the
de-velopment of the organized retail sector has a huge impact on the government budget and the
aggregate productivity, mainly through giving the incentives for informal firms to become
for-mal in the manufacturing sector. The mechanism comes from two channels: the platform effect
and the tax effect.
The platform effect happens when both demand and supply respond to the change in the
effi-ciency of the organized retailing. The lower retailing cost of supermarkets makes them the more
attractive platforms as compared to mom-and-pop stores, inducing firms to become formal to
supply goods there. As households search goods in a place with cheap prices and many brands,
Figure 1: Retail sector in emerging economies 2006 (Data fromSharma(2011))
than before. Because firms want to use a platform where they can approach most consumers,
the change in demand, in turn, has a feedback effect on the firms’ decision, and therefore the
supply side. The interaction between demand and supply could amplify the platform effect.
When more transactions take place in supermarkets, government’s sales tax revenue improves,
triggering the tax effect.
Governments in developing countries often lose a big share of sales tax when transactions
take place in the informal platform (seeInternational Tax Compact (2010)).The shift of
trans-actions to the organized platform improves the government budget, allowing the government to
cut the tax rate on formal firms. The reduction in the tax distortion makes the firm’s option of
becoming informal less attractive. When there is a large number of firms become formal, the
burden of tax on each formal firm will decline substantially.
Both the platform effect and the tax effect shift the paradigm of the economy to the formal
side, increasing the efficiency in the resource allocation process. Informal firms, although gain
Therefore, the increase in the efficiency of the organized retailing not only affects the
produc-tivity of the retail sector itself but also raises the producproduc-tivity of the manufacturing sector and
the aggregate productivity of the economy.
We also calibrate model for the Indian economy, where the retail sector has been the hottest
topic in the policy reform agenda for recent years. Before December 2012, the Indian
govern-ment forbade all foreign groups from any ownership in supermarkets, convenience stores or any
retail outlets. We find that, if India successfully reforms the retail sector, increasing the market
share of the organized retailers from 8 percent (2012) to the level of China 20 percent, then its
outputs could increase by 0.82 percent. That effect is extremely huge if we consider the number
of workers in the organized retail sector itself only accounts 1 percent of the total labor force
in India. The reason for the strong response of the economy lies in the link between the retail
sector and the manufacturing sector. On average, a 1 percent increase in the productivity of
the organized retailers could result in 0.3 percent increase in the aggregate productivity of the
economy, 80 percent of which is contributed indirectly by the shift in the manufacturing sector.
There are two key contributions in our paper. First, we highlight the role of the retail sector
as a special two-sided platform in the economy. In the existence of frictions in goods market, the
productivity of supermarkets has a huge impact on the manufacturing firms’ choice of becoming
formal. In models without frictions in goods market, the supermarkets’ productivity only shifts
the supply side where more firms want to become formal to enjoy the lower retailing cost. In
our model, both demand and supply respond to the change in the supermarkets’ productivity.
Moreover, this effect is amplified by the interaction between demand and supply. Second, by
calibrating our model for the Indian economy, we raise a different view on the debate on Indian
retail reforms. The previous quantitative exercises highly underestimate the role of the retail
sector as they ignore its feedback effect on the manufacturing sector and the government
bud-get.
Our competitive goods search model is built based onBai, Rios-Rull and Storesletten(2011)
(here after BRS), where they give insight about the role of demand in business cycles by
incor-porating Moen (1997)’s directed search into DSGE framework. Matha and Pierrard (2011),
in goods market to investigate business cycles. Our model is more about the persistence change
in total factor productivity (TFP), in this sense it is related toLagos(2006), though Lagos’ paper
is about the labor market.
Our paper is also related to the literature about the retail sector in developing countries.
There are two different views explaining why the unorganized retailing is a dominant force in
the market. Lewis(2004) considers the policy distortion as the main cause. The burden of tax
on the organized retailers makes them less competitive than the informal retailers. On the other
side,Lagakos(2009) gives insight that developing countries rationally choose the unorganized
retailing. The lack of car ownership makes search cost in supermarkets higher than in
mom-and-pop stores. This view comes from the appropriate technology literature inBasu and Weil
(1998),Acemoglu and Zilibotti(2001).
Although the main purpose of our model is to find the link between the retail sector and the
manufacturing sector, both above insights exist in our model. The policy distortion is explained
through the tax effect, in which supermarkets must pay the corporate tax and transactions in
supermarkets are imposed the sales tax. The search cost effect is abstractly captured by the
shopping habit persistence in households’ utility function. In our model, the search cost is
lower in mom-and-pop stores as households’ member are more familiar with that kind of
retail-ing. If the organized retailing develops, the advantage of the lower searching cost in mom and
pop stores will be vanished over time1.
Our paper is also related to research on the informal economy and the tax distortion.Erasmo
and Moscoso Boedo(2012) show a low degree of debt enforcement and high cost of formality
lead to the large share of output is produced by low productivity informal firms. The
relation-ship between tax, the informal sector and the aggregate productivity could also be found in
Gollin(1995), De Paula and Scheinkman (2010) andOrdonez (2014). However, none of the
above papers are about the retail sector. In our model, the aggregate productivity goes up as
a result of the resource reallocation. In this sense, it is also related toRestuccia and Rogerson
(2008),Hsieh and Klenow(2009).
The paper is organized as follows. Section2lays out the model. Section3gives the
ical results about the platform effect and the tax effect. In section4, we calibrate the model for
the Indian economy and do some experiments to gauge the impact of the retail sector reforms
on the aggregate output. Finally, section5gives the conclusion.
2
The model
Time is discrete and continues forever. The economy consists of four types of agents:
house-holds, retailers, firms and the government. The detail description about each agent will be
discussed later, but the main interaction between four agents could be described as follows.
In order to buy consumption goods, every period a household must spend time on shopping
(or send their members to go shopping). The household could search goods through two retail
platforms: the organized retail platform (the supermarkets’ platform - denoted by "s") and the
unorganized one (the mom and pop stores’ platform- denoted by "m"). The good search process
is characterized byMoen(1997)’s directed search. There is a continuum of submarkets in each
platform. We follow BRS when a submarket belonging to the retail platform jis indexed by a
triplet (θj, pj, fj) of the market tightness, the unit price and the quantity of goods each seller
has. One important assumption here is the household can only send all their members into one
single submarket in each platform.
There is a continuum [0,1] of firms. These firms either supply for the platform "s" or "m"
but not both. A firm, who supplies goods for the platform j, is called firm j. Firm jwill use the
retailing service of the retailers in the channel j (j=s,m). After deciding the retail channel,
firm j chooses the single submarket (θj,pj, fj)to enter. It means that this firm will produce
exactly the quantity fj, sell goods with the unit price pjand know the ratio of firms to shoppers
in this submarket as θj. The expected firm’s revenue could be deducted alone from the
infor-mation of the submarket he enters. Similar to households, we assume that firms can only enter
one submarket.
In equilibrium, there is only one unique submarket in each retail platform where firms and
households could meet each other2. LetDj be the aggregate measure of shoppers in the
plat-2There is an assumption here to ensure the unique equilibrium. When choosing the submarket in the retail
form j, Ej be the measure of firms j (Es+Em=1). Following BRS, the matching process
between the buyers and sellers in the platform jis taken by:
Mj=AjDϕjE1
−ϕ
j , j=s,m
The market tightness, defined as the ratio of number of firms to shoppers, isθj=Ej/Dj. In
a successful meeting, a buyer will buy all fjunits of goods from a seller with price pjper unit.
Therefore, when entering the submarket(θj,pj, fj), the number of goods a household can
find when sendingdjshoppers is:
cj=dj∆j(θj)fj=djAjθ1
−ϕ
j fj, j=s,m
Similarly, choosing the submarket(θj,pj, fj), a supplier j expects to get the revenue:
R(θj,pj, fj) =pjΓj(θj)fj=pjAjθ
−ϕ
j fj, j=s,m
At the end of the period, we assume all the unsold goods will be perished3.
About the cost side, a firm incurs two kinds of cost: the production cost and the retailing
cost; in which, the latter is paid to the retailers. In our model, all the retailers in the same
channel share the unique platform in their channel, where the transactions between firms and
households are taken place. Supermarkets are the retailers for the platform "s" and
mom-and-pop stores are the retailers for the platform "m". The retailers transport goods to a particular
submarket in the shared platform under the firms’ direction and sell goods for firms. Firms pay
the retailing fees for these services. The ownership of goods will be transferred directly from
firms to households.
Although the introduction of the friction in goods market is abstract, it captures some
im-portant features to match the reality. First, shoppers prefer the retail platform with low price, a
lot of brands without too many other shoppers. Second, firms prefer the retail channel where
the different submarkets in each channel, then there might be multiple price dispersion equilibria.
3The model can be extended to allow the inventory. However, adding the inventory will make the model much
the retailing cost is low and households often go shopping. Third, the number of successful
transactions is increasing with the measure of shoppers and firms. Fourth, not all goods are sold
at the end of the period. These four features are important to characterize the main insight of
our paper. Next, we describe the link between the retail sector and the manufacturing sector.
The most important assumption in our paper mentions that all goods supplied through the
supermarket system must come from formal firms. Laws in many countries require
supermar-kets to ensure the origin of goods. As the products of informal firms are not registered with the
government, it is likely that they do not meet the standards to be sold in supermarkets. Bohme
and Thiele(2012) find the strong empirical evidence in Africa that informal goods are hardly
bought through the formal distribution channels. By using a survey of 48000+ small firms in
Brazil, De Paula and Scheinkman (2010) show the formality of suppliers and purchasers is
highly correlated.
Therefore, we want to model firms in the channel "s" must be formal; while the channel "m"
includes both formal firms and informal firms.4 However, the problem in the directed search
will be much more complicated with two kinds of firms in the channel "m".5 We deal with this
problem by directly assuming there is only one kind of firm in the channel "m", and firm "m"
will produce from two plants: one formal plant and one secret informal plant. This assumption
still allows us to see the resource reallocation between the formal plant and the informal plant
within the channel "m". To ensure the number of total plants in the economy is unchanged with
the firms’ platform choice, we also assume each formal firm "s" will produce from two formal
plants.
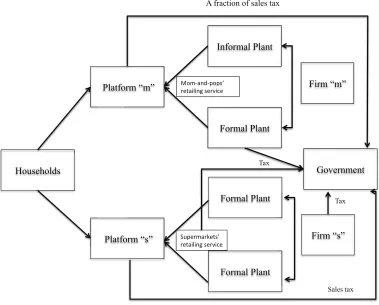
The government collects taxes from firm "s", the formal plant of firm "m" and
supermar-kets. Another source of the government’s revenue comes from the sales tax; which is assumed
to be collected fully in the platform "s", but only partially in the platform "m". The relationship
between four agents could be described by the figure2.
4In developing countries, goods displayed in informal mom-and-pop stores come from both formal firms and
informal firms.
5The unique submarket in the platform "m" in equilibrium might no longer be true and the household’s problem
Platform “m”
Informal Plant
Platform “s”
Firm “m”
Formal Plant
Households Government
orm “s” orm “m”
Informal Plant
Firm “m”
Formal Plant
A fraction of sales tax
!"#$%&'%($)*+, %$)'-.-/0,*$%1-2$, 34&5'/65#4#*+, %$)'-.-/0,*$%1-2$,
Formal Plant
Firm “s”
Formal Plant
!"#$%&'%($ %$)'-.-/0,*$%1
Sales tax Tax
[image:10.612.126.505.86.391.2]Tax
Figure 2: The relationship between agents
2.1
Households
There is a measure one of identical households in the economy. Each household is endowed
with one unit of labor, which they supply inelastically in the labor market every period. Their
preference includes the goods they consume (c) and the disutility when they sends their
mem-bers to go shopping in the platform j(dj). The household’s utility in one period has the form:
U(c,ds,dm) =u(c)−h(ds−γD−s )−h(dm−γD−m)
withu′(.)>0,u′′(.)<0,h′(.)>0,h′′(.)>0
We incorporate the external shopping habit persistenceD−j into the household’s utility
func-tion6. The literature of the external habit persistence in DSGE model was first introduced by
6The notationD−
Abel(1990), then Campbell and Cochrane(1999), Smets and Wouters(2007), where the slow
adjustment in consumption is explained by the agent’s habit. The same idea applies in our
model, but for the shopping habit. When most members of households are familiar with the
mom-and-pop platform, it becomes more convenient for them to search goods there. Even
when the supermarkets’ platform becomes more attractive, it needs a transition time to adjust
the household’ behavior.7The speed of the adjustment in the shopping activities is governed by
the parameterγ. The bigger it is, the more persistent is the shopping habit.
It might be more appropriate to also include the internal habit persistence (d−j itself) into the
utility function. However, the household’s problem in the directed search becomes too
compli-cated with the appearance ofdj. The transition of the model is also not much different with the
appearance ofdj as the state variable, so we only include the external habit in our model.
Each household makes their decision based on the state of economy Ω= (zs,D−s ,D
−
m)8
wherezsis the productivity of supermarkets9; their own state b, which is the number of firms’
shares they hold. We normalize the price of a share to unity. We follow BRS in formulating the
household’s problem. Here the household treats a number of the aggregate variables as given:
the market tightness θj, price pj and quantity fj in each retail channel as well as the wagew
and the law motion of the aggregate stateG(.).
It is important to note that we separate the household’s problem into two sub-problems: i)
Given the identified single submarket (θj, pj, fj) in each platform, what are the household’s
choices ondj andc(which we introduce in this section); and ii) How do households and firms
choose the submarket(θj,pj, fj)in the competitive search environment (which we introduce
in the section 2.4)10. A household’s problem could be written as:
V(b,Ω) = max
c,ds,dm,b′
U(c,ds,dm) +βV(b′,Ω′) (1)
7SeeKhalifa, Limayem and Liu(2002) for the empirical evidences on the shopping habit persistence. 8The fact of includingD−
j into the state of economy is very reasonable if we think about the supply side. When
choosing the retail channel, firms, in reality, must do the data analysis on households’ shopping activities in the past as they expect the persistences on households’ behaviors.
9The target of our model is to examine the response of households, firms and economy when there is a jump in
the supermarkets’ productivity.
10Similar to BRS, the unique submarket in each retail platform "j" in equilibrium allows us to break down the
subject to
cj=dj∆j[θj(Ω)]fj(Ω), j=s,m (2)
c=cs+cm, (3)
Ω′=G(Ω), (4)
b′+ (1+τs)ps(Ω)cs+ (1+δ τs)pm(Ω)cm= (1+π(Ω))b+w(Ω) (5)
The first equation shows that the number of goods households could find in each channel
depends on the number of shoppers the household sends to each platform as well as the market
tightness and number of goods displayed in each platform. The second equation simply states
that total consumption is equal to the sum of goods bought in each channel. The third equation
is the motion of the state variables while the last one is typically a budget constraint. In the
budget constraint, τs is the sales tax which the government collects fully in the platform "s".
In the platform "m", the government could only collect a fractionδ of total sales tax.11 The
variableπ is the profit of firms, andwis the wage rate. The solution to this problem is a set of
individual decision rulesc(b,Ω),dj(b,Ω). In equilibrium, the individual decision is consistent
with the aggregate part, so we introduce the aggregate counterparts of these functions:
b′(1,Ω) =1
C(Ω) =c(1,Ω)
Dj(Ω) =dj(1,Ω)
We will characterize some important households’ decisions under the aggregate form. The first
one shows how the household allocates the shoppers between two retail channels:
−h′Ds(Ω)−γD−s
Isps(Ω)∆s[θs(Ω)]fs(Ω)
+u
′(C(Ω))
Isps(Ω)
= −h
′
Dm(Ω)−γD−m
Impm(Ω)∆m[θm(Ω)]fm(Ω)
+u
′(C(Ω))
Impm(Ω)
(6)
11As the platform "m" belongs to the informal economy, the government could not control all the activities there.
whereIj=
1+τs if j=s
1+δ τs if j=m
The second one is the standard intertemporal condition:
u′(C(Ω))−h
′
Dj(Ω)−γD−j
∆j[θj(Ω)]fj(Ω)
=βpj(Ω)(1+π(Ω
′))
pj(Ω′)
u′(C(Ω′))−h
′
Dj(Ω′)−γDj(Ω)
∆j[θj(Ω′)]fj(Ω′)
!
(7)
Let m(b,Ω) denote the discounted value in terms of marginal utility of an additional unit of
savings and letM(Ω)be its aggregate part, we have:
m(b,Ω) =β
∂V(b′,Ω′
)
∂b′
,
M(Ω) =β1+π(Ω
′)
Ijpj(Ω′)
u′(C(Ω′))−h
′
Dj(Ω′)−γDj(Ω)
∆j[θj(Ω′)]fj(Ω′)
!
(8)
2.2
The retailers
There are two types of retailers in the economy: supermarkets (in the channel "s") and
mom-and-pop stores (in the channel "m"). The retailing market in each channel is perfectly
competi-tive. We assume all the retailers in the channel jshare the single platform j, where takes place
goods transactions between firms and households. Firms pay the retailers for transporting their
goods to a particular submarket in this shared platform. The retailers also sell goods for firms.
We assume retailers only conduct the retailing service, they never own the goods in the whole
process.
The matching ability of the shared platform j is shown by the parameter Aj. These
plat-forms incur no cost in the matching process between households and firms.
A firm’s goods must be transported and sold by a single retailer. To transport and sell f units
of goods in the shared platform j, a retailer in the channel jneeds to hire :
lRj(f) = f
1/α zj
We could interpretzj as the productivity of the retailers in the channel j. We assume firms are
in the different locations; therefore, a retailer could not bundle the services for different firms
together.12
We assume all supermarkets in the channel "s" are formal while all mom-and-pop stores
in the channel "m" are informal. There are two significant characteristics to differentiate the
formal sector from the informal one: the former pays the tax with rateτcto the government; the
latter could avoid the tax but it has the lower productivityzm<zs.13 We assumeτc is imposed
on the total cost, rather than profit, to reflect all the distortions on the formal sector (corporate
tax, compensation for workers, red tapes, fees).
If we account on tax, the total costs for retailing f units of goods in the retail channel "s"
and "m", respectively, are :
xRs(f,Ω) = (1+τc)
zs
f1/αw(Ω) (10)
xRm(f,Ω) = 1
zm
f1/αw(Ω) (11)
As the retail market is perfectly competitive, the minimum cost of retailing is also the price
firms must pay for the retailers for the services of transporting and selling goods .
2.3
Firms
There is a measure one of firms, who at the beginning of period, based on the household’s
shopping pattern in the previous period and the productivity in supermarketsΩ= (D−s ,D−m,zs),
must make two important decisions in order: (i) first, whether to use the retail channel "s" or
"m" as the platform to approach consumers, (ii) second, the specific submarket in each channel
to get into. If they choose supermarkets as their retailers, they will produce all their products
from two formal plants. If they choose the mom and pop stores’ platform, they will produce
12This assumption is equivalent to a retailer must use the different workers when conducting the services for
different firms.
13In this paper, we assume directly the informal firm is less efficient than the formal firm. We do not model the
micro-foundation for this phenomenon. However, this fact is well recognized in the literature, seeBasu(2003),
from two plants: one formal plant and one informal plant.14
The production function of the formal plant and informal plant are respectively as:
ff =lα, α <1
fm=
l
1+ε
α
, α <1,ε>0
The difference in the cost of production reflects the same thing in the retail sector. The
formal plant suffers the taxτcimposed on the production cost while the informal plant, though
less efficient, could avoid the tax. When entering the submarket, firms know explicitly their
expected revenue.
2.3.1 Firms "s"
As firm "s" owns two identical formal plants exhibiting the decreasing return to scale, the
opti-mal allocation for firm "s" to produce fs units of goods is that each plant produces fs/2 units.
By using (10), the total cost of producing and retailing fsunits of goods for the platform "s"
is:
xs(fs,Ω) = 2(1+τc)(fs/2)1/αw(Ω)
| {z }
Production Cost
+ (1+τc)(zs)−1fs1/αw(Ω)
| {z }
Retailing Cost
= Θsfs1/αw(Ω)
where
Θs= (1+τc)
21−1/α+ 1
zs
(12)
LetΠj(θj,pj, fj)be the expected profit a firm could earn when entering the submarket(θj,pj, fj).
It is clear that:
Πs(θs,ps,fs,Ω) = psΓs(θs)fs
| {z }
Expected Revenue
− Θs fs1/αw(Ω)
| {z }
Cost
14The reason for the existence of two kinds of plants is explained at the beginning of the model. The firms’
2.3.2 Firms "m"
The problem with firms in the channel "m" is more complicated. To minimized the cost of
producing fm units, firstly the owner must allocate the production between the formal plant
(fmf) and the informal plant (fmi). His problem is
min
fmf fmi
(1+τc)(fmf)1/αw(Ω) + (1+ε)(fmi)1/αw(Ω)
subject to fuf+fui= fm
The solution for the above problem is:
fmf =
1
σ+1fm whereσ =
1+τc
(1+ε) 1−αα
fmi = σ
σ+1fm
By using (11), the total cost of producing and retailing fmunits of goods for the shared platform
"m" is:
xm(fm,Ω) =
1+τc
(σ+1)1/α f
1/α
m w(Ω)
| {z }
Formal plant
production cost
+ (1+ε)
σfm
σ+1
1/α w(Ω)
| {z }
Informal plant
production cost
+ 1
zm
fm1/αw(Ω)
| {z }
Informal
re-tailing cost
=Θmfm1/αw(Ω)
where
Θm= 1+τc
(σ+1)1/α + (1+ε)
σ
σ+1
1/α
+1+ε
zm
(13)
So when entering the submarket(θm,pm,fm),the expected profit a firm "m" can earn:
Π(θm,pm,fm,Ω) = pmΓm(θm)fm
| {z }
Expected Revenue
− Θmfm1/αw(Ω)
| {z }
Let ϒj(Ω) be the maximum expected profit a firm in the channel "j" can earn over all the
available submarkets(θj, pj, fj), it means:
ϒj(Ω) = max
(θj,pj,fj)
Π(θj,pj,fj,Ω)
Then at the equilibrium:
ϒs(Ω) = ϒm(Ω) (14)
Otherwise, firms will flock into the channel with the higher expected profit until the expected
profits of two channels are equal.
2.4
Competitive search for goods
In the section 2.1, we examined the household’s choice given the information of submarkets in
equilibrium are identified. In this section, we set up the condition for the submarket(θj, pj, fj)
in the platform jin equilibrium.
Given the state (Ω,b) and the value functionV(); letξ be an object showing the household’s
value when they enter an arbitrary submarket (θs,ps, fs) in the platform "s" and an arbitrary
submarket (θm,pm, fm) in the platform "m". We define:
ξ θs,ps, fs,θm,pm, fm,Ω,b
=max
ds,dm
u[dsAsθ1
−ϕ
s fs+dmAmθm1−ϕfm]−h[ds−γD−s ]−h[dm−γD−m]+
βV[(1+π(Ω))b+w(Ω)−IspsdsAsθ1
−ϕ
s fs−ImpmdmAmθm1−ϕfm,Ω′] (15)
This is the household’s value function with the last term is simply taken by using the
house-hold’s budget constraint (5) to replace b′. The competitive goods search problem could be
characterized as follows. The household will search and choose one submarket in each retail
platform to maximize their value; however, the household could only meet firms j in the
sub-market(θj,pj, fj) if that submarket offers firms j the expected profit at least equal to ϒj(Ω)
The directed search problem could be written as:
max
θs,ps,fs,θm,pm,fm
ξ θs,ps, fs,θm,pm, fm,Ω,b
(16)
subject to
psΓs(θs)fs−Θsfs1/αw(Ω)≥ϒs(Ω) (17)
pmΓm(θm)fm−Θmfm1/αw(Ω)≥ϒm(Ω) (18)
Letλjbe the Lagrange multiplier of the firm’s participation constraint in the channel j(j=s,m).
We define:
L =ξ θs, ps, fs,θm, pm, fm,Ω,b+λs
psΓs(θs)fs−Θs f
1/α
s w(Ω)−ϒs(Ω)
+
λm
pmΓm(θm)fm−Θmf
1/α
m w(Ω)−ϒm(Ω)
Take the first order condition ofL with respect toθj, pj and fj (j=s,m), then impose the
equilibrium condition, we could get two following important equations for each channel: ( the
detail solution in the appendix):
pj(Ω) =
(1−ϕ)u(C(Ω))
IjM(Ω)
(19)
α pj(Ω)Ajθj(Ω)−ϕfj
| {z }
Expected Revenue
= (1−ϕ) Θjfj(Ω)1/αw(Ω)
| {z }
Cost
(20)
The equation (19) shows the condition for the prices at two retail channels in equilibrium.
Although we set up the problem differently from BRS, the equation (19) has the similar form to
their result. The difference between the price in the retail platform "s" and the one in the retail
platform "m" is the sales tax wedge that is uncollected in the platform "m".
The equation (20) shows the relation between the firm j’s expected revenue and its cost in
equilibrium. To ensure firms to get the positive expected profit, we need to make the following
Assumption A1:α <1−ϕ
Does this condition make sense? First, we must understand the role ofϕ. In the economy
without any frictions in goods marketϕ =0, total goods consumers buy Dj(Ej/Dj)fj equal
the total goods supply in the marketEjfj . As we expect our model is near with the
friction-less benchmark model, the value of ϕ is very small near 0. So the above condition is not an
unreasonable assumption.
2.5
Government
The government collects the sales tax and corporation tax to serve for its purpose of producing
the public goods. The production function of public goods is:
yg=lg
Assume the government will produce exactly ¯g unit of public goods in every period, the
government expenditure will be: G=gw¯ . This means ¯gworkers are in the public sector every
period. We assume the sales tax rateτs and the level ¯gare fixed.15 The government will adjust
the rateτc each period to keep the government budget balanced. 16
LetTsandTcbe, respectively, the tax revenue from the sales tax and from the formal sector.
The budget balance condition is:
Ts+Tc=G (21)
2.6
Equilibrium
LetlRj(Ω)andlFj(Ω)be the measure of workers in the retail sector and manufacturing sector in
the channel j. We define the equilibrium as followings:
Definition: Equilibrium is a set of decision rules and values for the householdc,dj,b′,V as
a function of its state(b,Ω); the retailers and firms’ decision rules(lRj,lFj)as a function of the
15In most countries, the sales tax (or VAT) rate is much more stable than the corporation tax rate.
16After a jump inz
s, there might be multiple new steady states with different values ofτcsatisfying the budget
balance condition. We assume the government will choose the path ofτcsuch that the value ofτcat the new steady
general stateΩ, and the aggregate measure of shoppers in the supermarketsDs, shoppers in the
mom and pop’s storesDm, consumptionC, profitϒj, the measure of firms in the channel "s"Es,
the measure of firms in the channel "m"Em, wagesw, taxτc, goods’ prices ps and pm, market
tightness θs and θm, production of firms fs and fm as functions of the aggregate state Ωthat
satisfy the following conditions:
1. Households’ choices and value functions satisfy (1-5) and (6-7).
2. Firms’ decision of hiring labor is to minimize the cost of production.
3. Competitive search conditions: Households and firms go to the submarkets satisfied (14) and
(19-20).
4. Individual household decisions are consistent with aggregate variables.
5. Government budget satisfies (21).
6. Market clearing conditions:
b′(1,Ω) =1 (22)
Cj(Ω) =Dj(Ω)∆j[θj(Ω)]fj(Ω), (j=s,m) (23)
∑
j=s,m
lRj(Ω) +lFj(Ω)=1−g¯ (24)
θs(Ω) =
Es(Ω)
Ds(Ω)
(25)
θm(Ω) =
1−Es(Ω)
Dm(Ω)
(26)
3
Analytical results
In this section, we will find how a permanent rise in the productivity of the organized retail
sector zs could affect the allocation of resources between the formal sector and the informal
one. The shock on the retail productivityzs transmits to the manufacturing sector through two
channels: (i) (platform effect) by making the supermarkets’ platform better for both households
and firms making transactions, it induces firms to become formal to supply goods through the
supermarkets’ system; (ii) (tax effect) by allowing the government to lower the tax rateτc, it
Both effects lead to the result that more firms will choose to become formal and supply
goods through the platform "s". Consequently, the aggregate productivity will increase, as a
formal plant is more efficient than an informal one. We will discuss in detail two mechanisms,
then illustrate why the shock on the retail sector has a huge amplified effect on the aggregate
productivity in the economy. We start this section by making some assumptions on the form of
households’ utility function.
Assumption A2: The individual household’s utility in one period has a particular form:
U(c,ds,dm) =
c1−ζ
1−ζ −
(ds−γD−s )1+ν
1+ν +
(dm−γD−m)1+ν
1+ν
, ν>0
The parameterγ controls how persistent the shopping habit is. The bigger it is, the more
unlikely households will switch to the unfamiliar shopping channel. The parameterν controls
how intensively a household can shop in one platform. Let think that a household includes a
positive measure of members working in the different locations. Some job locations might be
near the platform "m" and very far from the supermarkets’ platform "s". Forcing these members
to switch to the supermarkets’ platform will increase substantially the search cost. Therefore, it
is reasonable to assume the parameterν is positive.
Assumption A3:γ =0
In most parts of this section, we temporarily omit the shopping habit persistence. Although
the shopping habit is an important parameter to reflect the transition of the model, it might be
more useful to leave it aside to discover the main mechanism of the platform effect and the tax
effect. Whenγ=0, the model becomes static, making it more convenient to do the comparative
exercises. We also omit the state variableΩasγ=0. We will be back to the full dynamic model
in the quantitative exercise.
3.1
The Platform Effect
We first investigate the effect ofzs on the demand side. Then we show the interaction between
the demand side and the supply side in choosing the platform to make transactions. Finally, we
Proposition 1: Under the assumptions (A1)-(A3), the number of shoppers between two
plat-forms in equilibrium:
Ds
Dm
=
1+δ τs
1+τs
1−ϕ
ϕν A
s
Am
1
ϕνΘ
m
Θs
α ϕν
(27)
Under the additional assumptionτcis fixed, then:
∂(Ds/Dm)
∂zs
=
α(1+τc)
ϕνz2
sΘs
Ds
Dm
>0 (28)
whereΘsandΘmare from (12) and (13).
The number of shoppers in the platform "s" depends on how much this platform is better
than its rivalry in terms of the matching technology and the offered price. As the change in the
supermarkets’ productivityzs triggers the change in the government’s tax policy, we
temporar-ily assumeτcis fixed to separate the platform effect from the tax effect. The first remark is the
response of (Ds/Dm) to the change inzscould be huge, depending on two parametersϕ andν.
The smaller those parameters are, the bigger is the platform effect on the demand side. What is
the mechanism behind this?
An increase in the supermarkets’ productivity will lower the cost of goods sold, and
there-fore the unit price, in the platform "s". Responding to the more attractive price, more households
will switch to the supermarkets’ platform for shopping. However, when many shoppers flock
in the platform "s", the probability of finding goods, controlled by the parameterϕ, might be
declined. As we explained in the assumption (A1), the congestion of finding goods is extremely
small in reality; we expect the parameterϕ near 0. This implies that the relative demand could
jump strongly in response to the change inzs.
The other parameter,ν, controls how intensively households could go shopping in one
plat-form. The lower in the unit price in the channel "s" will only pull a large number of shoppers
to itself if the cost of switching the platforms is low for households. That is how the parameter
ν goes into the equation (28). After fully understanding the effect ofzson the relative demand
(Ds/Dm), we move on investigating its effect on the supply side. We characterize an important
equation (which remains valid in the dynamic setting) showing the interaction between the
Proposition 2: Under the assumption (A1)-(A2), in equilibrium, the ratio between measure of
firms using the retail channel "s" and the ones using the retail channel "m" will satisfy:
Es Em |{z} Supply =
1+δ τs
1+τs
1/ϕ
Ds
Dm
| {z }
Demand
As
Am
1/ϕΘ
m
Θs
α/ϕ
(29)
Equation (29) clearly shows that a firm’s decision of entering a specific retail channel
de-pends on both the relative cost structure (Θm/Θs) and the demand side (Ds/Dm). A rise in the
supermarket’s productivityzssimultaneously decreases the cost of goods soldΘsin the channel
"s" and increases the relative demand in channel "s" (the proposition 1). The jumps in two
im-portant components on the right hand side in equation (29) implies that the change inzstriggers
the big movement of firms in the manufacturing sector from the channel "m" to the channel "s".
To see it more clearly, we have:
Corollary 1: Under the assumption (A1)-(A3), in equilibrium:
Es
Em
=
1+δ τs
1+τs
1−ϕ+ν
ϕν A
s
Am
1+ν
ϕν Θ
m
Θs
α(ϕν1+ν)
(30)
Assume the taxτcis fixed:
∂(Es/Em)
∂zs
=
α(1+ν)(1+τc)
ϕνz2
sΘs
Es
Em
>0
The equation (30) is just the result derived from (28) and (29), but it is important in the
sense of showing the aggregate effect of the retail sector’s shockzson the manufacturing sector.
The supply side, like the demand side, is very sensitive to the small change inAs orzs, givenϕ
is near 0. That happens due to the propagation effect when the retail sector plays the role as a
two-sided platform. The lower retailing cost makes more firms choose the platform "s" to
ap-proach households. When households observe more brands now in the supermarkets’ platform,
they switch to the platform "s" as they can buy more goods there. The change in demand, in
turn, has a feedback effect on the supply side. The interaction between the demand side and the
Figure 3: The effect ofzs on economy with searching
Discuss the role of search friction in our model
By introducing the frictions in goods market, we highlight the role of the retail sector as the
two-sided platform. In the searching environment, a small positive productivity shock on
super-markets can be amplified through the interaction between demand and supply. The increase in
zs shifts both demand (consumers) and supply (firms) to the platforms, increasing transaction
in supermarkets.
In the environment without searching, the literature normally assumes the consumer will
consume a basket of goods (C) from both goods: the one bought from supermarkets (Cs) and
the other from mom-and-pop storesCm:
C= (ωCmα+ (1−ω)Cαs )1/α
In this case, the role of the retail sector is much smaller. An increase in zs only shifts the
relative supply side to the right. The supermarkets can only attract consumers by lowering the
price of goods (the movement along the demand curve). In our model, supermarkets can attract
making the purchasing process more convenient for consumer. The distance of the shift in the
supply side in the model without goods searching is also smaller as the interaction between
[image:25.612.128.487.158.396.2]demand and supply is lost. Figure4illustrates our argument.
Figure 4: The effect ofzson economy without searching
Recalling that all the suppliers in the channel "s" are formal (supermarkets only sign contract
with formal firms), a change in the productivity of the organized retailers could hugely motivate
informal firms to become formal. There is an implication in two equations (27) and (29) that
the retail sector might be the key sector for the transformation process from informality to
formality in emerging economies. Instead of inefficiently trying detecting all informal firms,
the government could use the resources to promote the organized retail platform.
It is also worth noting that households will only choose one channel for shopping in the case
of no friction in the goods market (ϕ=0) or the marginal disutility from sending a shopper to
a platform is constant (ν =0). In the former case, there is no role for demand, so firms just
choose the best channel for their cost structures. In the latter case, households do not incur any
extra costs when intensively shopping in one platform. They just choose the best platform to
0 0.5 1 1.5 0.05
0.1 0.15 0.2 0.25 0.3 0.35 0.4 0.45
¯
g
τ
[image:26.612.126.468.88.296.2]c
Figure 5: Laffer curve responds to the rise inzs
3.2
The Tax Effect
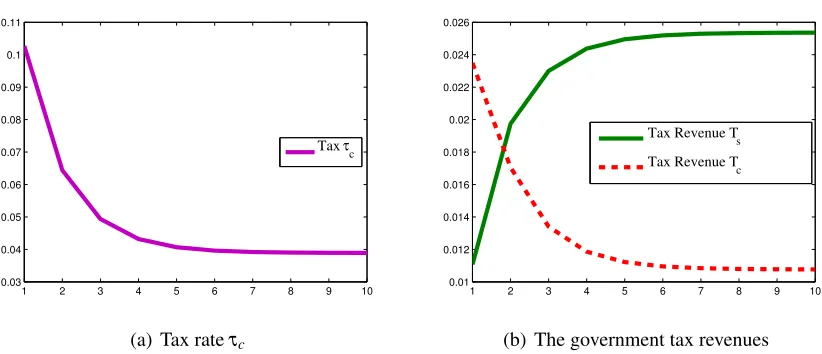
If more transactions take place in the supermarkets’ platform, the government tax revenue will
increase. This allows the government to cut the tax rateτcwhile their tax receipts still meet the
spending needs of producing public goods. As the formal sector tax rate τc affects the firms’
decision whether to become formal, the lower tax rate has a feedback effect on the aggregate
economy. Figure5shows the change in the Laffer curve whenzsgoes up.
Aszs goes up, both households and firms prefer the supermarkets’ platform to make
trans-actions, increasing the percentage of goods transacted in supermarkets. Therefore, the tax rate
τc could be reduced firstly due to the higher contribution of the sales tax. Second, more firms
become formal to sign contracts with supermarkets, making the burden of tax on each
individ-ual formal firm and supermarket also reduce.
The effect of reducing the tax rate τc will affect the whole allocation in the economy, not
only between two channels in the retail sector and the manufacturing sector, but also within the
channel "m" itself. The result is summarized in the following proposition.
Proposition 3: Under (A1)-(A3), when there is a reduction inτc :
(i) Firm "m" will reallocate the production from the informal plant toward the formal plant
(ii) There is also a firms’ movement from the channel "m" to the channel "s" (between
chan-nel reallocation).
Intuitively, when τc reduces, the option of using the informal plant becomes less attractive
(σ decreases), firms in the channel "m" produce more outputs by the formal plant, that explains
for the allocation within the channel "m". For the reallocation between the two channels (detail
proof in the appendix), the basic idea is both channels enjoy the reduction inτc. However, the
relative cost of goods sold becomes more favorable to the channel "s" as τc affects both the
retailers and the manufacturers in this channel:
∂
Θm Θs
∂ τc
=
−
21−1/α+ 1
zs
"
(1+ε)
σ
σ+1
1/α
+ 1
zm
#
Θ2
s
<0
This leads to the reallocation from the channel "m" to the channel "s". Both reallocations
substantially gain the higher productivity for the economy.
3.3
The Aggregate Productivity
The change in the productivity of supermarketszs, through the combination of the platform
ef-fect and the tax efef-fect, could raise significantly the total outputs and the aggregate productivity
of the economy. Mom-and-pop stores in the retail sector and informal plants in the
manufactur-ing sector are not as efficient as supermarkets and formal plants. Whenzsgoes up, in the retail
sector, workers will move from mom and pop stores to supermarkets. In the manufacturing
sector, workers will move from informal plants to formal plants. If we consider manufacturing
and retailing as the one whole process with the production function f = (Zl)α, we can divide
productivity of each group as follows:
ZFS=
1+ 1
zs
−1
(Formal plant, supermarket’s retailing)
ZFM=
1+ 1
zm
−1
(Formal plant, mom and pop’s retailing)
ZIM=
1+ε+ 1
zm
−1
(Informal plant, mom and pop’s retailing)
Under the conditionzs>zmandε>0, we haveZFS>ZFM>ZIM. Whenzsgoes up, through
the combination of the platform effect and the tax effect, goods will be reallocated from theIM
process to the production processFM, and especiallyFS. The transmission of shocks from the
retail sector to the manufacturing sector significantly improves the productivity of the whole
economy.
4
Experiment
We use the above model to do some experiments, gauging the impact of the transformation of
the retail sector on the aggregate productivity in India. Although India is one of the biggest
retail markets in the world, the organized retailers (supermarkets, modern stores) only account
for about 10 percent of the market share. Market is dominated by informal, unorganized, small
mom-and-pop stores. Before 2012, the Indian government forbade all foreign groups from any
ownership in supermarkets, convenience stores or any retail outlets. This made the
productiv-ity of the Indian retail industry much lower in comparison to other countries allowing FDI in
this sector. However, in Dec 2012, India significantly changed the policy, allowing multi-brand
retailers with 51 percent ownership from foreign groups to enter the local market. The
appear-ances of the global retailers are expected to boost the productivity of the organized retail sector.
To estimate the impact of this structural change, we calibrate the initial steady state of the
model to the Indian economy in 2012.17 Then we make a simulation of the model to examine
17There are some indicators about informal firms in India in which we could only find data from the survey in
Table 1: Parameter values
Param. Definition Value Source
ζ Risk aversion 2 Set Exogenously
β Discount factor 0.99 Set Exogenously
γ Habit persistence parameter 0.3 Set Exogenously
α Span of control parameter 0.9 Set Exogenously
ε Labor productivity in informal plants 1.13 Match targets
τs The VAT rate on consumption goods 0.1 Match targets
A The matching of the retail platform 0.95 Match targets
ϕ Elasticity of the matching function 0.07 Match targets
¯
g Government’s public goods produced in each period 0.11 Match targets
ν The elasticity of shopping 0.1 Match targets
zs Productivity of supermarkets 4.31 Match targets
zm Productivity of mom-and-pop stores 4.15 Match targets
δ The fraction of VAT collected in the informal platform 0.3 Match targets
the transition path when the productivity of supermarketszs jumps to a new level.18 We fix the
productivity of the manufacturing sector and mom-and-pop stores, as we want to focus on the
effect of this structural change alone on the aggregate productivity.
4.1
Calibration
The model at the initial steady state is calibrated in order to match the Indian economy in 2012.
The form of the household’s utility function is the same as the one in the assumption (A2). We
also assume the matching technology in two platforms are identical, soAs=Am=A. We divide
parameters into two groups: (i) a set of parameters are set exogenously or estimated outside
the model, (ii) the other ones are calibrated within the model to match some particular targets.
Table1summarizes the parameter values.
To estimate the difference between the productivity of formal plants and informal plants in
the manufacturing sector in India, we use two datasets to estimate the difference in value-added
per worker. The first dataset is "Informal (Micro) Enterprises Survey in India" (IES) conducted
byThe World Bank(2006). The second dataset is the Annual Survey of Industries (ASI), which
18We could think the appearance of the foreign retailers as the shock pushing upz
sto a new level. We assume
0
2
4
6
8
Percent
42500 82500 122500 162500
[image:30.612.148.462.75.306.2]Value−added per worker in informal plants
Figure 6: Indian Informal Plant’s Labor Productivity
covers the registered manufacturing plants in India. Our method to estimate the value-added
per worker is similar toLagakos(2009). Data and method is recorded in our data appendix.
The average value-added per worker of a formal plant estimated from the annual report of
ASI (2006) is (Rs 214,256). The value-added per worker of an informal plant, mainly ranging
from Rs 42500 to Rs 100000, is much lower than this number. The Figure6shows the
distribu-tion of the value-added per worker calculated for informal plants from the "Informal Enterprise
Survey" .
It can be clearly seen that the average productivity of an informal plant is only as half as
the one of the formal plant in the Indian manufacturing sector. To pin down into one point data
serving for the calibration purpose, we calculate the average labor’s productivity of all informal
plants, which is (Rs 95,801). The result is an informal plant’s productivity is only equal to 47%
of the formal plant’s productivity. We use this information to calibrate the value ofε:
1
1+ε =0.47 ↔ ε=1.13
Since 2005, India has replaced the sales tax system by VAT (Value-added tax). Our model
VAT. Although VAT system is different across states, there are two common VAT rates in India:
4 percent (for food) and 12.5 percent (for majority of goods). We calculate the weighted tax
rate based on the breakdown revenue in organized retailing sales (IBEF, 2013). The result is
τs=0.1 reported in Table1.
The remaining parameters are calibrated to match the statistics in the initial steady state
with the Indian economy (Table 2). The ratio between the government’s final consumption
expenditure (excluding government investment) and Indian GDP is from World Bank 2012;
the contribution of the retail sector in GDP is fromAblett et al.(2007); the market share of the
organized retailers is fromIBEF(2013), and the share of informal worker in retail sector is from
Naik(2009). For the ratio between VAT revenueTs and the revenueTc, the ratio is calculated
from two reports. The total VAT revenue (217,000 in crores of Rupees) across 28 states in the
fiscal year in 2011-2012 is fromSantra and Hati(2014). The total tax revenue from the formal
sector19(493,158 in crores of Rupees) is fromMinistry of Finance(2013).
The calibration for two parameters A and ϕ is specific to this kind of model. We match
this two parameters with the indicator of inventory-to-sales ratio (unsold-to-sold goods in the
model) in the organized manufacturing sector in India and the ratio between household’s time
spent on shopping and working. The first indicator is calculated from the ASI report as the
ratio between the physical working capital (1666.2 in crores of Rupees) in census to the total
output (9379.55 in crores of Rupees). The second indicator could not be found in the Indian
survey of households. We must borrow this target from the American’s time use survey (2013).
On average, an American spends 0.37 hours/day on purchasing the consumer goods and 3.14
hours/day on working. The ratio between shopping time and working time is roughly 0.12 .
4.2
Steady State
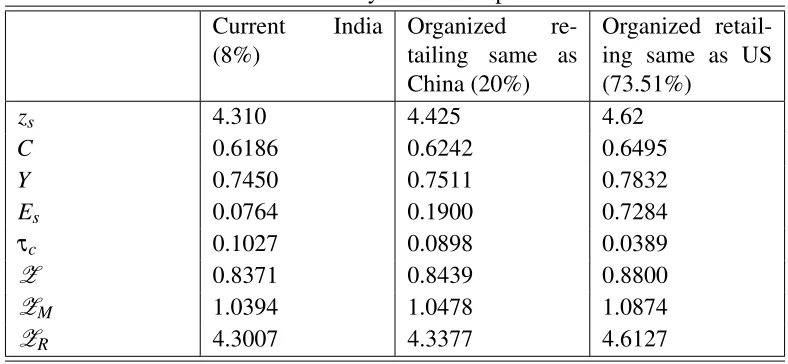
We compare the Indian economy at 2012 (the initial steady state) to the two hypothetical steady
states where the organized retailers in India capture the market share identical to the level in
19We calculate this tax revenue by adding the total corporation tax revenue and the income tax revenue. As the
model has only labor as the factor of production and tax is imposed on total cost, it is reasonable to thinkTcas the
Table 2: Calibration Target
Statistics Target Model
Government’s final consumption expenditure - GDP ratio 0.11 0.10
The ratio of tax revenueTc to VAT revenue 2.2 2.1
Contribution of the retail sector to GDP 0.16 0.17
Organized retailers’ market share 0.08 0.08
Share of informal worker in retail sector 0.94 0.95
Inventory-to-sales ratio in the manufacturing sector 0.18 0.20
Shopping time- working time ratio 0.12 0.14
China (20 percent in 2006) and the one in US (73.51 percent in 2007).20 We assume that the
Indian economy reaches to the new steady state by the change in the supermarkets’ productivity
[image:32.612.107.501.346.528.2]alonezs. Table3below compares the key economic indicators in these steady states.
Table 3: Steady States Comparison Current India
(8%)
Organized re-tailing same as China (20%)
Organized retail-ing same as US (73.51%)
zs 4.310 4.425 4.62
C 0.6186 0.6242 0.6495
Y 0.7450 0.7511 0.7832
Es 0.0764 0.1900 0.7284
τc 0.1027 0.0898 0.0389
Z 0.8371 0.8439 0.8800
ZM 1.0394 1.0478 1.0874
ZR 4.3007 4.3377 4.6127
We defineZ, ZM, ZR respectively as the aggregate productivity of the private sector, the
20We use the US Economic Census 2007 to calculate the the market share of the organized retailers in US. We
manufacturing sector and the retail sector:
Z = Total goods produced (Y)
Labor in the private sector =
Esfs+Emfm
1−g¯
ZM= Total goods produced (Y)
Labor in the manufacturing sector =
Esfs+Emfm
lsF+lmF
ZM= Total goods produced (Y)
Labor in the retail sector sector =
Esfs+Emfm
lRs +lmR
The relationship betweenZ,ZM,ZR is:
1
Z =
1
ZM +
1
ZR (31)
Recalling that the total labor supply in the private sector in these steady states are identical,
the increase in outputs comes both from the resources reallocation in the manufacturing sector
and the retail sector. A 2.6 percent increase in the productivity of the organized retailers leads
to an increase in total outputs of 0.82 percent. It also results in an increase in the aggregate
productivity of 0.81 percent. On average, a 1 percent increase inzsin India leads to an increase
in the aggregate productivity of 0.31 percent. Recall that in 2012 the number of workers in
supermarkets only accounts for 1 percent of the total labor force in India. How does a sector
with only 1 percent of total labor force could trigger this huge effect on the whole economy?
We decompose the total effect into parts to understand the mechanism behind the aggregate
number. By the equation (31), we could break down the increase of the aggregate productivity
into the contribution of the manufacturing sector and the retail sector. Whenzs goes up by 2.6
percent,ZM goes up by 0.80 percent,ZRrises up by 0.86 percent. We could rewrite (31) under
the form:
∆
1
Z
= ∆
1
ZM
| {z }
Contribution of manufacturing sector
+ ∆
1
ZR
| {z }
Contribution of retail sector
The result is that 80 percent of the change in the aggregate productivity is caused by the
change in the structure of the manufacturing sector, while the remaining 20 percent is due to
the platform effect and the tax effect, has a spillover effect on the manufacturing sector. The
biggest benefit of reforming the retail sector in India is the shift of the manufacturing sector to
the formality.
To see the transformation of the economy, the next section will discuss about the transition
between these steady states. Analyzing the transition also gives us the image of the resource
reallocation process as well as the pace of transformation, which could not be observed through
the comparison of the steady states.
4.3
The Transition Experiment
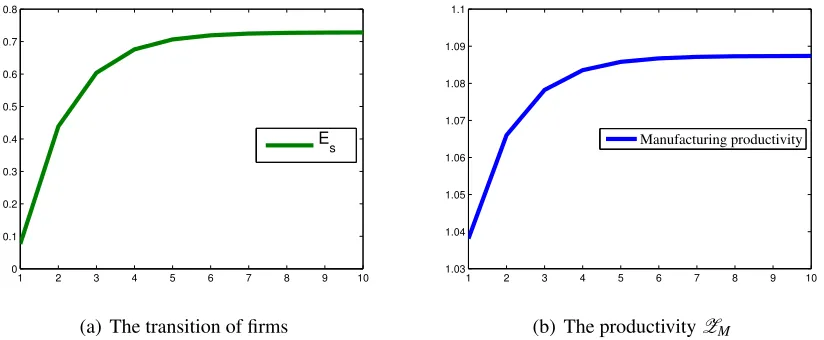
We simulate the transition by allowingzsto jump from 4.31 to 4.62 at the period 1, then it stays
at the new level forever. In this section, we illustrate the resource reallocation within the retail
sector as well as the manufacturing sector by graphs.
The Retail Sector: Even at the initial steady state, the productivity of supermarkets is
higher than the one of small informal mom-and-pop stores. However, 96 percent of workers
in the retail sector stuck in the latter, leading to a massive inefficiency for the Indian economy.
When the productivity of supermarketszsgoes up, the aggregate productivity of the private
sec-tor first gains from the reallocation of labor from mom-and-pop ssec-tores to supermarkets. Figure
7(a) shows how the market share of supermarkets changes and Figure7(b) illustrates the labor
trend in the retail sector whenzsgoes up.
The Manufacturing Sector: The increase in the productivity of supermarkets also leads to
the reallocations of firms in the manufacturing sector: firms move from the channel "m" to the
channel "s" to supply goods for the supermarkets’ platform. Figure8(a) illustrates the transition
of firms between two channels and Figure8(b) shows the rise in the aggregate productivity of
the manufacturing sector with this transition.
From two datasets IES and ASI, we did estimate that the formal plant’ s productivity nearly
doubles the informal plant’s productivity. The transition of the manufacturing sector from the
channel "m" (mixed between formal plants and informal plants) to the channel "s" (all formal
plants) significantly raises the aggregate productivity of the manufacturing sector as the