http://www.scirp.org/journal/psych ISSN Online: 2152-7199
ISSN Print: 2152-7180
Personality and Intelligence in a
High Ability Sample
Adrian Furnham
1,21Research Department of Clinical, Educational and Health Psychology, University College London, London, UK
2Norwegian Business School, Oslo, Norway
Abstract
In all 754 adults (518 males) in a high achieving school-leaver sample com-pleted two intelligence tests (Ravens Progressive Matrices; Graduate Man-agement Assessment Verbal and Numerical) and the 16PF. The study was concerned with the relationships between personality and intelligence. Cor-relational and regression analyses showed a few of the 16PF factors (partic-ularly Reasoning and Sensitivity) to be related to the various cognitive abili-ty test scores. The study shows that specific personaliabili-ty traits are modestly but consistently correlated with intelligence test scores. Implications are considered.
Keywords
Personality, Intelligence, Ravens, 16PF, High Ability
1. Introduction
There is a growing interest in the relationship between personality traits and in-telligence (Furnham, 2008; O’Connor & Paunonen, 2007; Poropat, 2009; von Stumm, Chamorro-Premuzic, & Ackerman, 2011). Studies have looked at the relationship between personality and intelligence (Chamorro-Premuzic & Furn-ham, 2004, 2005, 2006;Chamorro-Premuzic, Furnham, & Moutafi, 2004; Furn-ham, Forde, & Cotter, 1998; Moutafi, Furnham, & Paltiel, 2005; Furnham & Moutafi, 2012).
Studies have been done using various measures of both personality and intel-ligence but the results tend to show correlations are low and that Neuroticism is negatively, and Conscientiousness and Openness positively, correlated with in-telligence. There are however various differences as a function of which person-ality and intelligence tests are use, particularly the latter. This study aims to
ex-How to cite this paper: Furnham, A. (2017). Personality and Intelligence in a High Abi- lity Sample. Psychology, 8, 1355-1362. https://doi.org/10.4236/psych.2017.89088
Received: June 8, 2017 Accepted: July 17, 2017 Published: July 20, 2017
Copyright © 2017 by author and Scientific Research Publishing Inc. This work is licensed under the Creative Commons Attribution International License (CC BY 4.0).
http://creativecommons.org/licenses/by/4.0/
amine the relationship between the 16PF and three well established intelligence tests. It extends the analysis of Furnham and Crump (2013).
This study extends and replicates the work of Djapo et al. (2011)who tested the relationship between the 16PF, Ravens Advanced Progressive Matrices and the Mill Hill Vocabulary Scales on 105 Bosnian 3rd graders. Half of the 16 factors
were (modestly but significantly) correlated with fluid intelligence (particularly
Reasoning positively and Sensitivity negatively) but there were far fewer signifi-cant correlates (two only) of crystallised intelligence. The authors calculated the “big five” Cattellian higher order factors and performed regressions. Only the regression for fluid intelligence was significant and accounted for a quarter of the variance. Two higher factors (Tough-Mindedness and Independence) were positive predictors and two (Extraversion and Anxiety) were negative predictors of fluid intelligence.
This study advances this modest study first by having a large adult population of over 700 people, second by having three measures in intelligence including a numeric and vocabulary measure, and third by exploring the role of sex differ-ences in the relationship between personality and intelligence. The 16PF is an unusual test in that one of the subscales is a 15 item ability measure labelled
Reasoning that assesses abstract reasoning and problem solving. Many studies have demonstrated that it correlates in the region of r = .5 with other well estab-lished measures like the WAIS-R Full scale (Abel & Brown, 1998; O’Connor & Little, 2003). Note that unlike intelligence tests, the 16PF is not timed, yet this factor (Reasoning) seems a good index of intelligence. As a consequence it was predicted that this 16PF factor is most highly correlated with (all and any) measures of intelligence and that in a regression the 16PF would account for more of the variance (>10%) than other studies which have regressed intelli-gence test scores on personality variables.
2. Method
2.1. Participants
There were 754 participants of which 543 were male. Their mean age was 29.74 years (SD = 2.67: Males 29.99, SD = 2.73; Females 29.17, SD = 2.44). Nearly all (92%) were Asian graduates. Just over three-quarters (77.1%) had studied in the science pre-university stream as opposed to the arts stream. They were all talented young people assessed as part of a high potential scheme in a govern- ment organisation that assessed people for promotion in the public sector. In all 426 males and 155 females had science degrees and 92 males and 81 females arts degrees. All had university standard English fluency.
2.2. Tests Used
2.2.1. Ravens Progressive Matrices (Raven, 1965)
the relationship between the patterns. The alpha was .93.
2.2.2. The Graduate Management Assessment (GMA-A)
The GMA-A is a high level test of abstract reasoning ability. It measures the ability to think conceptually to discover underlying patterns within a set of in-formation and to switch easily between contexts and levels of analysis. This test is composed of two parts: Verbal and Numerical. Each part takes 30 min to complete.
A. The Verbal test presents candidates with a short piece of factual prose together with four statements. Respondents have to decide whether the statements are true, false or cannot tell, from the information provided. The participants are encouraged to detach themsleves from their own beliefs and prejudices when answering the questions. The Alpha was .89.
B. The Numerical test presents the subjects with a short scenario, followed by three questions. Respondents have to choose a right answer from a set of 16 possible responses. It aims at testing the problem-solving skills of the participants. The Alpha was .90.
2.2.3. Sixteen Personality Factor (5th Edition) Cattell, Cattell, & Cattell (1990)
This is an established 40 year old, 185 multiple choice item test that measures 16 dimensions of personality. Those scores can be combined into five global factors. The test has been used extensively over the years and is one of the most psychometrically validated of all personality tests (Kline, 1995).
2.3. Procedure
All participants were applicants for a high potential talent government scheme which offered free overseas tution to successful candidates. They were all tested under exam conditionover a two period. Tests were all given in the same order. They were all given feedback on their performance.
3. Results
3.1. Correlations
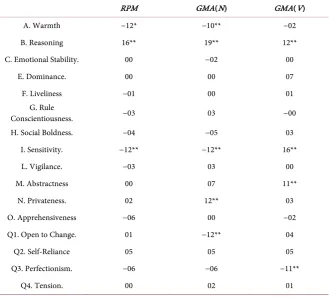
Table 1. Correlations between the 16 factors and the three intelligence test scores.
RPM GMA(N) GMA(V)
A. Warmth −12* −10** −02
B. Reasoning 16** 19** 12**
C. Emotional Stability. 00 −02 00
E. Dominance. 00 00 07
F. Liveliness −01 00 01
G. Rule
Conscientiousness. −03 03 −00
H. Social Boldness. −04 −05 03
I. Sensitivity. −12** −12** 16**
L. Vigilance. −03 03 00
M. Abstractness 00 07 11**
N. Privateness. 02 12** 03
O. Apprehensiveness −06 00 −02
Q1. Open to Change. 01 −12** 04
Q2. Self-Reliance 05 05 05
Q3. Perfectionism. −06 −06 −11**
Q4. Tension. 00 02 01
**p < .01, *p < .05. N = 794.
3.2. Regressions
Table 2 shows the results of three stage-wise regressions. All were significant al-thougth there was a different pattern. The regression for the Raven’s test showed that overall only 4% of the variance was accounted for, and that was by Factor B (Reasoning) and Factor I (Sensitivity).
The regression with the GMA Numerical score as the criterion variable showed sex and age alone accounted for 9% of the varaince with younger males doing best. When the 16 personality factors were included three accounted for another 5% of the variance. Those who scored higher on B (Reasoning) and N (Privateness) but lower on Q1 (Open to Change) did best. The regression for the GMA Verbal score showed older participants did better and that this accounted for 4% of the variance. Four 16PF factors accounted for an additional 5%: Those who scored higher on B (Reasoning), E (Dominance) and I (Sensitivity), but lower on Q3 (Perfectionism) did best. When the three ability tests were com-bined the results showed the two demographic factors accounted for 4% of the variance with younger males doing best. Three 16PF factors accounted for a further 7% of the variance: Those who scored high on B (Reasoning) and E (Dominance) but low on Q3 (Perfectionism) did best.
3.3. Higher Order Factors
Table 2. Regressional results with intelligence tests as the criterion variables and sex, age and personality as the predictor variables.
RPM N V TOT
Beta t Beta t Beta t Beta t
Gender −02 0.51 −20 5.10*** 02 0.45 −10 2.73** Age −02 0.62 −18 4.69*** −21 5.38*** −21 5.63*** A. Warmth 08 1.56 00 0.11 −06 1.24 −06 1.18 B. Reasoning 16 4.15*** 18 4.87*** 13 3.48*** 21 5.89*** C. Emotional
Stability. 00 0.12 05 1.10 03 0.68 06 0.82 E. Dominance. 05 1.06 08 1.69 12 2.66*** 12 2.68**
F. Liveliness. 04 0.81 06 1.35 −02 0.39 03 0.76 G. Rule
conscientious. 00 0.09 04 0.91 05 1.21 05 1.15 H. Social Boldness. −06 1.18 −04 0.74 00 0.13 −04 0.74 I. Sensitivity. −12 2.67** −07 1.56 15 3.39*** 00 0.74 L. Vigilance. 04 1.07 −01 0.37 −01 0.38 03 0.81 M. Abstractness. −02 0.38 05 1.21 02 0.51 03 0.73 N. Privateness. −03 0.76 10 2.28* 00 0.22 04 0.97 O. Apprehension. −03 0.64 00 1.16 −01 0.20 −02 0.44 Q1.Open to Change. 03 0.67 −10 2.37** 02 0.36 −03 0.75 Q2. Self Reliance. 06 1.18 04 0.79 05 0.96 06 1.36 Q3. Perfectionism. −05 1.08 −04 0.99 −13 3.17*** −10 2.64***
Q4. Tension. 00 0.38 00 0.14 −02 0.55 01 0.24 Step 1 (gender/age)
F(2,726)= 4.76** 36.56*** 14.76*** 18.55***
Adj R2 01 09 04 04
Step 2 16P
(F,18,740)= 2.68*** 7.02*** 4.98*** 5.97***
Adj R2 04 13 09 11
***p < .001, **p< .01, *p < .05.
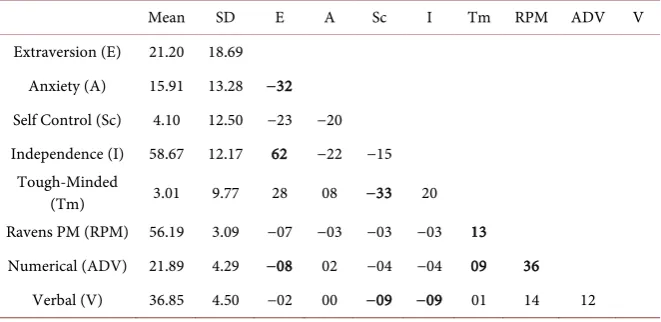
and Crump (2013) did an oblimin (oblique) rotation for this sample using the scree test to determine the number of factors. The factors were similar, but not identical to those in previous studies (Aluja & Blanch, 2004; Hofer, Horn, & Eber, 1997). They were labelled Extraversion, Anxiety, Self Control, Indepen-dence and Tough Mindedness. These higher order factors were then correlated with the three ability tests (see Table 3).
Table 3. Correlations between the 16PF higher order factors and the intelligence test scores.
Mean SD E A Sc I Tm RPM ADV V Extraversion (E) 21.20 18.69
Anxiety (A) 15.91 13.28 −32 Self Control (Sc) 4.10 12.50 −23 −20 Independence (I) 58.67 12.17 62 −22 −15
Tough-Minded
(Tm) 3.01 9.77 28 08 −33 20 Ravens PM (RPM) 56.19 3.09 −07 −03 −03 −03 13
Numerical (ADV) 21.89 4.29 −08 02 −04 −04 09 36 Verbal (V) 36.85 4.50 −02 00 −09 −09 01 14 12 Correlation > .15 are p < .001.
This factor 4 which is similar to the Self Control factor was significantly nega-tively correlated with all three ability tests scores (−.09 > r < −.11). Equally the fifth factor was negatively correlated the Ravens (r = .10) and GMA Numerical (r = −.11) but positively correlated with the GMA Verbal test score (r = .13).
Similarly the same regressions as in Table 2 were run except this time with the five higher order scores. All regressions showed that Factor one, four and five were negative predictors of the intelligence test scores. The regression that ac-counted for most of the variance was that for GMS Verbal (F(7,751) = 8.94, p > 001; AdjR2 = .07. The betas for the five factors in order were −.21, −.08, .09, −.11
and .11 showing three negative and two positive predictors. Thus the regressions of the Big Five derived from the 16PF accounted for about the same amount of variance as that of the analysis with the 16 factors.
4. Discussion
Correlations between the 16PF personality traits and the three intelligence test scores showed few significant correlations and only limited consistency across the three measures. As predicted, and found in previous studies, the correlation between Factor B (Reasoning) and the three intelligence tests was significant and positive but lower (.12 > r < .19) than in previous studies. The results for Factor I (Sensitivity) were also in accordance with the previous literature showing to be positively correlated with verbal/crystallized measures, but negatively correlated with fluid/numerical measures (Djapo et al., 2011). It is related to Neuroticism on the Big Five Model and Intuition in the MBTI literature which is confirmed by the description of High and Low scorers in the 16PF manuals.
of the variance (after sex and age were controlled) for the Ravens. This is much lower than the 26% accounted for in the study by Djapo et al. (2011). The re-gressional results were however interesting for three reasons. First, gender and age accounted for between 1% and 9% of the variance. The results showed that younger people scored higher and that on numerical intelligence, males scored much higher than females. In fact, demographics accounted for more than the 16 personality factors in total. Second, as may be expected Factor B (Reasoning) was a consistent and the strongest predictor for all the regressions providing yet more evidence of the concurrent validity of this short 15 item scale. Third, the three regressions showed that different personality measures predicted different intelligence tests scores.
This study also provided concurrent evidence of the validity of the 16PF Rea-soning scale which was modestly and significantly correlated with all three much longer ability measures. One explanation for the lower correlations in previous studies could be the potential restriction of range in this study, particularly for the intelligence tests. Previous studies using students however show similar scores to those found in this sample (Flynn & Rossi-Case, 2011), and students have been the overwhelmingly most common group on which to examine the relationship between personality traits and intelligence scores. Again, the results of the study illustrate the point that the precise nature of the relationship be-tween personality and intelligence is dependent on the particular test used.
References
Abel, M., & Brown, K. (1998) Validity of the 16PF Reasoning Ability Scale. Psychological Reports, 83, 904-906.
Aluja, A., & Blanch, A. (2004). Replicability of First-Order 16PF-S Factors. Personality and Individual Differences,37, 667-677.
Cattell, R., Cattell, A., & Cattell, H. (1990). 16PF: 5th Edition. New York: Psychological Corporation.
Chamorro-Premuzic, T., & Furnham, A. (2004). A Possible Model for Understanding the Personality-Intelligence Interface. British Journal of Psychology, 95, 249-264.
Chamorro-Premuzic, T., & Furnham, A. (2005). Personality and Intellectual Competence. New York: Lawrence Erlbaum.
Chamorro-Premuzic, T., & Furnham, A. (2006). Intellectual Competence and the Intelligent Personality. Review of General Psychology, 10, 251-267.
Chamorro-Premuzic, T., Furnham, A., & Moutafi, J. (2004). The Relationship between Estimated and Psychometric Personality and Intelligence Scores. Journal of Research in Personality, 38, 505-513.
Djapo, N., Kolvenovic-Djapo, J., Djokic, R., & Fako, I. (2011). Relationship between Cattell’s 16PF and Fluid and Crystallised Intelligence. Personality and Individual Dif- ferences, 51, 63-67.
Furnham, A. (2008). Personality and Intelligence at Work.London: Routledge.
https://doi.org/10.4324/9780203938911
Journal of Psychology, 64,128-137.
https://doi.org/10.1111/j.1742-9536.2011.00036.x
Furnham, A., Forde, L., & Cotter, T. (1998). Personality and Intelligence. Personality and Individual Differences, 24, 187-192.
Hofer, S., Horn, J., & Eber, H. (1997). A Robust Five-Factor Structure of the 16PF.
Personality and Individual Differences, 23, 247-269.
Kline, P. (1995). Handbook of Psychological Testing.London: Routledge.
Moutafi, J., Furnham, A., & Paltiel, L. (2005). Can Personality and Demographic Factors Predict Intelligence? Personality and Individual Differences, 38, 1021-1033.
O’Connor, M., & Paunonen, S. (2007). Big Five Personality Predictors of Post-Secondary Academic Performance. Personality and Individual Differences, 43, 971-990.
O’Connor, R., & Little, I. (2003). Revisiting the Predictive Validity of Emotional Intel- ligence. Personality and Individual Differences, 35, 1893-1902.
Poropat, A. (2009). A Meta-Analysis of the Five-Factor Model of Personality and Aca-demic Performance. Psychological Bulletin, 135, 322-336.
https://doi.org/10.1037/a0014996
Raven, J. (1965). Progressive Matrices. London: Lewis.
Von Stumm, S., Chammo-Premuzic, T., & Ackerman, P. (2011). Re-Visiting Intelligence- Personality Associations. In T. Chammo-Premuzic, S. von Stumm, & A. Furnham
(Eds.), The Wiley-Blackwell Handbook of Individual Differences (pp. 217-241).
Ox-ford: Blackwell.https://doi.org/10.1002/9781444343120.ch8
Submit or recommend next manuscript to SCIRP and we will provide best service for you:
Accepting pre-submission inquiries through Email, Facebook, LinkedIn, Twitter, etc. A wide selection of journals (inclusive of 9 subjects, more than 200 journals)
Providing 24-hour high-quality service User-friendly online submission system Fair and swift peer-review system
Efficient typesetting and proofreading procedure
Display of the result of downloads and visits, as well as the number of cited articles Maximum dissemination of your research work
Submit your manuscript at: http://papersubmission.scirp.org/