arXiv:1011.3943v1 [cond-mat.mes-hall] 17 Nov 2010
D. K. K. Lee,1 P. R. Eastham,2 and N. R. Cooper3
1Blackett Laboratory, Imperial College London, London SW7 2AZ, United Kingdom 2School of Physics, Trinity College, Dublin 2, Ireland.
3
Cavendish Laboratory, University of Cambridge, Cambridge CB3 0HE, United Kingdom
(Dated: September 1, 2010)
We present a theory for the regime of coherent interlayer tunneling in a disordered quantum Hall bilayer at total filling factor one, allowing for the effect of static vortices. We find that the system consists of domains of polarized superfluid phase. Injected currents introduce phase slips between the polarized domains which are pinned by disorder. We present a model of saturated tunneling domains that predicts a critical current for the breakdown of coherent tunneling that is extensive in the system size. This theory is supported by numerical results from a disordered phase model in two dimensions. We also discuss how our picture might be used to interpret experiments in the counterflow geometry and in two-terminal measurements.
I. INTRODUCTION
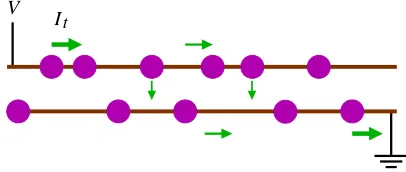
In a quantum Hall bilayer at total Landau level fill-ing νT = 1, Coulomb interactions induce a state with interlayer phase coherence1,2. This state is expected to be approximately the Halperin [111] state3, which can be understood as a Bose-Einstein condensate of inter-layer excitons4,5. The motion of excitons corresponds to counterflowing electrical currents in the layers, so that excitonic supercurrents can give dissipationless electrical transport. The superfluid properties of the [111] state have been demonstrated theoretically by Wen and Zee6,7. This counterflow superfluidity can be probed in tunnel-ing experiments. In the tunneltunnel-ing geometry (Fig. 1), a currentItis injected into the top layer at one corner and removed from the bottom layer at the opposite corner. These current flows may be written as superpositions of layer-symmetric and layer-antisymmetric currents,
Iin(out)= 1 2It
1 1
±
1
−1
, (1)
where the two components refer to currents in the two layers. Thus, the tunneling experiment corresponds to a flow of layer-symmetric current, with equal counter-flow currents ICF = It/2 injected by both the electron source and drain. The symmetric component is trans-ported by a dissipationless edge state, which does not penetrate the bulk due to an energy gap to charged exci-tations. However, the bulk can carry the counterflow component as a charge-neutral excitonic supercurrent. Since both these channels are dissipationless, we expect dissipationless electrical transport. In particular, a fi-nite interlayer current I at negligible interlayer voltage
V has been predicted8,9. This has been recently con-firmed by four-terminal measurements by Tiemann and coworkers10,11. This phenomenon can be regarded as a form of the Josephson effect7. Note that thermally acti-vated quasiparticles and contact effects12 can give rise to complications in actual experiments.
The Josephson-like regime persists for interlayer cur-rents up to a critical valueIc. AboveIc, interlayer
trans-port becomes dissipative. Nevertheless, interlayer coher-ence can still be detected in the interlayerIV characteris-tics of the system. A strong peak is observed at zero bias in the differential interlayer conductivity. This is followed at low bias by a regime with negative differential con-ductivity13,14. This regime can be studied theoretically treating the interlayer tunneling as a perturbation15–17.
[image:1.612.336.539.338.424.2]V It
FIG. 1. Schematic diagram of tunneling experiment.
In this paper, we focus on the Josephson regime be-low the critical current, and present a physical picture of its breakdown. We have previously presented, in a short paper18, a theory of this breakdown based on nu-merical results on a one-dimensional model. The aim of the present paper is to present numerical results for a two-dimensional model, which directly demonstrate the breakdown mechanism in a realistic geometry. The key motivation of our work is to understand the observation11 that the critical currentIc is proportional to the sample area. (Area scaling is also observed in the zero-bias peak of the interlayer conductivity19. We will discuss this in section VI.) The source and drain contacts for the ap-plied current are located at opposite ends of the system. If one models this system as a clean homogeneous bi-layer using reasonable estimates of the tunnel splitting, one finds that the injected current should have tunneled across the bilayer within a few microns of the source con-tact [λJ in Eq. (6)]. Such a current profile would suggest that the critical value of the interlayer current should
of the bilayer if one accepts a tunnel splitting that is anomalously small by several orders of magnitude12.
A similar puzzle is found in the original observation of dissipationless counterflow22,23 in the counterflow ge-ometry (Fig. 3). Again, counterflow currents apparently traverse the system over distances orders of magnitude further than expected. We will return to this geometry in the final section.
The resolution of this puzzle lies in the presence of disorder. We shall see (Fig. 2) that, in the presence of static phase disorder (pinned vortices), the supercurrent profile can be pinned by disorder. The time-independent supercurrents can then penetrate into the sample over indefinitely large distances, limited only by the finite size of the sample. In fact, we find that dissipation only appears when supercurrents completely fill the sample. This mechanism gives a critical current [Eq. (11)] which is proportional to the area of the sample. The magnitude of this critical current agrees with experiments, using rea-sonable estimates of the parameters18.
This paper is organized as follows. We will discuss the origin of disorder in the bilayer in Section II. Then, in section III, we will introduce the phase Hamiltonian for the excitonic superfluid that describes the interlayer-coherent phase of the quantum Hall bilayer. In section IV, we discuss how quenched vortices in the superfluid affect the ground state of the system and its response to injected currents. Then, in section V, we present the results of a numerical simulation of the bilayer in the tunneling configuration to support the prediction of our theory. In the final section, we discuss how our picture can be used to interpret experiments for the bilayer in other configurations.
II. MODEL OF DISORDER
Weak disorder, such as a spatially varying tunneling splitting, does not affect the tunneling properties of the system dramatically24. A tunneling mechanism based on a disordered edge has been proposed by Rossi et al25. However, such a theory predicted linear scaling with the sample length but not its area.
We consider here a bilayer with charge disorder in the bulk. One common source for this disorder is the elec-trostatic potential due to disordered dopant layers. We expect the incompressible quantum Hall phase to occupy only a fraction of the sample, with the remainder occu-pied by puddles of compressible electron liquid. Thus, the incompressible phase forms a network of channels sepa-rating puddles of sizeξ ≈dd ≈200 nm, the distance to the dopants. We suppose that the width of the channels is of the order of the magnetic lengthℓB ∼20 nm. This coherent network model was first studied in the context of the quantum Hall bilayer by Fertig and Murthy26.
In a quantum Hall superfluid, excess charge nucleates vortices in the exciton superfluid16,17,26–28. For a bal-anced bilayer with individual layer fillingsν1=ν2= 1/2
these vortices are merons of charge ±e/2. (In an un-balanced bilayer the charges are29 ±eν
1(2).) In previous work27, we have studied how the vortex density is deter-mined by a competition between the superfluid energy cost of the vortex and the charging energy of each pud-dle. We found that the bilayer can be strongly disordered in the current experimental regimes. This suggests that the random field due to the pinned vortices has an expo-nentially decaying correlation function in space.
The above scenario provides a specific physical model for quenched vortices with short-ranged correlations in the exciton superfluid. The theory we present below de-pends on the existence of trapped fractionale/2 charges to create these vortices but does not depend crucially on the details of the disorder distribution. Our results should be valid as long as the vortices are dense enough that their separation (∼ξ) is smaller than the clean tun-neling length scaleλJ [Eq. (6)].
III. PHASE MODEL
In the previous section, we have outlined a model of disorder which induced quenched vortices in a quan-tum Hall state. To describe this exciton superfluid with quenched vortices, we start with an effective Hamilto-nian for the phaseθ of the superfluid. We separate out the component,θ0, of the phase field that is due to the quenched vortices. The remaining component,φ≡θ−θ0, would have no vorticity in the ground state but may ac-quire vorticity in the presence of injected currents and other external perturbations. It can be shown that the effective Hamiltonian can be written as a random field XY model:
Heff = Z hρ
s 2 (∇φ)
2−tcos(φ+θ0)idDr, (2)
which describes the low-energy phase fluctuations of a bilayer containing pinned vortices. This form is a simple extension of the form for a clean model8. The first term describes the superfluid stiffness to phase twists while the second describes the interlayer tunneling. We will assume that the quenched phase fieldθ0 has a correlation length ofξ.
In the Josephson regime, there is no quasiparticle flow at zero temperature. All currents are accounted for by superflow and coherent tunneling. The counterflow su-percurrent density above the ground state,jCF, and the interlayer tunneling current density,Jt, are related to the phase field by:
jCF= eρs ¯
h ∇φ , Jt= et
¯
h sin(φ+θ
0). (3)
A time-varying superfluid phase φ(t) gives rise to an interlayer voltage differenceV viathe Josephson relation
V = ¯hφ˙
Therefore, a state with a finite interlayer current at zero interlayer voltage is time-independent, corresponding to a local minimum of the energy (2). The stationary equa-tion is simply the continuity equaequa-tion stating that the loss of counterflow current is accounted for by interlayer tunneling: ∇·jCF=Jt. This can be written as
−ρs∇2φ+tsin(φ+θ0) = 0. (5) All states with zero interlayer voltage obey this equa-tion. The dependence on the injected current arises as the boundary conditions at the source and drain specify-ing the injected counterflow componentjCF. In terms of the phase field, this is a boundary condition on∇φ.
We expect that the counterflow current injected at the boundary will decay into the sample because interlayer tunneling will recombine electrons and holes across the two layers, as depicted in Fig. 3. In the clean case (θ0= 0), one expects20,30 the static solution to show all the injected counterflow current tunneling across the bilayer over a “Josephson length” of
λJ= p
ρs/t . (6)
This length scale is estimated to be of the order of a few microns using realistic parameters.
Since the phase angle is compact, this implies a max-imum injected current density ofρs|∇φ| ∼πρs/λJ. For higher injected currents, phase slips enter and propagate through the system. This gives rise to a time-varying phase and hence a non-zero interlayer voltage via the Josephson relation (4).
Note that this picture of current penetration into the clean system gives a penetration depth as a microscopic length scale independent of the injected current. We will see below that the disordered system behaves qualita-tively differently — the current can penetrate into an indefinitely large area of the system. The reason is that injected phase slips are pinned by disorder and therefore a static solution to Eq. (5) can persist to higher injected currents. In the next section, we will discuss this picture of pinning.
IV. PINNED SUPERFLUID
We will now review the heuristic theory of pinning pre-sented in our previous work18in order to provide the con-text to interpret our simulation results. The quenched vortices play a crucial role for the critical current. They pin any injected supercurrents and sustain dissipationless states. This is reminiscent of how disorder pins magnetic flux in superconductors31–33, or charge in charge-density waves34. However, we emphasize that there is a signifi-cant difference in the bilayer compared to these other sys-tems. In the superconductor, the depinning force arises from the Lorentz force on the flux lines due to the bulk transport current. In charge-density-wave systems, de-pinning originates from the electric field in the bulk which
is an insulator when the charge density cannot slide. In the quantum Hall bilayer, depinning arises from the in-jected charge current which is appliedonly at the sample boundary. Thus, in this case, the critical current will depend on how the depinning “forces” are transmitted through the system. In such a geometry, it is not im-mediately obvious how the critical currentIcwould scale with the area of the whole sample.
We will borrow from the Fukuyama-Lee theory34 of disordered charge density waves and the Imry-Ma the-ory35 for ferromagnets in random fields. We recall the form of the ground states of the random field XY model, Eq. (2), in the weak disorder regimeξ≪λJ relevant for the bilayer. In this regime, it is energetically costly for the phaseθto follow the random fieldθ0which varies over the scale of the correlation length ξ. The ground state consists of domains of polarized phase. These domains cannot be arbitrarily large because the energy cost of the mismatch between the phase and random field grows with the domain size. The energy cost for a phase twist that varies over the scale l is Es(l) ∼ ρslD−2 in D di-mensions. The typical tunneling energy of a polarized region of sizelis obtained by summing random energies in the range±tξD for its (l/ξ)Dcorrelation areas, giving
Et(l) ∼ tξD(l/ξ)D/2. The phases will twist when Et(l) exceeds Es(l). Therefore, the ground state consists of domains of sizeLddetermined by
Es(Ld)∼Et(Ld). (7) This “Imry-Ma scale” for the domain is:
Ld∼
ρ
s
tξD/2 4−2D
= λ2
J
ξD/2 4−2D
. (8)
In this ground state of polarized domains, the average coarse-grained phase over a domain is chosen such that the tunneling energy Ht of each domain is minimized. Since δHt/δφ(r) is the tunneling current at position r, the total tunneling current over the domain vanishes.
In two dimensions, Ld = λ2J/ξ. We see that, in the experimentally relevant regime of λJ ≫ ξ, this new disorder-induced length scale is much larger than the Josephson length. This is the length scale controlling current penetration into the sample. However, as we see below, this should not be interpreted simply as a renor-malized length scale for how far counterflow currents pen-etrate into the sample.
Consider now the effect of an injected counterflow which imposes a phase twist at the boundary. The phase will therefore twist away from its equilibrium configu-ration. We assume that the domain at the boundary remains polarized at short distances and so will rotate uniformly on the scale of Ld. This generates a tunnel-ing current which reduces the counterflow current. The residual counterflow currents will be transmitted further into the sample, causing the domains there to rotate in a similar way.
similar random sum to that for the tunneling energy,Et, and is given byIdf( ¯φ) where
Id=
eEt(Ld) ¯
h =
eρs ¯
h L
D−2
d , (9)
¯
φ is the deviation of the coarse-grained phase from its equilibrium value, and the range of f( ¯φ) is typically [−1,1]. To minimize the region pushed out of equilib-rium by the injected current, each domain will rotate so as to minimize the counterflow current transmitted into the sample. This maximizes the tunneling current and is achieved if we choose |f| ∼ 1. Thus, we argue that forcing at a boundary leads to a self-organized critical state, in which the driven part of the system is saturated at the threshold |f| ∼ 1. This means that the areaSt of the system driven out of equilibrium to provide co-herent tunneling is simply proportional to the number of domains necessary to carry the injected currentI. Each domain can support a current ofIdand so
St(I)
LD d
≈ I
Id
. (10)
The critical current is reached when all domains in the sample are saturated: S=St(Ic) for a 2D sample of area
S. Therefore the critical current for a sample of area S
is
Ic∼Id S
LD d
=eρs ¯
h S L2
d
, (11)
This formula also applies to the 1D case withSbeing the sample length.
V. NUMERICAL RESULTS
We will now present numerical results to support the theory in the previous section. Our numerical results are obtained using the dissipative model
−λφ˙= δHeff
δφ =−ρs∇
2φ+tsin(φ+θ0), (12)
whose stationary solutions ˙φ=V = 0 are the local min-ima of Eq. (2). This is performed on a lattice model. The phase field θ0
i at site i is uncorrelated with the phase field at any other site. This corresponds to taking the lattice spacing to be the correlation lengthξof the orig-inal continuum model. The natural unit of current is
I0 = eρs/¯h. The results that we present below are the results for a 200×20 lattice, averaged over 500 realiza-tions of the disorder. For this illustration, we take the ratio of the tunneling strength to the superfluid stiffness to be tξ2/ρs = 0.6. This corresponds to a Josephson depth λJ of the order of a lattice spacing and a domain size Ld of 2 lattice spacings. Although this is not deep in the weak-disorder regime considered in the previous
section, our results appear to support the conclusions in that section.
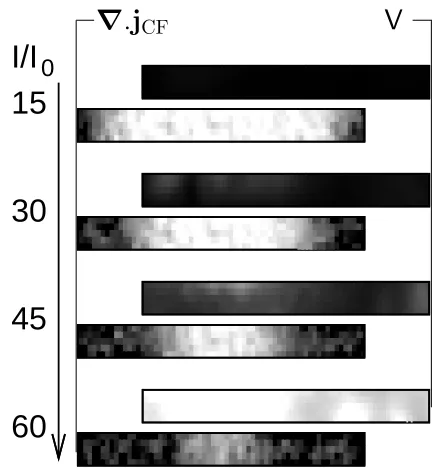
The boundary conditions for Eq. (2) are determined by the current flows through the sample12. We consider a tunneling geometry in which, as seen in Fig. 2, a current
Itis injected into the top layer at the bottom left corner and removed from the bottom layer at the bottom right corner. As already discussed [Eq. (1)], the counterflow component of the currents corresponds to equal counter-flow currentsICFinjected byboththe electron source and drain.
The ground state of the system is found by evolving from a random state using the dissipative dynamics (12) with the boundary condition of no injected current. From Eq. (3), this corresponds to ˆn·∇φ= 0 everywhere on the boundary with ˆn being the normal to the bound-ary. To model the current injection in a tunneling exper-iment, we then slowly increase the counterflow current at the source and drain sites (1 and 2) to the final values
ξnˆ ·∇φ|1 = ξnˆ ·∇φ|2 = I/I0. For the low values of the injected currentI, the dynamics reach a static solu-tion, corresponding to the Josephson regime with vanish-ing interlayer voltages. At higher currents, these time-independent solutions break down and the phase winds continuously in time. This corresponds to the break-down of the d.c. Josephson regime and the appearance of a state with finite interlayer voltages.
I/I
0
15
30
45
60
V
∇
[image:4.612.329.545.390.624.2].
j
CFFIG. 2. Spatial distribution of tunneling currents (left col-umn) and interlayer voltages (right colcol-umn), in a lattice model of 200×20 sites, with current injection at the two
We expect that the counterflow current injected at the boundary will decay into the sample because interlayer tunneling will recombine electrons and holes across the two layers. We find that the manner in which this occurs is qualitatively different in clean and disordered bilay-ers. As mentioned in section I, the penetration depth of the injected current is simply the Josephson length λJ in the clean case. We see in Fig. 2 that, for the disor-dered case, current penetrates further and further into the sample as we increase the injected current from the two ends. We see from the border of the regions with finite tunneling (∇·jCF6= 0) that the counterflow region increases linearly in area (St) with the injected current. This is consistent with the prediction [Eq. (10)] forStas a function of the injected current from our theory.
At a high enough injected current (I/I0 ≃ 50), the current profiles from the contacts (lower left and right corners) will meet in the middle of the lattice. Beyond this point, further increases in current cannot be accom-modated by coherent tunneling and an interlayer voltage develops.
We emphasize that this interpretation of the threshold for the breakdown of the stationary solutions is qualita-tively different from the clean case. In the clean model, the breakdown can be understood in terms of the in-jection of phase solitons at the boundary20,36 when the injected current exceeds the superflow that can be sup-ported by a static phase twist|∇φ| ∼π/λJ. These phase solitons propagate through the sample. Thus, the phase at any point varies in time, and the system develops an interlayer voltage by the a.c. Josephson effect. In this language, we can say that these injected solitons can be pinned by disorder so that stationary solutions exist even when there are many solitons in the system.
VI. DISCUSSION
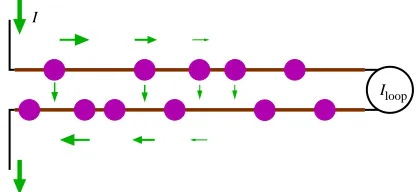
We have so far focused our discussion on the bilayer in the tunneling geometry. Finally, we will discuss how two other experimental situations can be interpreted in our theory. The first setup is the transport in the bilayer in a counterflow geometry where the source and drain contacts are on the same side of the bilayer while the other end is short-circuited to allow the current to flow from the top layer to bottom without the need for tun-neling. This is depicted schematically in Fig. 3. This was first investigated by Tutuc et al22 and Kellogg et al23. A large current (I
loop in figure) was found passing through the short circuit that join the top and bottom layers. This seems to imply that there is no leakage by tunneling across hundreds of microns. As we discussed in section I for the case of the tunneling geometry, a realistic estimate of the tunneling rate based on a clean bilayer predicts that the injected current would have tunneled across the bilayer within a micron andno current should remain at the far end.
In our theory, this situation can be simulated by
solv-Iloop
[image:5.612.334.542.54.150.2]I
FIG. 3. Schematic diagram of a counterflow experiment with a short circuit to complete current loop for counterflow. Iloop measures current through the short circuit. Diagram depicts the Josephson regime where the loss of counterflow current through tunneling means thatIloop= 0. The current-carrying region penetrates to the right as the injected current I is increased, eventually reaching the other end atIc.
ing Eq. (12) with injected counterflow current at one end only, say the left end of Fig. 2. We expect the tunnel-ing domains to saturate successively from this end, and the current profile is the same as that found in Fig. 2 for this side of the sample. There will be no current flow on the right side. In other words, we expect to see zero current in the short-circuit loop (Iloop = 0) in the Josephson regime. As we increase the injected currentI
to Ic, the current-carrying region reaches the other end of the sample. Any further currents will pass through the short circuit. For an ideal loop, we expectIloop=I−Ic. However, the short circuit itself should have a finite resis-tance. Therefore, the presence of a non-zeroIloopimplies a small interlayer voltage at the end of the sample. In the phase theory, the Josephson relation (4) means that the superfluid phase must wind in time. Thus, a static solu-tion to Eq. (12) becomes impossible anywhere in the sys-tem and the whole sample develops an interlayer voltage. We expect that the phase dynamics will be complex and chaotic. The nature of the steady state would depend on details of the damping mechanisms. This provides a zero-temperature picture of the counterflow geometry and is consistent with the recent experiments of Yoonet al37, in which the loop current Iloop is negligible for tunnel currents below a critical value. We should keep in mind that, at finite temperatures, there may be in-plane re-sistances associated with the flow of thermally activated quasiparticles.
voltage develops across the whole sample and the tunnel-ing current exists over the whole sample. In other words,
G(0) should be proportional to the area of the sample, as seen by Fincket al. We point out that, whereas this in-terpretation gives an intrinsic zero-temperature source of a finite conductance, there may be other sources of dissi-pation. Even belowIc there could be a finite dissipation due to contact resistances and thermal activated vortex motion. Fluctuations in the pinning energies could also lead to very weakly pinned regions in large samples38, which may lead to dissipation belowIc even atT = 0.
In summary, we have presented a theory of the Joseph-son regime of coherent tunneling in a disordered quan-tum Hall bilayer with static pinned vortices. We find that, in the tunneling geometry, there are two current-carrying regions emanating separately from the source and drain contacts. In these regions, coherent tunnel-ing is saturated. All injected counterflow current is lost by tunneling at the edge of these regions. The area of the saturated regionSt grows linearly with the injected current I. This linear relation is predicted by our the-ory and is confirmed by the numerical results presented here. This is analogous to the Bean critical state for flux penetration into a disordered superconductor.
This picture tells us that the system reaches the criti-cal current when the whole sample is saturated with co-herent tunneling. This results in a critical current that is
extensive for sufficiently large samples that contain many domains of polarized phase. In contrast, the clean limit12 sees area scaling forIconly for small samples (small com-pared to the Josephson length).
Theoretically, our results are qualitatively different from clean theories12 because of the existence of these pinned polarized domains. The sizeLdof these domains is a disordered-induced length scale that emerges in our theory [Eq. (8)]. This scale has no counterpart in the clean system. It would be therefore be useful if this length scale can be probed in experiments. We note that, for the area-scaling formula (11) to apply, the sample should be large enough to include many complete do-mains. For sample dimensions smaller thanLd, the sys-tem should cross over to a regime where Ic scales with the square-root of the sample dimension18:
Ic∼ eρs ¯
h
r
Lx
Ld
Ly
Ld
(quasi-1D:Lx≪Ld≪Ly).(13)
∼ eρs
¯
h
s
LxLy
L2 d
(forLx, Ly≪Ld). (14)
This crossover provides an experimental probe of the do-main sizeLd.
We thank P. B. Littlewood for helpful discussions. This work was supported by EPSRC-GB (EP/C546814/01) and Science Foundation Ireland (SFI/09/SIRG/I1952).
1 S. Q. Murphy, J. P. Eisenstein, G. S. Boebinger, L. N.
Pfeiffer, and K. W. West, Phys. Rev. Lett.72, 728 (1994). 2 T. S. Lay, Y. W. Suen, H. C. Manoharan, X. Ying, M. B.
Santos, and M. Shayegan, Phys. Rev. B50, 17725 (1994). 3 B. I. Halperin, Helv. Phys. Acta56, 75 (1983).
4 H. A. Fertig, Phys. Rev. B40, 1087 (1989).
5 J. P. Eisenstein and A. H. MacDonald, Nature432, 691
(2004).
6 X. G. Wen and A. Zee, Phys. Rev. Lett.69, 1811 (1992).
7 X. G. Wen and A. Zee, Int. J. Mod. Phys. B 17, 4435
(2003).
8 X. G. Wen and A. Zee, Phys. Rev. B47, 2265 (1993).
9 Z. F. Ezawa and A. Iwazaki, Phys. Rev. B 48, 15189
(1993).
10 L. Tiemann, W. Dietsche, M. Hauser, and K. von Klitzing,
New J. Phys.10, 045018 (2008).
11 L. Tiemann, Y. Yoon, W. Dietsche, K. von Klitzing, and
W. Wegscheider, Phys. Rev. B80, 165120 (2009). 12 J.-J. Su and A. H. MacDonald, Phys. Rev. B81, 184523
(2010).
13 I. B. Spielman, J. P. Eisenstein, L. N. Pfeiffer, and K. W.
West, Phys. Rev. Lett.84, 5808 (2000).
14 J. P. Eisenstein, Solid State Commun.127, 123 (2003).
15 R. L. Jack, D. K. K. Lee, and N. R. Cooper, Phys. Rev.
Lett.93, 126803 (2004).
16 A. Stern, S. M. Girvin, A. H. MacDonald, and N. Ma,
Phys. Rev. Lett.86, 1829 (2001).
17 L. Balents and L. Radzihovsky, Phys. Rev. Lett.86, 1825
(2001).
18 P. R. Eastham, N. R. Cooper, and D. K. K. Lee,
arXiv:1003.5191 (2010).
19 A. D. K. Finck, A. R. Champagne, J. P. Eisenstein, L. N.
Pfeiffer, and K. W. West, Phys. Rev. B78, 075302 (2008). 20 D. V. Fil and S. I. Shevchenko, J. Phys.: Condens. Matter
21, 215701 (2009).
21 M. Abolfath, A. H. MacDonald, and L. Radzihovsky, Phys.
Rev. B68, 155318 (2003).
22 E. Tutuc, M. Shayegan, and D. A. Huse, Phys. Rev. Lett.
93, 036802 (2004).
23 M. Kellogg, J. P. Eisenstein, L. N. Pfeiffer, and K. W.
West, Phys. Rev. Lett.93, 036801 (2004).
24 O. G. C. Ros and D. K. K. Lee, Phys. Rev. B81, 075115
(2010).
25 E. Rossi, A. S. Nunez, and A. H. MacDonald, Phys. Rev.
Lett.95, 266804 (2005).
26 H. A. Fertig and G. Murthy, Phys. Rev. Lett.95, 156802
(2005).
27 P. R. Eastham, N. R. Cooper, and D. K. K. Lee, Phys.
Rev. B80, 045302 (2009).
28 M. M. Fogler and F. Wilczek, Phys. Rev. Lett. 86, 1833
(2001).
29 B. Roostaei, K. J. Mullen, H. A. Fertig, and S. H. Simon,
Phys. Rev. Lett.101, 046804 (2008). 30 P. Bak, Rep. Prog. Phys.45, 587 (1982).
31 M. Tinkham,Introduction to superconductivity
(McGraw-Hill, Inc., New York, 1996).
32 A. I. Larkin and Y. N. Ovchinnikov, J. Low. Temp. Phys.
34, 409 (1979).
33 V. M. Vinokur and A. E. Koshelev, Sov. Phys. JETP70,
34 H. Fukuyama and P. A. Lee, Phys. Rev. B17, 535 (1978).
35 Y. Imry and S. Ma, Phys. Rev. Lett.35, 1399 (1975).
36 P. B. Littlewood and T. M. Rice, Phys. Rev. Lett.48, 44
(1982).
37 Y. Yoon, L. Tiemann, S. Schmult, W. Dietsche, K. von
Kl-itzing, and W. Wegscheider, Phys. Rev. Lett.104, 116802 (2010).