Energetics of discrete selectivity bands and mutation-induced transitions in the calcium-sodium
ion channels family
I. Kaufman,1D. G. Luchinsky,1,2R. Tindjong,1P. V. E. McClintock,1,*and R. S. Eisenberg3 1Department of Physics, Lancaster University, Lancaster LA1 4YB, United Kingdom
2Mission Critical Technologies Inc., 2041 Rosecrans Ave. Suite 225 El Segundo, California 90245, USA
3Department of Molecular Biophysics and Physiology, Rush Medical College, 1750 West Harrison, Chicago, Illinois 60612, USA (Received 8 May 2013; published 19 November 2013)
We use Brownian dynamics (BD) simulations to study the ionic conduction and valence selectivity of a generic electrostatic model of a biological ion channel as functions of the fixed chargeQf at its selectivity filter. We are thus able to reconcile the discrete calcium conduction bands recently revealed in our BD simulations, M0 (Qf =1e), M1 (3e), M2 (5e), with a set of sodium conduction bands L0 (0.5e), L1 (1.5e), thereby obtaining a completed pattern of conduction and selectivity bands vsQf for the sodium-calcium channels family. An increase of Qf leads to an increase of calcium selectivity: L0 (sodium-selective, nonblocking channel)→ M0 (nonselective channel) →L1 (sodium-selective channel with divalent block) →M1 (calcium-selective channel exhibiting the anomalous mole fraction effect). We create a consistent identification scheme where the L0 band is putatively identified with the eukaryotic sodium channel The scheme created is able to account for the experimentally observed mutation-induced transformations between nonselective channels, sodium-selective channels, and calcium-sodium-selective channels, which we interpret as transitions between different rows of the identification table. By considering the potential energy changes during permeation, we show explicitly that the multi-ion conduction bands of calcium and sodium channels arise as the result of resonant barrierless conduction. The pattern of periodic conduction bands is explained on the basis of sequential neutralization taking account of self-energy, asQf(z,i)=ze(1/2+i), whereiis the order of the band andzis the valence of the ion. Our results confirm the crucial influence of electrostatic interactions on conduction and on the Ca2+/Na+valence selectivity of calcium and sodium ion channels. The model and results could be also applicable to biomimetic nanopores with charged walls.
DOI:10.1103/PhysRevE.88.052712 PACS number(s): 87.16.Vy, 41.20.Cv, 05.40.−a, 87.10.Mn I. INTRODUCTION
At the molecular level, an understanding of living systems requires the application of physics and this is particularly true in the case of biological ion channels. Here, we study the physics of a simple electrostatic model to investigate the operation of voltage-gated calcium and sodium ion channels. Their importance stems from their essential roles in controlling muscle contraction, neurotransmitter secretion, gene regulation, and the transmission of action potentials. The effective function of calcium channels is based on their high selectivity for divalent calcium ions Ca2+ over monovalent sodium ions Na+. They exhibit the anomalous mole fraction effect (AMFE), an effective blockade of Na+ permeation by small concentrations of Ca2+, combined with measurable Ca2+ currents in the pA range [1,2]. Sodium channels have very similar structure but demonstrate the opposite kind of selectivity, favoring Na+over Ca2+.
The selectivity of calcium and sodium channels is defined by a narrow selectivity filter with a strong binding site. The latter is formed of protein residues with a net negative fixed chargeQf whose magnitude depends on the particular
Published by the American Physical Society under the terms of the
Creative Commons Attribution 3.0 License. Further distribution of this work must maintain attribution to the author(s) and the published article’s title, journal citation, and DOI.
residues [75] that are present. The L-type calcium channel has a highly conserved EEEE locus with four glutamates [3], whereas the RyR channel has a DDDD locus [4]. The DDDD locus was also found in the TRPV6 transient receptor potential channel, which is highly calcium selective but generally very different from the RyR channel [5].
Although sodium and calcium channels have similar struc-tures, they have different selectivity filter loci (and therefore differentQf), and have different lengths and radii [6–8]. The eukaryotic sodium channel has two charged rings at or near the selectivity filter: an inner DEKA ring with a nominalQf =1e
and an outer EEDD ring with nominalQf =4e[6,8,9] where
e= −1.6×10⁻¹⁹C is the electronic charge. Bacterial sodium channels can have rather different selectivity filter loci and represent L-type-like EEEE locus in the NaChBac and recently studied NavAb channel [7,10].
Experimental studies of mutations in the protein side chains [11–19], and model simulations [8,20,21], show that the value ofQfis a crucial factor in determining the divalent (Ca2+
Na+ current with a strongly increased sensitivity to 1 mM Ca2+ [18]. Simulations [8] have indicated growth of Ca2+vs Na+selectivity asQf increases from 1eto 4e.
The mechanisms of Ca2+/Na+selectivity underlying these transformations have remained unclear, as has also the unambiguous identification of the “charge-selectivity type” relationship.
Multi-ion knock-on barrierless conductivity [76] is assumed to be one of the main mechanisms of permeation and selectivity for the potassium [23,24] and calcium [25,26] channels, and is inferred to be a general mechanism of selectivity [27]. Barrierless knock-on conductivity can also be described as a limiting case of long-range ion-ion correlations [28,29].
Generic electrostatic models describe an ion channel as a cylindrical water-filled hole in a charged protein in the cell membrane [30–32]. They usually assume single-file motion of the permeating ions and can reproduce significant features related to the conductivity and selectivity [33–37]. Thus a single model with almost unchanging parameters can account for the valence selectivity features of both sodium and calcium channels (reviewed in Refs. [38,39]). An analytic treatment of such a model [35,40,41] showed that transport of Ca2+ ions through a negatively doped channel exhibited several ion-exchange phase transitions as functions of bulk concentration andQf, with a near-zero transport barrier at the transition
points [41]. Brownian dynamics (BD) simulations of an L-type calcium channel revealed a narrow peak in Ca2+conductance near Qf =3.2e [42]. Discrete multi-ion conduction peaks
were predicted in Ref. [36]. The possibility that channel conduction might be a discontinuous function of channel parameters with pass bands and stop bands had been discussed at length in the speculations of one of us, long ago [43].
We have recently used parametric Brownian dynamics (BD) simulations of ionic currents for different Qf in a generic model of calcium channels to show that the Ca2+conduction and Ca2+/Na+ valence selectivity form a regular pattern of narrow conduction and selectivity bands as a function of
Qf, separated by regions of nonconduction. These discrete bands relate to saturated, self-sustained Ca2+ conductivity with different numbers of ions involved in the conduction; they correspond to the phase transitions obtained analytically in Ref. [41] and are consistent with earlier results [36,42]. We have associated the underlying mechanism with multi-ion barrierless conductivity, identified the calcium selective bands seen in the simulations with known calcium channels, and inferred that the band structure could explain the results of mutant studies [44,45].
We also investigate the energetics of the generic elec-trostatic model and consider potential energy profiles along optimal multi-ion stochastic trajectories [36,46] to show that the calcium and sodium conduction and selectivity bands are based on the barrierless conduction mechanism [47].
In this paper we complete the ordered sequence of Ca2+/Na+conductivity and selectivity bands vs surface charge
Qf for the sodium-calcium channels family, initiated in Ref. [44]. We add an analysis of sodium bands and construct an identification table to explain and classify numerous mutation-induced transformations of Ca2+/Na+selectivity in the calcium-sodium channels family.
We start by summarizing in Sec.IIthe main features of the generic model. In Sec.III Awe describe the ordered sequence of selectivity types for the sodium-calcium family of channels based on BD simulations of the model [44]. We relate these data to real ion channels in Sec.III Band to mutation-induced transformations between them in Sec. III C. In Secs. III D andIII Ewe work out the energetics of permeation and show how the observed bands correspond to optimal conditions (minimal energy barrier) for one-ion and two-ion processes respectively. In Sec. IV we discuss the patterns of bands for different ions that result from a neutralization approach. Finally, in Sec.Vwe summarize and draw conclusions.
II. GENERIC ELECTROSTATIC MODEL OF CALCIUM CHANNELS A. Geometry and general features of the model Figure 1 shows the generic, self-consistent, electrostatic model of a calcium or sodium channel. We focus exclusively on its selectivity filter, which we consider as a negatively charged, axisymmetric, water-filled, cylindrical pore of radiusR =3 ˚A and length L=12−16 ˚A through the protein hub in the cellular membrane Thex axis is coincident with the channel axis and x=0 in the center of channel. There is a centrally placed, uniformly charged, rigid ring of negative charge
Qf =0−6.5eembedded in the wall at RQ=R. The left-hand bath, modeling the extracellular space, contains nonzero concentrations of Ca2+ and/or Na+ ions. In the simulation,
Na+ Ca2+
Qf
Membrane protein L
Left bath, CL>0
Right bath, CR=0 R
X Ra
Charged ring at x=0
FIG. 1. (Color online) Computational domain for a generic model of the calcium ion channel (reworked from Ref. [44]). Its selectivity filter is treated as an axisymmetric, water-filled, cylindrical hole of radiusR=3 ˚A and lengthL=12−16 ˚A through the protein hub in the cellular membrane. The x axis is coincident with the channel axis and x=0 in the middle of the channel. There is a centrally placed, uniformly charged, rigid ring of negative charge Qf=0−6.5eembedded in the wall atRQ=R. The left-hand bath, modeling the extracellular space, contains nonzero concentrations of Ca2+or Na+ions. These are injected on the axis at the Smoluchowski
these are injected on the axis at the Smoluchowski diffusion rate at a distanceRa from the channel entrance. The domain lengthLd =100 ˚A, the domain radiusRd =100 ˚A, the grid sizeh=0.5 ˚A, and a potential difference in the range 0–75 mV is applied between the left and right domain boundaries.
This generic model of a calcium ion channel is similar to that used previously [42,48,49]. Details of the model have already been presented and its validity and limitations discussed [44], but for completeness we now summarize and give some additional details and discussion.
The minimum possible radius R of the selectivity filter of an L-type calcium channel has been determined as being
R=2.8 ˚A. We use the value ofR=3.0 ˚A. The mobile sodium and calcium ions are described as charged spheres of radius
Ri ≈1 ˚A (matching both ions), with diffusion coefficients
of DN a=1.17×10⁻⁹ m2/s andDCa =0.79×10⁻⁹ m2/s,
respectively. In what follows we assume an asymmetrical ionic concentration:CL>0 on the left, andCR=0 on the right, corresponding to the physiological conditions in calcium and sodium channels.
We take both the water and the protein to be homogeneous continua with dielectric constantsεw=80 andεp =2,
respec-tively, together with an implicit model of ion hydration (the validity of which is discussed elsewhere). We approximate
εw andDas equal to their bulk values throughout the whole computational domain, including the selectivity filter, a choice that avoids the use of arbitrary fitting parameters.
The importance of self-consistent calculations cannot be overstated. If calculations are not self-consistent, then the potential does not take proper account of all the charges that are present. Thus, some of the potential then has a mysterious nonphysical origin. In the real world, and in experiments, conditions and concentrations change. Consistent calculations determine and follow the potential that results from these changes [39].
Our simulation scheme could be described as a self-consistent numerical solution of Poisson’s electrostatic equa-tion coupled with the Langevin stochastic equaequa-tion for the moving ions.
B. Self-consistent electrostatics for generic ion channel geometry
The electrostatic potentialU for an ion and the potential gradients were derived by numerical solution of Poisson’s equation within the computational domain shown in Fig.1:
−∇(ε0ε∇U)=ρ0+
i
ezini, (1)
where ε0 is the dielectric permittivity of vacuum, ε is the dielectric permittivity of the medium (water or protein),ρ0is the density of fixed charge,ziis the charge number (valence),
and ni is the number density of moving ions. We used an axisymmetric finite-volume Poisson solver with a staggered grid, specially designed to accommodate the large permittivity mismatch [50,51] at the water-protein interface.
We utilized field linearity and the superposition rule to speed up the run-time calculations. The potential U and electrostatic field E were precalculated for all axial ion
positions on the grid and saved in lookup tables that were using during run time for quick recovery of the relevantUand
Evalues [52]. In doing so, full account was taken of the static charge, interactions, and self-energy contributions.
Self-consistent electrostatics within the narrow, water-filled channel in the protein differs significantly from bulk electrostatics, even when the dielectric constant of the water inside the channel is taken to be the same as in the bulk. The huge gradient betweenεw=80 andεp=2, and the specific channel geometry, lead to a number of effects that are crucial for ion permeation through the channel [32,53], as illustrated in Fig.2.
Figure2(a)shows that the boundary conditions at the water-protein interface almost eliminate the radial componentErof the electrostatic field in comparison with the axial component
Ex. ThusEr Ex. It is this condition that results in a
quasi-1D axial behavior of the electrostatic field (constantEx due to a linear variation inU between the charges), and hence in preferentially axial motion of ions inside the channel [32,35], which behave like a one-dimensional Coulomb gas [40].
Figure 2(b) demonstrates electrostatic amplification of the electric field inside the narrow channel due to partial descreening of the electrostatic field and the appearance of polarization charges at the water-protein boundary, which is what results in the quasi-1D field behavior [31,35,54].
Figure 2(c) illustrates a remarkable feature of the chan-nel geometry that strongly influences permeation: the high axial self-energy barrier Us corresponding to the dielectric boundary force. It amounts to an electrostatic contribution to the free energy barrier and thus adds to the dehydration barrier [32,55]. This barrier prevents any ion from entering an empty uncharged channel: an ion in bulk is repelled from the boundary with the protein. The electrostatic component of the barrier is independent of the ionic radius [33] and, as we will see below, it can help to account for valence selectivity. Incorporating of more advanced hydration models [56] could provide alike selectivity as well.
Figure 2(d)shows the radial self-energy potential profile
Ur, representing a potential well centered on the channel axis. Hence an ion inside the channel experiences a radial force towards the axis. The existence of this force helps to justify the conventional approximation of strictly axial single-file movement of ions inside the narrow channel [32,35].
The electrostatics of an empty ion channel prohibits the entry of any negatively charged (e.g., chloride) ion due to combined influences of the dielectric boundary force and the repulsion of the fixed negative charge [33,53]. For this reason we take no account of counterions in the electrostatics and BD simulations. When the channel is occupied by cations, however, it becomes easier for anions to enter.
Consequently, we use a 1D dynamical model to simulate the axial single-file movement of cations (only) inside the selectivity filter and in its close vicinity. Some additional discussion of these approximations is provided in Sec.II D.
0 8 16 0
1 2 3 4 5
x(˚A)
eU
s
/
kB
T
0 1 2 3
0 1 2 3 4 5
r(˚A)
eU
r
/
kB
T
0 8 16
0 5 10 15 20 25 30
x(˚A)
eU
/
kB
T
x(˚A)
r
(˚
A
)
0 2 4 6 8 10
2 4 6 8 10
0 5 10 15 20 (a)
(d) (b)
(c)
FIG. 2. (Color online) Polarization effects in the generic model of ion channel. (a) Electrostatic potential mapU(x,r) for zero membrane potential and centered monovalent cation inside the selectivity filter, whose spatial limits are indicated y the white lines. Color bar is in units of kBT /e, contour step is 1 in the same units. The equipotential lines are almost equally spaced and almost perpendicular to thexaxis, illustrating the quasi-1D behavior of the electrostatic field. (b) Electrostatic amplification of the electrostatic field inside the channel: the potentialUof a monovalent ion within the channel (blue, full curve) significantly exceeds the corresponding potential in bulk water (red, dashed)U0due to induced polarization charge that appears at the water-protein interface. (c) The axial self-energy potentialUs accounts for the dielectric contribution to the hydration barrier. (d) the radial self-energyUrprovides a stable point in the center of the channel cross section, atr=0.
ith ion:
dx
dt = −Dz
∂U ∂x
+√2Dξ(t), (2)
whereDis the ionic diffusion coefficient,ξ(t) is normalized white noise, z is the valence of the ion, and the potential
U(x) is given in (kBT /e) units where T is the temperature andkB is Boltzmann’s constant. Numerical solution of (2) was implemented with the Euler forward scheme. Poisson’s equation(1)is solved self-consistently at each simulation step as described above.
We use an ion injection scheme that allows us to avoid wasteful and heavy-duty simulation of ionic movements in the bulk liquid. The model includes a hemisphere of radiusRa =R at each entrance representing the boundaries between the channel vicinity and the baths. The arrival rate
jarr is connected to the bulk concentration C through the Smoluchowski diffusion rate:jarr=2π DRaC[33,54,57].
We model the ions as “transparent” in the sense that they can, in principle, pass each other. However, this is unlikely to happen. This simplification is based on the momentum conservation law for alike ions and also because quasi-1D electrostatic repulsion amplified by the narrow channel is strong enough to effectively prevent ions (whether alike or different) from coming close. Thus the assumption of single-file behavior is a good approximation (see details in the next section).
The motion of each injected ion is simulated in accordance with (1) until it reaches a domain boundary, where it is assumed to be absorbed. The simulation continues until a chosen simulation time has been reached. The ionic currentJ
is calculated as the averaged difference between the numbers of similar ions passing the central cross section of the channel per second in the forward and reverse directions [27].
Quantities measured during the simulations include the sodium JN a and calciumJCa ion currents, the partial ionic
occupancy profilesρ(x) alongx for different concentrations, and the partial PN a and PCa occupancies, in each case as functions of the respective concentrations of calcium [Ca] or sodium [Na].
The BD simulations of ion current J and occupancy P
were performed separately for CaCl2and NaCl solutions, and also for a mixed-salt configuration, with concentrations [Na]= 30 mM and 20μM [Ca]80 mM. The value ofQf was varied within the range 0–6.5e in order to cover the known variants of sodium and calcium channels [8].
D. Validity and limitations of generic model
Our reduced model obviously represents a considerable simplification of the actual electrostatics and dynamics of moving ions and water molecules within the narrow selectivity filter [58,59]. We now discuss briefly the main simplifications limiting its validity: the use of continuum electrostatics; the use of BD; and the assumption of 1D (i.e., single-file) movement of ions inside the selectivity filter.
The validity of both the electrostatics and the dynamics depends on the degree of dehydration of the ion inside the channel, so it can be defined roughly by the relationship between the channel radiusRand the radius of the ions first hydration shell Rh. Continuum electrostatics and dynamics
generally fail whenRh> R, but still can be applied forRh≈R
provided that one uses effective values ofεwand the diffusion coefficientsDN a,DCathat are all dependent onR[31].
[image:4.608.67.544.73.260.2]approximation with effective values can be used inside the selectivity filter. It is shown in Ref. [31] that the effective value ofεwsaturates to its bulk valueεw=80 forR≈3.5 ˚A (roughly corresponding toRh) and is still close to it (εw≈70) forR=3 ˚A. This allows us to use the bulk value forεw. The
effective values of the ionic diffusion coefficients also decrease significantly with decreasingRcompared to their bulk values, and are estimated asD≈0.25Dbulk forR =3 ˚A [58]. As a result we can assume that in our channel model both ions move along the axis with almost unbroken first hydration shells.
We therefore use the standard bulk values of εw=80,
εp =2, and D as effective values throughout the whole computational domain, including the selectivity filter, a choice that avoids the use of additional fitting parameters.
The single-file condition can become a significant re-striction if multiple ions are occupying the channel. In our model, however, single-file movement appears not as an
a priori assumption but as the outcome of the Langevin dynamics of movement under electrostatic forces in a confined environment. Thus single filing of ions within the selectivity filter of the calcium channel is provided, not by direct geometrical restrictions, but by the combined effect of the above-mentioned self-repulsion from the channel wall together with strong mutual electrostatic repulsion between the moving ions. The minimum spatial separation between their centers needed for Ca2+or Na+ions to pass each other isd
min=2 ˚A, with a maximum possible passing distance of dmax=4 ˚A within the 6 ˚A diameter channel. Even for monovalent ions
dmax is shorter than the Bjerrum length lB defined as the average distance for the thermal separation of charged ions [U(lB)=kBT]: for waterlB ≈7 ˚A is almost 2dmax and thus the probability of ions passing each other is low, especially taking into account the additional force due to self-repulsion from the wall. In the most significant Ca2+-Na+ “blockade” we can estimate the total energy barrier impeding leakage as being≈6kBT, which is high enough to justify our assumption
of single-file movement.
As noted above in Sec. II B, a shortcoming of the model is that, although it treats sodium and calcium ions explicitly, it fails to include their counterions (chloride), either explicitly or implicitly, in the Poisson continuum treatment and BD simulations. We justify this simplification through consideration of the combined effects of the self-potential barrier and repulsion by the fixed charge, both of which tend to prevent counterions from entering the empty selectivity filter. The situation is different for an occupied channel, however, and in certain cases chloride ions will then be able to enter to neutralize the channel [41]. Nonetheless, experiments and simulations show that the concentration of chloride ions inside the channel is in practice reasonably small [60].
An important criterion for the applicability of a channel model is its ability to reproduce AMFE and, in particular, low-offset calcium blockade of the sodium current for the L-type (EEEE) calcium channel. In real experiments, blockade can be seen for [Ca]50<1μM [2], and the same offset has been obtained in Monte Carlo simulations [21] and (indirectly) in BD simulations [42]. Our BD simulations yield a blockade offset of about [Ca]50 =40μM, which may be regarded as reasonable given the simplifications of the model.
The DEKA sodium channels, and mutants, might seem to stretch the generic model in that the ring of fixed charge is in reality fragmented around the pore (rather than being continuous), and is asymmetrical. However, it is known that the axial field of a fragmented ring is exactly the same as for a continuous ring due to the high symmetry of the protein segments [2]. Asymmetry of the DEKA ring is found to be significant for selectivity between alike ions [61]; here, however, we study valence selectivity, which depends mainly on thetotalcharge at the selectivity filter [18,21].
Generally, simulations based on simplified models [21,42,44] reproduce reasonably well the signatures of calcium channels, such as their AMFE [2]. Despite their simplified nature, models of this sort can account quantitatively for the detailed properties of the RyR channel and have enabled the prediction of complex current-voltage relationships in advance of the corresponding experiments, with errors of less than 10% [4].
To summarize, the model is generic in the sense that it is just based on electrostatics and on the fundamental physical properties of channels of simplified geometrical shape. It takes no account of the detailed structure of the proteins or residues, and it treats water and protein as continuum dielectrics with their bulk dielectric constants. It could equally well be applied to, e.g., TPRV channels [5] and, because there is nothing inherently “biological” about it, the model should also be applicable to biomimetic nanotubes [62,63] and other artificial pores.
III. RESULTS AND DISCUSSION A. Pattern of calcium and sodium conduction
and selectivity bands
Figures 3 and 4 present results derived from Brownian dynamics simulations of permeation of the generic channel
0 5 10
J
(
10
7/s
)
0 1 2 3 4 5 6
0 2
Qf/e
P
20mM 40mM 80mM
M0 M1 M2
(b) (a)
0 10 20
J
(
10
7/s
)
0 1 2 3 4 5 6
0 2 4
Qf/e
P
20mM 40mM 80mM (b)
(a) L0 L1 L2
FIG. 4. (Color online) BD simulations showing sodium conduc-tion and occupancy bands of the generic ion channel model. (a) Plots of the sodium ionic currentJ as a function of the fixed chargeQf at the selectivity filter for a pure sodium bath of different concentration [Na] (20, 40 and 80 mM as indicated) show broadened conduction bands L0, L1, and L2 for which there are respectively zero, one, or two calcium ions trapped saturately at the selectivity filter. (b) The broad conduction peaks still correspond to transitions of occupancy P between these saturated levels.
model by calcium and sodium ions in pure baths of different concentration.
Figure3(a)shows the pronounced regular structure in the Ca2+ ion currentJCa as a function ofQf for different Ca2+ concentrations [Ca]. The structure consists of narrow regions of high conductance (conduction bands)M0≈1e,M1≈3e, and M2≈3e separated by almost zero-conductance stop-bands. The peak separation Q≈2e corresponds to the charge on one Ca2+ ion. As shown in Fig.3(b), the peaks inJcorrespond to transition regions in the channel occupancy
P, whereP jumps from one saturated integer value to the next one, while zero-conductance bands correspond to regions of constant integerP. The calcium conduction bands correspond to the ion-exchange low-barrier phase transitions obtained analytically in Ref. [41].
Comparison of theJ andP plots shows that conduction occurs at odd integer values ofQf/(ze), corresponding to non-zero instantaneous total charge of the selectivity filter , whereas the nonconducting regions of constantP correspond to even integer values ofQf/(ze), i.e., to the neutralized state. The neutralization approach will be further discussed in Sec.IV.
Figure 4 plots the equivalent results for [Fig. 4(a)] the sodium current and [Fig. 4(b)] the occupancy as functions ofQf in a pure NaCl bath with different concentrations. The
currentJN aexhibits weak local maxima that would appear to
be analogous to the calcium conduction bands in Fig. 3(a). We label them as L0, L1, L2, corresponding to the integer sodium occupancyPN a=0,1,2 of the selectivity filter; these broad bands overlap and never fall to zero, making the sodium conductance relatively independent ofQf. The separations of
the L-band maxima are half the size of those in the calcium M-bands, reflecting the charge difference between Na+ and Ca2+ions.
Values of maximal sodium and calcium currents are about 5–10 ×107s−1(10–20 pA), corresponding roughly to the currents observed experimentally in sodium and calcium channels under physiological conditions [2,9].
104 106 108
JNa
(
1
/
s
)
104 106 108
JCa
(
1
/
s
)
0 1 2 3 4 5 6
10−2 100 102
Qf/e
S
(b) (a)
(c)
FIG. 5. (Color online) BD simulations showing conduction and selectivity of the generic ion channel model in mixed and pure baths (partly reworked from Ref. [44]). Note the logarithmic ordinate scale. (a) The calcium currentJCaas a function of the fixed chargeQfat the selectivity filter in the mixed bath (blue point down triangles) shows significant attenuation for bands M1 and M2 as compared with the pure bath (red point-up triangles). (b) The sodium currentJN aas a function ofQfin the mixed bath (blue point-down triangles) exhibits progressive blockage by calcium as compared to the pure bath (red point-up triangles). (c) A plot of the selectivity ratioS=JCa/JN a for the mixed bath shows growth of selectivity forQf above L0 and strong peaks corresponding to the M1 and M2 calcium bands.
The appearance of the distinct conduction bands are at-tributable to ion-ion and ion-fixed charge electrostatic interac-tion and the discreteness of the multi-ion occupancyP [27,36]. They are particularly well defined for Ca2+ in the calcium channel on account of the double-valence of Ca2+, which enhances the electrostatic effects of valence selectivity [34]. It will be shown explicitly below (see Secs.III DandIII E) that both the calcium and sodium conduction bands correspond to resonancelike barrierless conduction.
The different positions of the conduction and forbidden bands for ions of different valence (in pure baths) provide a basis for valence selectivity in a mixed bath. Figure5shows the transformations in the conduction bands that occur in a mixed bath ([Ca]=40 mM, [Na]=30 mM). It is evident in Fig.5(a)that the calcium conduction and stop bands bands persist, although bands M1 and M2 are significantly attenuated in the mixed salt as compared to the pure one.
Figure 5(b)makes clear that the sodium current exhibits a persistent block forQf >M0 that intensifies progressively until the beginning of M1. This strong progressive blockade of the sodium current can be accounted for by the increase in the depth of the potential well (which is linear inQf) and the consequent exponential decrease of the escape rate of the blocking Ca2+ions.
Figure5(c)plots the selectivity ratioS=JCa/JN ashowing
[image:6.608.70.273.72.209.2] [image:6.608.331.537.74.220.2]Fig.5(a)]. They correspond to the thresholds of the transitions inP.
B. Identification of selectivity bands in the calcium or sodium channels family
We now try to relate the observed charge-ordered sequence of conduction and selectivity bands shown in Fig. 5 to the behavior exhibited by real channels in experiments. Calcium and sodium conduction and stop bands divide theQf axis
into a number of distinct regions differentiated by the type of Ca2+/Na+ selectivity, i.e., by combination of four features: the Na+ conductivity for a pure bath; the Ca2+ conductivity for a pure bath; the existence and power of the divalent block; and the AMFE (i.e., calcium-selective current), for the mixed salt bath. Combining these features we can find several clearly differentiatedQfregions with distinct selectivity types related to particular channels including wild-type, mutants, and artificial.
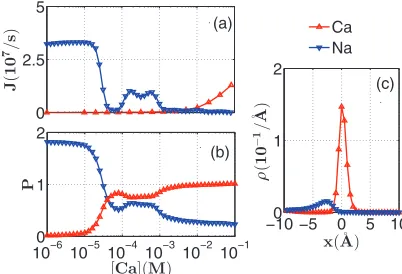
Figure6(a)shows that the band L0 (Qf ≈0.5e) demon-strates moderate sodium conductivity and near-zero calcium conductivity in a mixed bath (as in the pure baths), and that there is no divalent block or AMFE [plots (a), (b)]. The near-zero PCa shown in Fig. 6(b) is because calcium ions cannot overcome the self-potential barrier in order to enter the channel, as illustrated by the occupancy plot in Fig.6(c). The results are almost independent of [Ca]. Thus L0 represents a nonblocking sodium-selective channel. We infer that this band is associated with the bacterial sodium NaChBac channel [17], which exhibits a similar type of selectivity; the same connection was also proposed recently by Corry [61]. We can connect the L0 band with the DEKA inner ring of the mammalian Navsodium channel [6,9].
Figure7 shows that the M0 channel (Qf ≈1e) exhibits nonselective conduction and occupancy for both sodium and calcium [plots (a), (b)], and nonselective time-sharing
10−6 10−5 10−4 10−3 10−2 10−1 0
0.02 0.04
[Ca](M)
P
0 1 2 3
J
(
10
7/s
)
−10 −50 0 5 10 2
4 6
x(˚A)
(
10
−
3˚/A
)
Na Ca
(c)
(b) (a)
Ρ
FIG. 6. (Color online) Band L0. BD simulations showing conduc-tion and occupancy in a mixed salt bath with Na+(blue, point-down, triangles) and Ca2+(red, point-up, triangles); the lines are guides to
the eye. (a) Sodium and calcium currentsJand (b) occupanciesPvs the Ca2+concentration [Ca] for [Na]=30 mM. L0 shows moderate
sodium conductivity without the divalent block corresponding to AMFE. (c) Mutual occupancy profiles for Na+(blue peaked curve) and Ca2+ions (red monotonic curve) show that the Ca2+ion cannot enter the channel.
100−610−510−410−310−210−1
0.1 0.2
[Ca](M)
P
0 2 4
J
(
10
7/s
)
−10 −50 0 5 10
1 2
x(˚A)
(
10
−
2˚/A
)
Ca Na
(c)
(b) (a)
Ρ
FIG. 7. (Color online) The nonselective band M0. BD simulations showing conduction and occupancy in a mixed salt bath with Na+ (blue, point-down, triangles) and Ca2+(red, point-up, triangles); the
lines are guides to the eye. (a) Sodium and calcium currentsJand (b) occupanciesP vs Ca2+concentration [Ca] for [Na]=30 mM. M0
shows nonselective currents both in pure and mixed baths. (c) Mutual occupancy profiles for Na+and Ca2+ions show an absence of any
blockade of Na+ions by the Ca2+ions, and a time-shared occupancy
mode.
mutual occupancy profiles [Fig. 7(c)] and thus represents a nonselective cation channel. It may be identified with the nonselective cation channel described in Ref. [64] or the OmpF channel [18]. The high calciumJ corresponds to barrierless conductivity for Ca2+(see Sec.III E).
Results for the double-occupied sodium band L1 (Qf ≈
1.5−2.0e) are plotted in Fig. 8. As shown in Figs. 8(a) and8(b), this band exhibits high conductivity for pure sodium, zero conductivity for pure calcium, and blockade of the sodium current by calcium. Onset of the blockade occurs at [Ca]50≈1 mM after the first Ca2+ ion has occupied the selectivity filter: PCa→1. The mutual occupancy profiles
for Na+ and Ca2+ shown in Fig. 8(c) demonstrate full
10−610−510−410−310−210−1
0 1 2
[Ca](M)
P
0 2 4 0
J
(
10
7/s
)
−10 −50 0 5 10
1 2
x(˚A)
(
10
−
1˚/A
)
Ca Na
(b) (a)
(c)
Ρ
FIG. 8. (Color online) The sodium-selective band L1. BD simu-lations showing conduction and occupancy in a mixed salt bath with Na+(blue, point-down, triangles) and Ca2+(red, point-up, triangles);
the lines are guides to the eye. (a) Sodium and calcium currentsJand (b) occupanciesPvs Ca2+concentration [Ca] for [Na]=30 mM. L1
shows strong blockade without AMFE atPCa=1 with a threshold of [Ca]50≈1 mM. (c) Mutual occupancy profiles for Na+and Ca2+
[image:7.608.328.542.74.223.2] [image:7.608.65.278.503.649.2] [image:7.608.330.536.512.652.2]10−6 10−5 10−410−310−2 10−1 0
1 2
[Ca](M)
P
0 2.5 5
J
(
10
7/s
)
−10 −50 0 5 10
1 2
x(˚A)
(
10
−
1˚/A
)
Ca Na
(c)
(b) (a)
Ρ
FIG. 9. (Color online) BD simulations showing AMFE in a mixed salt bath for the M1 calcium channel (reworked from [44]) with Na+ (blue, point-down, triangles) and Ca2+(red, point-up, triangles); the
lines are guides to the eye. (a) Sodium and calcium currentsJ and (b) occupanciesPvs the Ca2+concentration [Ca] for [Na]=30 mM.
M1 shows strong blockade and AMFE atPCa=1, with a threshold of [Ca]50≈ 30μM. (c) Mutual occupancy profiles for Na+and Ca2+
show blockade of Na+ions by one Ca2+ion.
substitution of Na+ ions by the first Ca2+ ion. It is thus a sodium-selective channel that is subject to divalent block. This kind of selectivity corresponds to the wild-type mammalian sodium channel [1,12] and it relates to an outer EEDD ring of residues [6,9], similar to the four-glutamate ring discovered in the bacterial NavAb channel.
The narrow calcium selectivity peaks M1 (Qf ≈3e) and M2 (Qf ≈5e) [Fig. 5(c)] exhibit highly nonselective conductivity in a pure bath, and strong divalent blockage of sodium, followed by AMFE. This kind of selectivity is a trade-mark of calcium channels [2] identified with the wild-type L-type and RyR calcium channels, respectively [44]. Figure9presents the dependences ofJandPon [Ca] for the M1 band in a mixed salt configuration. As shown in Figs.9(a) and 9(b), M1 shows a strong blockade of the current JN a
of Na+ ions with its onset at [Ca]50≈30μM. The blockade occurs after the first Ca2+ion has occupied the selectivity filter:
PCa →1 as shown in Fig.9(b). The mutual occupancy profiles for Na+ and Ca2+ shown in Fig.9(c)also indicate blockade of Na+ions by the first Ca2+ion. This is a calcium-selective channel with single-ion calcium block. Strong blockade with a relatively low onset agrees qualitatively with the observed properties of the L-type channel [2]. The value of Qf, and the conduction mechanism for M1, also correspond to the model [42] of the L-type channel (EEEE locus).
Figure10provides similar information for the M2 band, again in a mixed salt configuration. As shown in Figs.10(a) and 10(b), there is a strong blockade of the current JN a
of Na+ ions with its onset at [Ca]50≈150μM after two Ca2+ ions have occupied the selectivity filter: P
Ca →2.
This is a calcium-selective channel with double-ion calcium block. The divalent blockade with a relatively high onset and strong calcium current agrees qualitatively with the observed properties of the RyR calcium channel [4] and with the TPRV6 channel [5].
We thus arrive at the full identification scheme presented in TableI; it represents a completed version of the partial table in Ref. [44].
10−610−510−4 10−310−210−1
0 1 2 3
[Ca](M)
P
0 2 4
J
(
10
7/s
)
−10 −50 0 5 10
1 2 3
x(˚A)
(
10
−
1˚/A
)
Ca Na
(c) (a)
(b)
Ρ
FIG. 10. (Color online) AMFE in a mixed salt bath for the M2 channel (reworked from Ref. [44]) with Na+ (blue, point-down, triangles) and Ca2+ (red, point-up, triangles); the lines are guides
to the eye. (a) Sodium and calcium currentsJ and (b) occupancies P vs the Ca2+concentration [Ca]50for [Na]=30 mM. M2 shows
strong blockade and AMFE atPCa=1 with a threshold of [Ca]50≈ 150μM. (c) Mutual occupancy profiles for Na+and Ca2+ions show
blockade of Na+ions by a pair of Ca2+ions.
Within the framework of our scheme, an increase of fixed negative charge at the selectivity filter leads to an increase of calcium selectivity with the strict sequence: L0 (sodium selective, nonblocking channel)→ M0 (nonselective cation channel)→L1 (sodium-selective channel with divalent block)
→ M1 (calcium-selective channel with divalent, blockade, AMFE). And vice versa, a decrease in the negative charge should change the selectivity from an L-type calcium channel to sodium, and from sodium to nonselective. The sodium L1 blocking channel holds an intermediate position in the
Qf spectrum between the nonselective M0 channel and the calcium-selective M1 channel. A similar increase of selectivity with increasingQf was obtained in Refs. [8,18] but without
the sharp selectivity peak at M1.
Comparison between the L1 and M1 conductivity-selectivity behavior shows a close similarity of their blockade mechanisms, but a significant difference between their calcium conductivities. Unlike the calcium-selective band M1, which exhibits narrow selectivity peaks, the sodium-selective band shows conduction or selectivity properties over a relatively wide range ofQfaround L1. This difference can be explained as being the result of barrierless Ca2+conductivity appearing in the narrow M1 band (see Sec.III D). In some sense, a sodium channel can be described as a suboptimal calcium channel: the Ca2+ion blocks the Na+current, but the Ca2+-Ca2+knock-on mechanism does not work.
[image:8.608.332.534.73.209.2] [image:8.608.69.270.74.211.2]TABLE I. Identification of conduction and selectivity bands of the model with known ion channels.
Conduction Pure salt bath Mixed salt bath
bands ≈Fixed charge (e) Na+current Ca2+current Blockade AMFE Channels Locus and nominal charge
L0 0.5 Moderate Low No No Nav sodium [1] DEKA(1e)
M0 1 Moderate Moderate No No Nonselective OmpF [18] RRRDE(2e)
L1 1.5–2.0 Low High Yes No NaChBac [17], NavAB [7] EEEE(4e)
M1 3 High High Yes Yes L-type calcium [2] EEEE(4e)
M2 5 High High Yes Yes RyR calcium [4] DDDD(ED)(6e)
charge, or to the elimination of particular residues. The scale based on our model is generally similar to that suggested in Refs. [8,18], albeit with different charges for some residues and channels.
Typically, the effective charge Qf in our model appears to be less than sum of the nominal charges of the residues assigned to the locus in question. Our simulations giveM1= 3e for conservative EEEE locus of L-type calcium channel (nominal charge 4e), and L0=0.5efor the DEKA locus of the Nav sodium channel (nominal charge 1e), in agreement with earlier BD simulation results for calcium and sodium channel [6,42].
These differences could be partially (and speculatively) related to possible difference in ionisation states of residues [65,66]. Multiple amino acids with carboxylate groups have to be placed in close proximity to establish the rings of high negative charge in the selectivity filters considered in the model; protonation at neutral pH would either reduce the effec-tive charge on the residues [65,66] or leave them unchanged. Mutant studies with residues eliminated confirm that there is significant protonation of the ring of glutamates [2].
Our computation of the effective fixed charge might also be misleading in some cases, because the model includes only the fixed charge of the filter locus (the ring). For instance, the assignation of effective charges to the RyR DDDD locus takes no account of the fact that the pore of the RyR channel is lined by a total of 20 negatively charged residues, not only by the D4899 charges of the fourαsubunits [4].
Thus the most obvious reason for differences between the conventional or accepted charges of residues and the band-derived values ofQf is the simplicity (and generality) of our model, and possible differences between the model parameters and the real channel structure parameters (which are sometimes unknown). Parametric studies of the model have shown reasonable robustness in the positions of the conduction bands to variations ofRandLin the selectivity filter, to the
width H of the charge ring and to the membrane potential
V [44]. However the model’s effective scale ofQf could be
affected by, e.g., the assumed hydration model and the assumed radius of the charged ring. The bands shift upwards in Qf
with hydration barrier growth and downwards with increasing radius of the charged ring. In this work, we do not use fitting procedures, and nor do we assume modified values for the charges on the residues. We just take theQf band values that
emerge as effective values related but not equal to the real charges.
Figure11compares the BD simulation results for divalent (calcium or barium) to monovalent (sodium) selectivitySCa= JCa/JN awith experimental dataSBa=JBa/JN a. Our generic
model predicts fast growth ofS from 0.01 for L0, to 100 for M1 (blue circles). The green open triangles are from mutation studies of the Cavchannel and its less-charged mutants (EEEE (4e) → EEEA (3e) → EEEK (2e) → EEKA (1e)). They demonstrate a clear dependence ofSBa=JBa/JN aonQf[13]
in agreement with the predictions of our model. Consequently we identified these channels with bands from M1 down to L0 (TableII).
Table IIlists the above-mentioned selectivity transitions, together with some other known mutation transformations, and their attributions within the framework of our model.
The recently investigated NALCN channel is a member of the family of ion channels with four homologous repeat domains that include voltage-gated calcium and sodium channels. NALCN appears in two variants with selectivity filter residues that resemble either calcium channels (EEEE) or sodium channels (EKEE or EEKE), controlled by a single gene [19]. We can tentatively identify the EEKE channel with the L1 band and EEEE with the M1 band. Reversible transformations between these states can be identified as L1
↔M1 transitions.
[image:9.608.47.559.653.748.2]An appropriate point mutation of the DEKA sodium channel (Qf ≈1e) converts it into a calcium-selective channel
TABLE II. Mutation-induced selectivity transitions in calcium and sodium ion channels.
Channel transformation Locus changes and nominal charges Band transition and charges Navsodium→calcium-selective [11] DEKA (1e)→DEEA(3e) L0(0.5e)→M1(3e) Cavcalcium→sodium-selective mutant [3] EEEE (4e)→DEDA (3e) M1 (3e)→L1 (1.5e) Cavcalcium→nonselective mutants→sodium- EEEE (4e)→EEEA(3e)→EEEK (2e)→EEKA (1e) M1→L1→M0→L0 selective mutant [13]
0 1 2 3 0.01
0.1 1 10 100
Qf/e
SCa
=
JCa
/
JNa
,
SBa
=
JBa
/
JNa
Cav, JBa/JNa
BD, J
Ca/JNa
M0 M1
L0 L1 L2
FIG. 11. (Color online) The mutation-induced increase of di-valent (calcium or barium) over monodi-valent (sodium) selectivity SCa=JCa/JN a,SBa=JBa/JN a: the BD simulations are compared with experiment. The generic model predicts fast growth ofSCafrom 0.01 for L0 to 100 for M1 (blue circles). The simulation results are in reasonable agreement with the experimental results forSBain Cav to sodium-selective mutants (green triangles, whereQf is scaled by M1) [13].
with a DEEA locus [11]. Our scheme identified this result with the L0 (Qf =0.5e)→M1 (Qf =3e) transition.
The essentially nonselective bacterial OmpF porin with its RRRDE locus can be converted into a Ca2+-selective channel by the introduction of two additional glutamates in the constriction zone; the resultant mutant contains a DEEE locus and exhibits an Na+ current with a strongly increased sensitivity to 1 mM Ca2+. Another OmpF mutant with formal net chargeQf =7edemonstrating weaker AMFE and smaller selectivity to Ca2+ was identified as an analog of the RyR channel [18]. We can identify this transformations with the M0 (Qf =1.0e)→M1 (Qf =3e)→M2 (Qf =5e) transitions.
Thus our identification scheme provides straightforward explanations for the outcomes of several mutant studies. Some results still seem to lie outside the scope of our model, e.g., the change of the ions’ permeation or selectivity properties by a simple permutation of the residues at the selectivity filter [12]. The calcium-selective M1 band exhibits a narrow reso-nancelike selectivity peak. We can conclude that any single mutation of the calcium channel that influences Qf should destroy its specific calcium selectivity. It corresponds well with the facts that the EEEE signature for the L-type channel is highly conserved [2] and that mutations in the genes responsible for this selectivity filter motif lead to numerous diseases [15].
The resonancelike nature of calcium selectivity is partic-ularly interesting in connection with the recently discovered NavAb sodium channel, which possesses the same EEEE locus as the calcium L-type channel but exhibits sodium-selective permeation behavior [7,10]. In the context of our model, this paradox could be explained in terms of a geometry difference (relatively small length of selectivity filter, or large radius), here we should bear in mind that the bands disappear when L decreases to 8 ˚A or R reaches to 4.5 ˚A [44], so that calcium selectivity could drastically decrease. Another plausible explanation relates to possible variations in the protonation of residues for different channels and therefore to slightly different effective charge for nominally the same loci [66–68]. Due to the narrowness of the calcium-selective M1 band even small changes of total charge could convert it to
40 20 0
−20 −40 0
1 2 −15
−10 −5 0 5 10
x(˚A)
Qf/e
E
/
kB
T
−30 −20 −10 0 10 20 30
−10 0 10
x(˚A)
E
/
kB
T
(a)
(b)
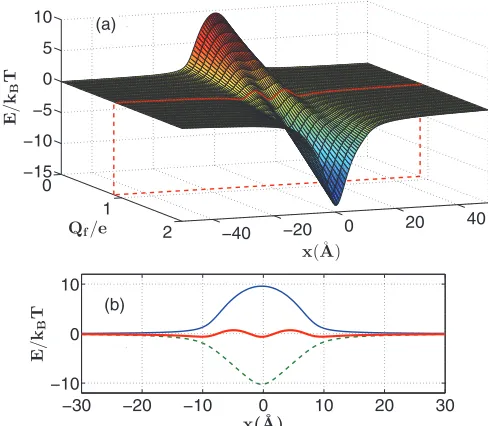
FIG. 12. (Color online) The appearance of a barrierless path for the channel M0. (a) The electrostatic potential energy profile along the channel’sxaxis is plotted vs the fixed chargeQf. The energy differences across the profile are minimal at a particular value of Qf=Qopt. (b) This optimal profile for permeation (red) appears as the result of a balance between repulsion by the dielectric boundary force (blue) and attraction to the fixed charge (green, dashed).
sodium channel. Clarification of these questions will require further experimental research and more detailed simulations.
D. Energetics of single-ion conduction and selectivity bands L0 and M0
We now investigate the energetics of calcium and sodium conductivity in our model, and show explicitly that a barri-erless permeation mechanism underlies the appearance of the conduction and selectivity bands.
Figure 12 shows that barrierless conductivity for cations of particular valence (the calcium M0 band is drawn) appears as the result of a balance between the self-repulsion of the dielectric boundary force and the electrostatically amplified attraction to the negative fixed charge. The self-repulsion is proportional toQ2i, whereas the attraction is proportional to
Qi×Qf. Thus a variation of Qf can significantly change the resultant profile. This kind of barrierless selectivity was suggested earlier for the Gramicidin channel [24,30,33].
Figure12(a)illustrates the fact that, for smallQf <M0, self-repulsion dominates and the channel is not permeable by any ion; and that, for large Qf (Qf >M0), attraction dominates and the ionic dynamics is then controlled by Kramers escape from a deep potential well, with an exponential dependence on its depth,E. Between these two extremes an optimal pointQopt (Qopt =0.9efor Ca2+ ions) exists where
E= |Emax−Emin|is minimized with the appearance of an almost barrierless (E∼kBT) profile for the moving ion. Sodium ions exhibit a similar pattern but with Qopt =0.45e
[image:10.608.87.256.75.188.2] [image:10.608.312.556.76.289.2]0 1 2
Qf/e
0 5 10 15
E
/
kB
T
0 1 2
0 0.5 1
Qf/e
J(
ar
b.
uni
ts
)
(c)
(b) (d)
(a)
M0 L0
FIG. 13. (Color online) Energetics and Brownian dynamics of the single-ion permeation in the sodium L0 and calcium M0 bands. (a) The L0 band potential energy vs the fixed chargeQf. The energy difference along the profile shows a clear minimum atQopt=0.45e. (b) The peak in the sodium current J vs Qf calculated from electrostatics (blue curve) lies relatively close to the BD-simulated L0 peak (green point-up triangles, detrended). (c) The M0 potential energy vs the fixed chargeQf. The energy difference along the profile show a sharp minimum atQopt=0.87e. (d) The peak in the calcium currentJvsQf calculated from electrostatics (blue curve) lies close to the BD-simulated M0 peak. (green point-up triangles).
Figure 12(b) shows that forQf =M0 the self-potential barrier of the dielectric boundary force is balanced by electrostatic attraction to the fixed charge Qf, resulting in a low barrier withE∼kBT.
To compare the results of electrostatic calculations and BD simulations, we introduce a simplified kinetic model that allows us to connect the energy difference along the energy profile with the currentJand occupancyP.
For a singly occupied channel, and assuming that there is no back flow, we get a linear dependence ofJ onP in the Kramers rate approximation :J =k0×P wherek0stands for the escape rate. Coulomb interactions between the ion inside the channel, and ions in the bath and at the mouth, causek0to be dependent on concentration [29,69] and so lead to deviations ofJfrom a linear dependence onP.
We assume the generalized Kramers equation fork0in the vicinity of M0 or L0:k0≈D/L2exp(−E/kBT) and get the resultant expression for the currentJ:
J =k0P ≈D/L2exp(−E/kBT)×P (3)
or, assuming thatP =const,
J =J0×exp(−E/kBT) (4)
whereJ0 is a reference current. We will use (4)to compare theJ(Qf) dependences obtained from electrostatics with the results of BD simulations.
Figure 13 compares the energetics and BD results for the singly occupied sodium L0 and calcium M0 bands. The electrostatically calculated dependences ofEonQf reveal
sharp minima [Fig. 13(a)] at Qopt =0.45e for the L0 and [Fig.13(c)] atQopt=0.9efor the M0. The calcium band M0
exhibits a sharperQf dependence because of the twice-larger charge on Ca2+.
Figures 13(b) and 13(d) compare the shapes and posi-tions of the electrostatically calculated conductivity peaks [J ∼J0exp(E/kBT)] with those obtained from the BD
simulations. Their positions are in reasonable agreement, although the BD simulated peaks are shifted towards higher
Qf, probably due to kinetic effects related to (3) and to the changing values ofP andk0. These results support our inference that the resonancelike L0 and M0 bands maxima are attributable to barrierless conduction. The conduction maximum for L0 shown in (b) is broadened towards higher
Qf due partly to its overlap with L1 and partly to the slower exponent inJ for sodium. It leads to nonselective conduction for M0, as discussed above.
E. Barrierless double-ion trajectories for conduction bands L1 and M1
The double-ion sodium selectivity band L1 is identified with the outer ring of the Nav sodium channel and with the NLCN sodium channel. The double-ion calcium band M1 is identified with the L-type calcium channel [42,44].
Multi-ion conductance appears when the selectivity filter potential well becomes too deep (about 60kBT for Ca2+
in the vicinity of M1) making the channel impermeable when occupied by just one ion. Instead, conduction events occur via a double-ion knock-on conduction mechanism. This mechanism is caused by the electrostatic interaction between simultaneously captured ions, a process that is particularly effective for divalent Ca2+ions [25,42].
The interacting calcium or sodium ions move simultane-ously, in a coordinated manner, enabling escape to occur over a potential barriers of minimal height on the 2D potential energy surface (PES) [70,71]. The PES approach allows one to describe double-ion conduction as the potential motion of a quasiparticle along an optimal stochastic trajectory on the PES [36,46,72], thereby reducing the problem of double-ion conductdouble-ion to the case already discussed, i.e., the 1D movement of a particle (in this case a “superion”) in an electrostatic field.
We exploit this approach to show explicitly that the resonancelike conduction and selectivity of the M1 calcium channel and the L1 sodium channel occur through a barrierless, multi-ion, conduction mechanism. To study valence selectivity we construct both homogeneous Ca2+-Ca, Na+-Na, and heterogeneous Na+-Ca2+ double-ion PESs, find the optimal (minimal energy change) stochastic paths, and calculate the energy profiles along these paths (see below).
Figure14(a)shows the calculated dependence ofE on
Qf for the L1 band (DEKA sodium channel), revealing a
2 2.5 3 3.5 4
Qf/e
0 5 10 15
E
/
kB
T
1 1.5 2
0 0.5 1 1.5
Qf/e
J(
ar
b.
uni
ts
) (d)
M1 (a)
(b)
L1 (c)
FIG. 14. (Color online) Energetics and Brownian dynamics for double-ion permeation of the sodium L1 and calcium M1 bands. (a) The L1 band potential energy vs the fixed charge Qf. The energy difference along the profile shows a wide minimum at Qopt=1.5e. (b) The peak in the sodium currentJvsQf calculated from electrostatics is shifted down compared to the very weak BD-simulated conductance peak L1 (green point-down triangles). (c) The M1 calcium band potential energy vs fixed charge Qf. The energy difference along the profile show a deep minimum at Qopt=3e. (d) The peak in the calcium currentJ vsQf calculated from electrostatics (blue curve) lies close to the BD-simulated M1 peak in selectivity (green point-down triangles).
and to the obviously strong overlap between the different sodium bands (see Fig.5).
Figure14(c)shows similar comparisons for the M1 band (L-type calcium channel): the calculated dependence ofE
onQf undergoes a sharp minimum atQopt =3e. The current calculated from the Kramers approximation is compared with that obtained from the BD simulations in Fig.14(d). The good agreement between the peaks confirms that the maximum of selectivity in the double-occupied M1 band corresponds to the point of barrierless conductivity.
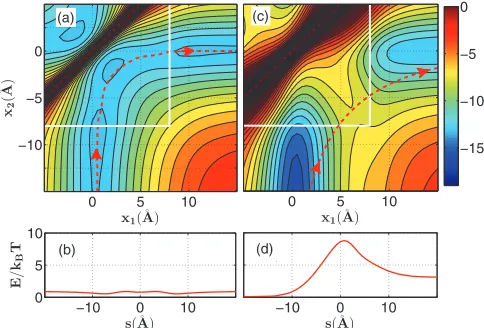
Figure 15 presents Na+-Na+ and Ca2+-Na+ PES maps, optimal trajectories, and corresponding energy profiles, for
Qf=L1, at the point of barrierless conductivity. Figures15(a)
and15(b)show the Na+-Na+ PES map and energy optimal trajectory S corresponding to a knock-on event, navigating two orthogonal valleys from south to east on the PES. The energy profile along S is almost flat (the energy difference along the optimal path does not exceed 1kBT) corresponding
to fast, barrierless, permeation.
In contrast, the optimal path on the heterogeneous Ca2+ -Na+ PES for L1 [Figs.16(c)and16(d)] passes via a saddle (where it is not well defined) where it has to overcome a relatively high potential barrier by thermal activation. The latter is E≈8kBT for a sodium ion trying to knock on
a calcium ion andE≈6kBT for the opposite combination. This is the PES-language explanation for calcium blockade in the outer ring of the Navsodium channel.
The pattern for Ca2+-Ca2+permeation is rather similar but all effects are much more pronounced. Figure 16 presents Ca2+-Ca2+and Ca2+-Na+PES maps, optimal trajectories and the corresponding energy profiles forQf=M1, at the point of
x1(˚A)
x2
(˚
A
)
0 5 10
−10 −5 0
−10 0 10
0 5 10
s(˚A)
E
/
kB
T
x1(˚A)
0 5 10
−10 0 10
s(˚A)
−15 −10 −5 0
(a) (c)
(b) (d)
FIG. 15. (Color online) (a) Double-ion Na+-Na+potential energy surface (PES) for the model channel withQf=L1 (1.5e), shown as a contour plot. The contour separation is 1kBT, and the color bar labels are in units ofkBT. The diagonal ridge in the upper-left corner represents the electrostatic barrier along the main diagonal of the map x1=x2. The map area related to the selectivity filter is limited by the white lines. The optimal trajectory S (red dashed line) traverses two orthogonal valleys in the direction shown by the arrows and represents a knock-on event. The first ion initially captured at the center of the selectivity filter is pushed and substituted for by the second ion arriving at the channel mouth. (b) The potential energy Eprofile along S represents almost barrierless permeation. (c), (d) show the same quantities for the heterogeneous Ca2+-Na+ double
ion: the binding site is initially occupied by a Ca2+ion that should
be pushed by a Na+ion. The optimal trajectorySnavigates via two valleys separated by a saddle, which creates an intermediate potential barrier (E≈8kBT), corresponding to divalent blockade of Na+.
maximum Ca2+or Na+selectivity. Figures16(a),16(b)show the Ca2+-Ca2+PES map and the energy-optimal trajectoryS, navigating two deep orthogonal valleys. The energy profile along Sis again almost flat: the energy difference along the optimal path does not exceed 1-2kBT, corresponding to fast barrierless permeation.
In contrast, the heterogeneous Ca2+-Na+ PES for M1 [Figs. 16(c) and 16(d)] encounters an impermeable high potential barrier E≈20kBT for a sodium ion trying to knock on a calcium ion., which would need to be overcome by thermal activation. This is the PES-language explanation for calcium blockade and AMFE in the EEEE calcium channel; the barrier for the opposite combination is considerably smaller,
E≈3kBT, and it can be overcome by thermal activation,
i.e., a calcium ion can knock on a sodium one.
It was shown rigorously in Ref. [47] that calcium and sodium conduction and selectivity band correspond to barrier-less, double-ion conduction for Ca2+ions and a deep blockade of Na+ions, thereby resolving the selectivity vs conductivity paradox.
In terms of our simple model, there is of course no essential difference between a biological ion channel and an artificial nanopore of similar geometry (radius R and length L) and surface charge Qf. Such nanopores may be expected to
[image:12.608.51.293.73.246.2] [image:12.608.314.556.75.239.2]x1(˚A)
x2
(˚
A
)
0 5 10
−10 −5 0
−10 0 10
−10 0 10
s(˚A)
E
/
kB
T
−10 0 10
s(˚A) x1(˚A)
0 5 10 −80
−60 −40 −20 0
(b) (d)
(a) (c)
FIG. 16. (Color online) (a) Double-ion Ca2+-Ca2+ potential energy surface (PES) for the model channel withQf =M1 (3.0e), shown as a contour plot. The contour separation is 2kBT, and the color bar labels are in units ofkBT. The diagonal ridge in the upper left corner represents the electrostatic barrier along the main diagonal of the mapx1=x2. The map area related to the selectivity filter is limited by the white lines. The optimal trajectoryS(red dashed line) traverses two deep (≈60kBT) orthogonal valleys in the direction shown by the arrows, and represents a knock-on event. The first ion initially captured at the center of the selectivity filter is pushed out and substituted for by the second ion arriving at the channel mouth. (b) The potential energy E profile along S demonstrates almost barrierless permeation (E <2kBT). (c), (d) show the same quantities for the heterogeneous Ca2+-Na+double-ion: the binding
site is initially occupied by a Ca2+ion that should be pushed by a Na+
ion. The optimal trajectorySnavigates via a deep valley ended by high potential barrier (E≈20kBT), corresponding to deep divalent blockade of the Na+current.
IV. CHARGE NEUTRALIZATION AND VALENCE SELECTIVITY
The pattern of conduction and occupancy bands revealed by BD simulations and confirmed by electrostatics appears as a set of equidistant (periodic) J peaks coinciding with steps inP with a period related to the ionic chargeze and shifted from zero by a half-periodQf =ze/2. We now offer a simplified (and nonrigorous) explanation of this phenomenon based on the idea of sequential neutralization of the fixed negative chargeQf by the capture of positive ions.
The zeroth-order bands (L0, M0) appear when the self-energy barrierEself is balanced by the site attraction energy
Eattr(Sec.III D). The self-energy barrierEselfcan be estimated by application of Gauss’s theorem to the channel volume taking account of the near-zero radial field as [35]:
Eself= 1 4π ε0
(ze)2L
2εwR2. (5)
A similar approach gives us for the attraction energy
Eattr= 1 4π ε0
(ze)QfL
εwR2 . (6)
From conditionEself=Eattrwe take the result:
Qf(0,z)=zQf(0,1)=(ze)
2 . (7)
0 10 20
JNa
(
10
7/s
)
0 5 10
JCa
(
10
7/s
)
0 1 2 3 4 5 6
0 5 10
Qf/e
JLa
(
10
7/s
)
(a)
(b)
(c) M1
M0 M2
L0 L1 L2
T0 T1
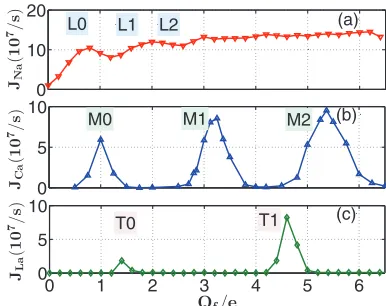
FIG. 17. (Color online) BD simulations showing the pattern of conduction bands and valence selectivity for Na+, Ca2+, and La3+
ions. (a) The conduction bands for Na+are overlapped and smooth [replotted for easier comparison from Fig.4(a)]. (b) Ca2+conduction
exhibits clearly resolved peaks M0, M1, M2 (c) La3+ conduction
exhibits the clearly resolved peaks T0 and T1.
We can define the effective image charge for an ion of charge ze as being Qeff=(ze)/2 and thus interpret (7) as the neutralization conditionQf =Qeff. The multiplier (1/2) appears from the textbook formula for the electrostatic self-energyEself=(1/2)eUrf, whereUrf stands for the potential of the reaction field [32,35].
Thus, we may expect that next resonances will appear periodically at intervals ofze(i.e., 1efor Na+, 2efor Ca2+) when additionalQfis neutralized by the charge of an integer number of sequentially captured ions (L1,M1, . . .). For an ion of valencezone can write:
Qf(i,z)=Qf(0,z)+zei =ze12 +i, (8)
where the order of the band i=0,1,2, . . . is equal to the number of ions captured by the site, i.e., the saturated site occupancy (i=0 for L0 and M0, etc.).
Equation(8)provides for a separation inQf space of the
bands of ions for different valencezand hence gives rise to valence selectivity in the generic model ion channel. That is, for our rigid, fixed-charge model, we will have the following sequences of conduction bands for ions of different valence (cf. Fig.17).
(i) Monovalent Na+ions
Qf(i,1)=0.5e(L0)→1.5e(L1)→2.5e(L2). . . (9)
The band positions(9) are also in good agreement with the energetically defined pattern from electrostatics. However, the BD-simulated bands shown in Fig.17(a)appear at somewhat higher values ofQf (see also Sec.III A), a discrepancy that requires further investigation.
(ii) Divalent Ca2+ions
Qf(i,2)=1e(M0)→3e(M1)→5e(M2). . . (10)
[image:13.608.336.529.73.226.2] [image:13.608.51.295.75.237.2]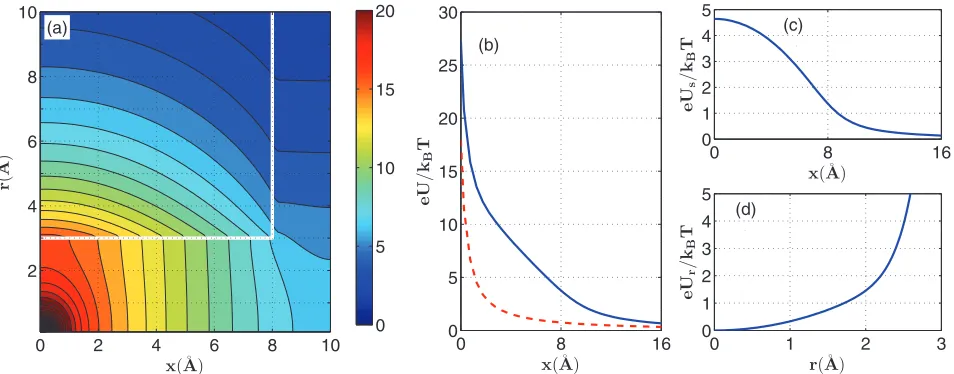

![Fig. 5(a)in]. They correspond to the thresholds of the transitions P.](https://thumb-us.123doks.com/thumbv2/123dok_us/8110901.236311/7.608.328.542.74.223/fig-correspond-thresholds-transitions-p.webp)