Re-parameterization of the Logistic Model in
Assessing Changes in the Baroreceptor Reflex
—
Logistic Model for Changes in Baroreceptor ReflexShande Chen1, Xiangrong Shi2
1Department of Biostatistics, University of North Texas, Fort Worth, USA; 2Department of Integrative Physiology, University of
North Texas, Health Science Center, Fort Worth, USA. Email: [email protected]
Received March 16th, 2010; revised April 16th, 2010; accepted April 25th, 2010.
ABSTRACT
The logistic model is frequently used to describe the nonlinear relationship between systemic arterial pressure (SAP) and carotid sinus pressure (CSP). In this paper, we propose using maximum gain and saturation as parameters in the logistic model. By this method, the estimates and standard errors together with confidence intervals for maximum gain and saturation are direct outputs from the curve fitting, which also makes it easy to perform various hypotheses testing on these quantities. The method is illustrated by real life data from a study on the carotid baroreflex function during infusion of sodium nitroprusside, in which seven healthy, young men who were clinically proved to be free from any disease were studied. Their heart rate, arterial blood pressure and central venous pressure were measured. Neck pres-sure and neck suction protocol was carried out to selectively elicit changes in CSP and the responsiveness of SAP. Data were analyzed and compare before and after nitroprusside infusion. Our results showed that nitroprusside significantly decreased arterial blood pressure and central venous pressure, and significantly increased heart rate, and significantly augmented maximum gain of the carotid baroreflex function.
Keywords: Blood Pressure, Carotid Sinus Pressure, Heart Rate, Mathematical Model, Maximum Gain, Nitroprusside, Operating Range
1. Introduction
The logistic model is one of the most commonly used parametric models in assessing changes in arterial barore- ceptor reflex. The model introduced by Kent et al. in 1972
[1] relates change in carotid sinus pressure (CSP), x, to
response of systemic arterial pressure (SAP), which is given by the equation:
1
42 3
1 exp
A
y A
A x A
,
where A1 is the range of y (i.e., ABP responding range), 2
A is the multiplier in the exponential function, A3 is
the centering point of x which can elicit equal pressor or
depressor response, and A4 is the minimum of the
func-tion y. The carotid baroreceptor reflex (CBR) gain (or
slope) of entire CSP-SAP stimulus-response from the threshold to the saturation point can be determined from the first derivative of the logistic function. Since these parameters or their derivatives have relevant and
impor-tant meaning in interpreting the carotid sinus baroreflex function, this model has been extensively applied to hu-man carotid baroreflex control of SAP and heart rate (HR) at rest and during physical exercise [2-7].
Generally, the stimulus-response curve of individual subjects has a sigmoid shape, which can be fitted into this four-parameter model. Subsequently, every individual responding range of SAP (A1), i.e., the difference between
maximum and minimum response, centering point of CSP (A3) where the maximal slope is located, and the
mini-mum SAP (A4) are determined. Individual maximum gain
(Gmax), the largest slope in the logistic curve (when SAP =
A3) is derived or calculated from A A1 2 4, saturation (Csat)
and threshold (Cthr) are defined as 2 A2A3 and
2 3
A A
2
, respectively. Thus, the operating range of CSP can be calculated from the difference between Csat
and Cthr. Then the group data of individual parameters and
produce the typical individual sigmoid stimulus-response curve due to individual variance, despite the fact that the group curves of these subjects show sigmoid shape and can be fitted in to the four-parameter logistic model [7]. Therefore, the present study proposed to fit the logistic model with the group stimulus-response curve [7]. The group parameters A1, A2, A3 and A4 with their stan-
dard errors was directly obtained. However, estimated standard errors of their derivatives, such as Gmax, Rop, Csat
and Cthrhad to be computed by using delta-method.
It is a common practice to report confidence intervals in addition to the point estimates. Therefore, calculating standard errors of the estimates is important [8,9]. Fur- thermore, testing hypotheses regarding parameters is of-ten needed, e.g., comparing the maximum gains of the two groups. To perform the Wald test also requires stan-dard errors. Since the maximum gain is usually a very important parameter for the SAP-CSP relationship, the logistic model with natural parameters brings computa-tional burdens, especially when many curves need to be fitted. In this paper, we propose directly using maximum gain and saturation as parameters in the logistic model. This alternative parameterization enables the estimated standard errors and confidence intervals for the maximum gain and operation range to be obtained directly from the output of the statistical software. We then fitted two group stimulus-response curves during normotensive control and hypotensive challenge by sodium nitroprusside infu-sion using this alternative parameterization directly from the output of the statistical software using the Statistical Analysis System (SAS) software PROC NLIN.
2. Methods
2.1. SubjectsSeven healthy, young men (26.4 ± 1.3 yr and 74.6 ± 4.1 kg) participated in the study after having given a written consent that was approved by the Institutional Review Board for Protection of Human Subjects at UNT Health Science Center. All subjects were clinically proved to be free from any disease and had an orientation at the lab to familiarize with the experimental measurements and pro- cedure after having passed a physical examination.
2.2. Measurements
Heart rate (HR) was monitored from a standard lead of electrocardiogram (ECG). Arterial blood pressure (ABP) was determined from an intra-radial arterial catheter in-terfaced with a monitor (Hewlett-Parkard, Model 78205D/ 7803B). Central venous pressure (CVP) was measured via a double lumen catheter (50 cm, French 5, Cook Critical Care Inc.) placed through the basilica vein with until the tip of the catheter advanced under fluoroscopy
(Philips BV22, Eindhoven, Netherlands) at the fourth intercostal space. Both ABP and CVP were continuously monitored via a dual set of pressure transducers (Cobe Inc, Lakewood, CO). The pressure transducers were ca-librated before and after each experiment and the refer-ence point of these transducers was set at the subjects’ midaxillary line.
Changes in CSP were elicited by neck pressure (NP) and neck suction (NS) protocol controlled by a cus-tom-made computer software introduced by Pawelczyk and Raven [2]. A train of pulsatile (500 ms) NP and NS from +40 to –65 Torr was delivered to the subject’s neck through a neck chamber that encompassed the anterior 2/3 of the neck [10] when the subject was holding breathing at the end of normal expiration. Delivery of the pulsatile NP and NS was controlled by R wave of ECG with a difference in three consecutive baseline R-R in-tervals ≤ 100 ms and each pulse of NP or NS 50 ms de-livered after the R waves. The neck chamber was vented to atmospheric pressure after each pulsatile NP or NS delivery to avoid resetting of the baroreceptors. At lease three trains of NP and NS stimulus-response curves with correlation coefficient ≥ 0.75 of R-R interval response were collected from each subject in all experimental conditions for assessing CBR function. A≥ 90 s recovery
was interposed between two trains to ensure fully recov-ery of ABP and HR.
2.3. Procedures
After 30 min of supine rest from instrumentation, HR, ABP and CVP were continuously recorded for ≥1 min. These measurements were obtained as a baseline control. Neck pressure and neck suction protocol was carried out to assess the carotid baroreflex control of HR and ABP. Immediately after the assessment of the baseline carotid baroreflex function, a continuous infusion of sodium nitroprusside was initiated via the CVP catheter and the infusion rate was increased until a decrease in mean arte-rial pressure (MAP) approximately 10 mmHg was achie- ved. The infusion rate of nitroprusside was then main- tained constant throughout the rest of the experimental protocol. NP-NS protocol was repeated immediately after
≥1 min baseline data collection with nitroprusside infu-sion.
2.4. Data Analysis
HR, ABP, CVP were compared between baseline control and nitroprusside infusion with paired t-test. Group
sti-mulus-response curves of CBR control of MAP and HR during the control and nitroprusside infusion were as-sessed using the Kent’s logistic model [1]
1
42 3
1 exp
A
y A
A x A
the slope of the curve, as a function of x, is computed by the equation
1 2 2 3
2
2 3
exp '
1 exp
A A A x A
y
A x A
The maximum gain (Gmax), the largest slope in the
lo-gistic curve (which occurs at x A3), is equal to 1 2 4
A A (ignore the sign). The saturation (Csat) is
de-fined as 2 A2A3, the threshold (Cthr) is defined as
2 3
2 A A
, according to Chen and Chang [11]. The operation range (OR), i.e., the difference between the
saturation and threshold, is equal to 4 A2.
When the logistic model is fit, the estimates for pa- rameters A1, A2, A3 and A4 together with their stan-
dard errors can be obtained. The estimates for the maxi- mum gain and the operation range can be easily calcu- lated by replacing A1 and A2 with their estimates. The
estimated standard errors for the maximum gain and the operation range need to be computed by using delta- method as follows:
max
2 2
2 2
2 1 1 2 1 2 1 2 1 2
ˆ
1 ˆ ˆ ˆ ˆ ˆ ˆ ˆ ˆ ˆ ˆ 2
4
se G
, ,
A se A A se A A A se A se A r A A
2 2 2 ˆ 4 ˆ . ˆ op se A se R A
2
2
2 2 3
3 4
2
ˆ
ˆ ˆ ˆ
4 4 ˆ ˆ sat se C 2 3 2 2
ˆ ˆ, ˆ
se A se A se A r A A se A A A and
2
2
2 2 3
3 4
2
ˆ
ˆ ˆ ˆ
4 4 ˆ ˆ ˆ thr se C 2 3 2 2
ˆ ˆ,
se A se A se A r A A se A
A A
where is the Pearson correlation coefficient between
1 2ˆ ˆ,
r A A
1
A and A2, and similarly for r A A
ˆ ˆ2, 3
.An alternative is to parameterize the logistic model directly using Gmax and Rop. We can rewrite the logistic
equation as
max
43
1 exp 4
op
op
G R
y A
x A R
.
The meaning of parameters A3 and A4 remain un-
changed. Under this parameterization, the estimates for
Gmax and Rop together with their standard errors can be
obtained directly from the output, and Csat R 2 3
2
2
3 3
ˆ ˆ
ˆ ˆ ˆ ˆ , , 4 sat op op op se C se R 3 ˆ
se A se R se A r R A
3
2
thr op
C R A and
2
2
3 3
ˆ
ˆ
ˆ ˆ ˆ ˆ , ,
4 thr op op op se C se R 3 ˆ
se A se R se A r R A
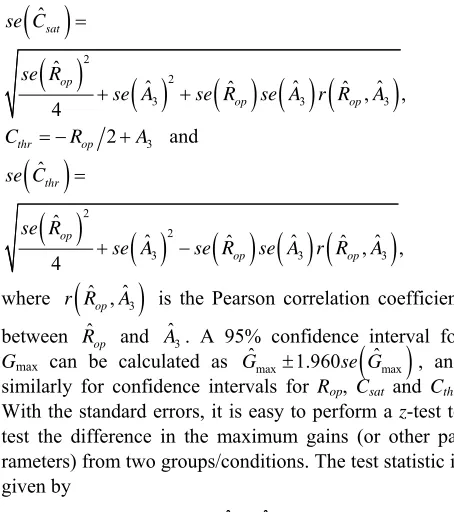
where r R
ˆ ,op Aˆ3
ˆ
is the Pearson correlation coefficient between Rop and Aˆ3. A 95% confidence interval for
Gmax can be calculated as , and
similarly for confidence intervals for Rop, Csat and Cthr.
With the standard errors, it is easy to perform a z-test to
test the difference in the maximum gains (or other pa-rameters) from two groups/conditions. The test statistic is given by
max max
ˆ 1.960 ˆ
G se G
1 2 2 2 1 2 ˆ ˆ . G G Z se se
The p-value can be calculated based on the standard
normal distribution. The figures were plotted using Sig-ma Plot software and the data were analyzed using the software SAS with PROC NLIN (see Appendix for the PROCEDURE). Significance level was set at P≤ 0.05.
3. Results
Infusion of sodium nitroprusside significantly decreased ABP and CVP, and significantly increased HR (Table 1)
with a steady-state infusion rate of nitroprusside 125 ± 11
μg/min. Nitroprusside infusion significantly augmented
Gmax for both CBR control of MAP and HR, see Figure 1
and Table 2. Furthermore, responding ranges of both
MAP and HR (i.e., A1) were significantly increased.
However, A3, i.e., the centering point, appeared not
sta-tistically different between control and nitroprusside for either MAP or HR.
Under the control, eight observations are used to fit a logistic model related the mean arterial pressure (MAP) with ECSP. The F-test for the overall fitting has a value of 469.45 with 4 and 3 degrees of freedom, which gives a p-value less than 0.0001. The estimates, standard errors and correlation matrix are in Tables 3 and 4. Using the
formulas from the delta-method in the previous section, we obtain estimates for Gmax, Rop, Csat and Cthr together
with their standard error as in Table 5.
For the logistic model directly using Gmax and Rop, we
obtain the estimates and their standard error in Table 6.
The 95% confidence intervals for the maximum gain and
op A
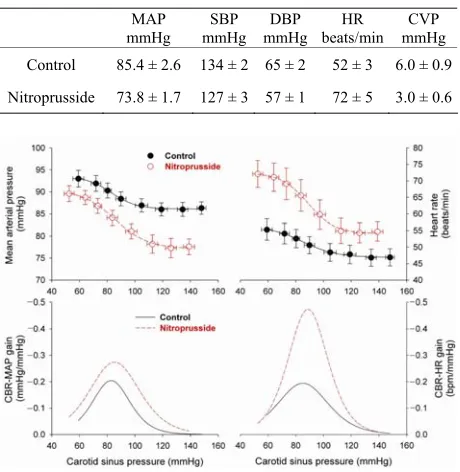
[image:3.595.307.534.85.341.2]Table 1. Hemodynamic data during baseline control and nitroprusside infusion.
MAP mmHg
SBP mmHg
DBP mmHg
HR beats/min
CVP mmHg Control 85.4 ± 2.6 134 ± 2 65 ± 2 52 ± 3 6.0 ± 0.9
Nitroprusside 73.8 ± 1.7 127 ± 3 57 ± 1 72 ± 5 3.0 ± 0.6
Figure 1. Mean arterial pressure and heart rate in response to change in carotid sinus pressure and their derived gain curves. Right and left panels show mean arterial pressure and heart rate (top panels) and their derived gain curves (bottom panels), respectively, during changes in carotid sinus pressure. Nitroprusside infusion significantly dis-places mean arterial pressure response curve left-down- ward and heart rate response curve right-upward (red open symbols and dash lines). However, both gain and operating range of carotid baroreflex control of mean arterial pres-sure and heart rate both significantly augmented as com-pared to the control condition (black solid symbols and solid lines).
operation range are directly from the SAS output. The Pearson correlation coefficient between Rˆop and Aˆ3 is
–0.4972883. The results for saturation and threshold from the re-parametrized logistic model are summarized in Table 7. The two methods agree well. The tiny
dif-ferences are, in general, due to the numerical calculation and convergence criteria.
The MAP under nitroprusside and the HR under the control and under nitroprusside were also fitted. For each fitting, eight observations based on the group means were used. The two methods essentially provided identi-cal results. We list all the results from our proposed parameterization in Table 2.
In fitting the logistic models, we assume that errors are independent. Therefore, it is reasonable to assume that two estimated maximum gains are independent. Thus,
z-tests were performed to test whether the maximum
[image:4.595.306.537.109.514.2]gains under control and nitroprusside are different. For MAP, the z-value is 2.743, resulting a p-value of 0.0134,
Table 2. Summaries from the re-parametrized logistic model.
MAP
Drug Estimate standard error 95% CI Control Gmax 0.2062 0.0176 (0.157, 0.255)
Rop 35.88 4.491 (23.4, 48.3)
Csat 100.98 1.953 (97.1, 104.8)
Cthr 65.10 3.064 (59.1, 71.1)
A3 83.04 1.248 (79.6, 86.5) A4 86.12 0.124 (85.8, 86.5)
Nitroprusside Gmax 0.2719 0.0199 (0.217, 0.327) Rop 49.68 6.039 (32.9, 66.4)
Csat 110.14 2.826 (104.6, 115.7)
Cthr 60.46 3.868 (52.9, 68.0)
A3 85.30 1.535 (81.0, 89.6) A4 77.08 0.317 (76.2, 78.0)
HR
Drug Estimate standard error 95% CI Control Gmax 0.1943 0.0141 (0.155, 0.233)
Rop 48.69 6.159 (31.6, 65.8)
Csat 109.71 2.510 (104.8, 114.6)
Cthr 61.02 4.348 (52.5, 69.5)
A3 85.37 1.766 (80.5, 90.3) A4 46.87 0.186 (46.4, 47.4)
Nitroprusside Gmax 0.4734 0.0367 (0.372, 0.575)
Rop 38.66 4.143 (27.2, 50.2)
Csat 108.12 2.197 (103.8, 112.4)
Cthr 69.45 2.490 (64.6, 74.3)
A3 88.79 1.106 (85.7, 91.9) A4 54.10 0.377 (53.1, 55.1)
Table 3. Estimates and standard errors from the original logistic model (MAP, control group).
Estimate standard error
A1 7.3990 0.4124
A2 0.1115 0.0140
A3 83.0372 1.2484
A4 86.1201 0.1239
Table 4. Correlation matrix from the original logistic model (MAP, control group).
1.0000 –0.8240 –0.6736 –0.5613
1.0000 0.4973 0.5063
1.0000 –0.0709
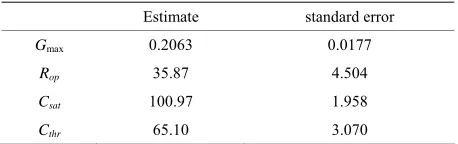
[image:4.595.306.538.553.625.2] [image:4.595.308.536.662.723.2]Table 5. Estimates and standard errors based on the del-ta-method (MAP, control group).
Estimate standard error
Gmax 0.2063 0.0177
Rop 35.87 4.504
Csat 100.97 1.958
[image:5.595.57.287.220.296.2]Cthr 65.10 3.070
Table 6. Estimates from the re-parametrized logistic model (MAP, control group).
Estimate standard error 95% CI
Gmax 0.2062 0.0176 (0.157, 0.255)
Rop 35.8760 4.4910 (23.4, 48.3)
A3 83.0371 1.2484
[image:5.595.57.286.333.377.2]A4 86.1201 0.1239
Table 7. Results for saturation and threshold from the re- parametrized logistic model (MAP, control group).
Estimate standard error 95% CI
Csat 100.98 1.953 (97.1, 104.8)
Cthr 65.10 3.064 (59.1, 71.1)
and for HR, the z-value is 7.099, providing a p-value less
than 0.0001. For both MAP and HR, the maximum gain is significantly larger after the infusion of nitroprusside.
4. Discussion
We proposed directly using maximum gain and satura-tion as parameters in the logistic model. By such re-para- meterization, the estimates and standard errors for maxi- mum gain and saturation can be obtained directly from outputs of the curve fitting. Though it requires some hand calculation for the saturation and the threshold, the computation for the standard errors is slightly simpler comparing with the model with the natural parameters. The results from the two parameterizations are identical. Thus, as an alternative, the proposed method should be useful in practice. We attach an example SAS code in the Appendix.
Our data suggest that nitroprusside infusion signifi-cantly sensitizes the carotid baroreflex function as evi-denced by enhanced CBR-MAP and CBR-HR gains (Figure 1). This sensitized carotid baroreflex function is
partially attributable to the result of nitroprusside induced relaxation of vascular smooth muscle, which enhances mechanical transmission to the carotid sinus receptors elicited by neck pressure and neck suction procedure. Therefore, given same mechanic stimulus, the carotid baroreceptor is able to transmit greater afferent discharge to the nucleus tractus solitaires and to elicit greater
ca-rotid baroreflex responsiveness during nitroprusside in-fusion than at rest (i.e., control condition). This explains
an overall increase in the carotid baroreflex gain during both hypotensive and hypertensive stimuli elicited by neck pressure and neck suction, in addition to the aug-mented maximal gain.
The other mechanism responsible for the nitroprusside enhanced carotid baroreflex function involves with vaso-dilation (evident by a significant decrease in arterial blood pressure) and venodilation (evident by a significant decrease in central venous pressure) induced by nitro-prusside (Table 1), which diminishes inhibitory vagal
afferent influence sent from the aortic arch and cardio-pulmonary baroreceptors. This diminished inhibitory afferent discharges from the aortic arch and cardiopul-monary baroreceptors may exert a facilitation modifica-tion on the activities at the cardiac center (i.e., the
nu-cleus ambiguus and/or dorsal vagal nunu-cleus) and the va-somotor center (i.e., the rostral ventromedullar nucleus
and/or ventromedial meulla) that relays the efferent sig-nals to the heart and blood vessels. This observation seems to be supported by increases in both CBR-MAP and CBR-HR gains during nitroprusside infusion.
This study provides a couple of clinical relevant im-plications. First, vasodilator agent such as nitroprusside has not only the therapeutic influence of lowering arterial blood pressure, but also facilitatory modification on the carotid baroreceptor activity via improvement of me-chanic transmission as a result of relaxation of vascular smooth muscle. Second, unloading of the aortic arch and cardiopulmonary baroreceptors by reduction of central blood volume, i.e., CVP and venous return may further
potentiate the carotid baroreflex function during nitro-prusside infusion. However, the implications derived from the present study are only limited to young adults without cardiovascular or neurological complication.
In conclusion, the present study proposes a model of using re-parameterization for the estimates and standard errors for maximum gain and saturation. The proposed method makes it easy for more statistical inference on these quantities. By using the SAS code provided, we found that it is easy to apply this method. Our data sug-gest that nitroprusside infusion can significantly enhance the carotid baroreflex function in young healthy adults. Our data made us understand better about the function of nitroprusside, and suggested that further studies, such for elderly subjects and hypertensive patients, may be needed.
REFERENCES
[2] J. A. Pawelczyk and P. B. Raven, “Reductions in Central Venous Pressure Improve Carotid Baroreflex Responses in Conscious Men,” American Journal of Physiology, Vol. 257, No. 5, 1989, pp. H1389-H1395.
[3] J. T. Potts, X. Shi and P. B. Raven, “Cardiopulmonary Baroreceptors Modulate Carotid Baroreflex Control of Heart Rate during Dynamic Exercise in Humans,” Amer-ican Journal of Physiology, Vol. 268, No. 4, 1995, pp. H1567-H1576.
[4] J. T. Potts, X. Shi and P. B. Raven, “Carotid Baroreflex Responsiveness during Dynamic Exercise in Humans,” American Journal of Physiology, Vol.265, No. 6, 1993, pp. H1928-H1938.
[5] X. Shi, B. H. Foresman and P. B. Raven, “Interaction of Central Venous Pressure, Intramuscular Pressure, and Carotid Baroreflex Function,” American Journal of Phy-siology, Vol.272, No. 3, 1997, pp. H1359-H1363. [6] X. Shi, J. T. Potts, B. H. Foresman and P. B. Raven,
“Carotid Baroreflex Responsiveness to Lower Body Posi-tive Pressure-Induced Increases in Central Venous Pres-sure,” American Journal of Physiology, Vol.265, No. 3, 1993, pp. H918-H922.
[7] X. Shi, F. A. Schaller, N. Tierney, P. Chanthavong, S.
Chen, P. B. Raven and M. L. Smith, “Physically Active Lifestyle Enhances Vagal-Cardiac Function but Not Cen- tral Autonomic Neural Interaction in Elderly Humans,” Experimental Biology and Medicine (Maywood), Vol.233, 2008, pp. 209-218. doi:10.3181/0704-RM-106
[8] “Uniform Requirements for Manuscripts Submitted to Biomedical Journals: Writing and Editing for Biomedical Publication,” International Committee of Medical Journal Editors. http://www.icmje.org/urm_full.pdf.
[9] D. Moher, K. F. Schulz and D. G. Altman, “The CON-SORT Statement: Revised Recommendations for Im-proving the Quality of Reports of Parallel-Group Ran-domized Trials,” The Lancet, Vol. 357, No. 9263, 2001, pp. 1191-1194. doi:10.1016/S0140-6736(00)04337-3
APPENDIX
Example SAS Code for Re-Parameterized Logistic Mod-el
TITLE’ Reparameterization of logistic model—Example (Group Data)’;
DATA LOGISTIC;
INPUT MAP ECSP; CARDS;
92.9937 59.190 91.9459 71.927 90.3382 80.344 88.3940 89.876 86.9402 104.823 86.0242 119.136 86.0451 134.356 86.2943 147.957 ;
ods output CorrB = correlat;
ods output ParameterEstimates = estimate;
PROC NLIN DATA = LOGISTIC;
MODEL MAP = MG*OP/(1 + exp(4*(ECSP –
A3)/OP)) + A4;
PARMS MG = 0.21 OP = 36 A3 = 83 A4 = 86; run;
DATA OPA3;
SET CORRELAT; IND = 1;
IF PARAMETER = ‘OP’; RENAME A3 = R_OP_A3; DROP MG OP A4;
DATA EST0;
SET ESTIMATE; ORDER = Obs;
DATA EST1;
SET ESTIMATE; IND = 1;
IF Parameter = ‘OP’; RENAME Estimate = OP; RENAME StdErr = OP_SE;
DATA EST2;
SET ESTIMATE; IND = 1;
IF Parameter = ‘A3’; RENAME Estimate = A3; RENAME StdErr = A3_SE;
DATA THRES;
MERGE OPA3 EST1 EST2; BY IND;
Parameter = ‘Th’; Estimate = –OP/2 + A3;
StdErr = SQRT(OP_SE**2/4 + A3_SE**2 –
OP_SE*A3_SE*R_OP_A3 );
LowerCL = Estimate – 1.96* StdErr;
UpperCL = Estimate + 1.96* StdErr;
ORDER = 6;
DATA SATUR;
MERGE OPA3 EST1 EST2; BY IND;
Parameter = ‘SA’; Estimate = OP/2 + A3;
StdErr = SQRT( OP_SE**2/4 + A3_SE**2 +
OP_SE*A3_SE*R_OP_A3 );
LowerCL = Estimate – 1.96* StdErr;
UpperCL = Estimate + 1.96* StdErr;
ORDER = 5;
DATA OUTPUT;
MERGE EST0 THRES SATUR; BY ORDER;
PROC PRINT;