Vol.2, No.2, 56-60 (2011)
doi:10.4236/as.2011.22009
Agricultural Sciences
The effects of steaming and roasting treatments on
lipase activity and nutritional components of “oat rice”
(OR): the peeled naked oat (Avena nuda) kernels
*
Xinzhong Hu1*, Jinting Yan2, Xiaohui Xing1
1College of Food Science and Engineering,Northwest A&F University, Yangling, China; *Corresponding Author: [email protected]
2Agriculture Products Quality Inspection Center of Xi’an City, Xi’an, China.
Received 24 September 2010; revised 12 January 2011; accepted 10 February 2011.
ABSTRACT
Peeled naked oat kernels, named “oat rice” (OR) by Chinese food scientists and processors, are novel oat products in China. This study exam-ined the effects of steaming and roasting treat-ments on the enzyme activities, nutritional con-tents, and flour pasting properties of OR kernels. Results showed that a peeling time of 20 s ca- used 16.13% β-glucan loss, while a peeling time 25 s caused 34.29% β-glucan loss in the kernels. OR kernels with a 20 s peeling treatment dem-onstrated significantly higher starch levels and kernel whiteness compared with normal oat ker- nels (P < 0.01). It was also found that normal pre- ssure steaming, autoclaved steaming and infra-red roasting treatments could exterminate lipase activities in the OR kernels, and provide the OR kernels with significantly lower final viscosities and setback values than normal kernels (P < 0.01).
Keywords:Naked Oat (Avena Nuda); Oat Rice; Peeling Treatment; Lipase Activity; Infrared Roasting
1. INTRODUCTION
It is widely known that high lipid enzyme activities in oat kernels can lead to oxidation and spoilage in oat processing and storage [1-3]. Hot-air roasting (HAR), normal pressure steaming (NPS), and autoclaved steam-ing (AS) are methods traditionally used for oat enzyme
deactivation in China. But, these commonly used meth-ods are time-consuming, and thus do not fit the industri-alization process found in large oat-processing companies in the country. Recently, infrared roasting (IR), a new method, has attracted much attention and research inter-est for the high efficiency of the method. However, due to its short treatment time (e.g. 18 s), the IR treatment also has a drawback in that the method fails to exterminate the lipase activities in some oat varieties [4]. In order to solve this problem, it is necessary to remove part of the kernel lipase before it receives an IR treatment.
Peeling treatment has been proven to be a useful method for reducing lipase activities in oat kernels be-fore IR treatment [5]. For example, the lipase activities in the VAO-2 oat kernels (a Canadian oat variety) sub-jected to a 20 s peeling treatment are only 66.5% of those in normal VAO-2 kernels subjected to the same treatment [5].
The peeled oat kernels are designated as “oat rice” (OR) by oat processors and researchers in China. There are two reasons for this designation. The first is that the peeled oat kernels are close to rice kernels in shape and color. The second is that peeled oat kernels can be mixed with rice kernels and cooked together as human food in China [5]. Because OR kernels can be consumed to-gether with rice, the most important staple food in China, the market potential for OR kernels is huge. So it is pro-pitious to determine the effects of peeling and enzyme deactivation treatment on the enzymatic levels, and the nutritional and functional properties of the new oat product in China. Our previous research reported on the relationship between kernel size and shape of, and on lipase activity in, OR kernels and normal kernels [5]. We also reported on the effects of steaming and roasting treatments on the β-glucan, lipid and starch levels in normal oat kernels [4]. In the present study, we aimed to determine the optimal peeling time for the present study, *The research was financially supported by the Public Industry Project
Copyright © 2011 SciRes. Openly accessible athttp://www.scirp.org/journal/AS/ we aimed to examine the effects of IR, NPS, AS and
HAR treatments on the nutritional contents, lipase activ-ity, and flour pasting properties of OR the production of OR kernels.
2. MATERIALS AND METHODS
2.1. Materials
VAO-2 naked oat kernels were harvested in 2005 from a 15 ha field in Ottawa (Ontario, Canada). The oat ker-nels were cleaned, and purified, and then graded with a dockage tester (5/64 × 3/4 mm). Kernels left in the upper side of the dockage tester were chosen for the lipase de-activation treatments.
OR kernels were produced through peeling treatments using a TM-05C Satake Mill (Satake Corporation, Hi-roshima, Japan) as indicated in our previous report [5]. Before peeling treatments, the machine was first warmed for 600 s. Then, for each treatment, 150 g VAO-2 oat kernels were placed in the specimen cup of the machine and peeled for the designated period of time. In order to get OR kernels with different peeling ratios, nine differ-ent treatmdiffer-ent times were designated from 0 to 45 s at 5 s intervals.
2.2. Methods
Enzyme activities were deactivated by the four dif-ferent treatments described as follows.
NPS treatments were implemented following Ames and Rhymer’s method [6]. Here, OR kernels were placed into the metal basket of a vegetable steamer and treated by boiling water for 20 min. The kernels were steamed in batches of 250 g, which allowed the kernels to form a layer no deeper than 1 cm in the steamer basket. After the NPS treatment, the kernels were kept at room tem-perature for 24 h for moisture equilibration. They were then put in an air oven at 33˚C for 12 h.
AS treatments were implemented according to Zhang
et al.’s report [7] and modified slightly. Using an auto-clave, OR kernels were steamed at 121˚C and 15 psi for 10 min. The samples were then exposed at room tem-perature for 24 h to allow moisture equilibration. They were then kept in an air oven at 33˚C for 12 h.
HAR treatments were performed following Zhang et al.’s report [7]. Before the roasting treatment, OR ker-nels were tempered for 3 h to a moisture content of 20%. The tempered OR kernels were then roasted in a hot-air oven at 155˚C for 30 min. Finally, the HAR-treated ker-nels were kept in an air oven at 33˚C for 12 h, which caused the moisture content to drop to about 10%.
IR treatments were implemented using a BO-04 in-frared instrument (Micronizing Company UK Ltd, Charnwood Mill, Framlingham, UK). Tempered OR
samples with a moisture content of 20% were infra-red-roasted at 580˚C for 18 s. After the IR treatment, the moisture content of the OR kernels was adjusted to about 10% by keeping the kernels in an air oven at 33˚C for 12 h.
The starch content and viscosity properties of OR flour, as well as the β-glucan content, kernel lipid con-tent, and peroxidase activities of the OR samples were tested according to AACC76-13, AACC76-22, AACC 31-22, AACC30-10, and AACC22-80, respectively. The whiteness of the OR kernels, moreover, was determined using a Minolta CR310 chromo meter (Minolta Camera Co., Ltd. Japan).
The lipase activities of the kernels were determined according to Kwon and Rhee’s reports [8]. Briefly, the OR kernels were powdered and defatted, and the result-ing 0.5 g defatted oat powder was mixed with 98 μL of triolein. The mixture was then added to 330 μL buffer (0.05 mol·L–1 Tris-HCl, pH 7.5, containing 1% v/v Tri-ton X-100) and stirred to form oat dough. The dough was incubated at 37˚C for 1 h, and after which 100 μL 1 mol/L HCl was added to stop the incubation. HCl was then added immediately as a zero-time control. The dough was soaked and boiled in 5 mL isooctane extrac-tant for 300 s to extract oleic acid, which was the prod-uct of triolein hydrolysis. The absorbance of the extract was then measured at 715 nm, and was further compared with the absorbance from an oleic acid standard. The resulting lipase activity was described in units of μ
moles of oleic acid per hour per gram.
2.3. Statistical Analysis
The values were provided as means ± standard divi-sion (SD). The statistical significance of the differences among the parameters was assessed using analysis of variance (ANOVA) by SAS software, and group means were considered to be significantly different at P < 0.01.
3. RESULTS AND DISCUSSION
3.1. Determination of the Optimal Peeling Time for the Production of OR Kernels
X. Z. Hu et al. / Agricultural Sciences 2 (2011) 56-60 58
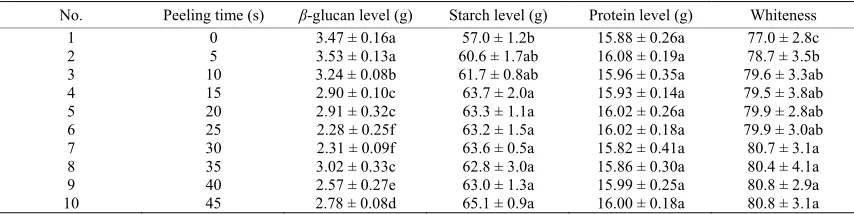
are attributed to β-glucan [9-11]. Oat β-glucan is not distributed evenly in the kernel outer layer. The β-glucan level in the aleurone layer is much higher than in the cortex of naked oat kernels [4]. For this reason, during peeling treatment, in order to avoid great β-glucan loss, the β-glucan-rich aleurone layer should not be damaged. The Results showed that as the peeling time increased from 0 to 20 s, the β-glucan content in 100 gram OR kernels decreased gradually from 3.47 g to 2.91 g (P < 0.01); moreover, as the peeling time increased from 20 to 25 s, the β-glucan content decreased greatly from 3.47 g to 2.28 g (P < 0.01) (Table 1). Compared with the normal control group, a peeling time of 20 s caused 16.13%
β-glucan loss, while a peeling time 25 s caused 34.29%
β-glucan loss. The above results, therefore, indicate that peeling times should not exceed 20 s, otherwise the peel-ing treatments could damage the aleurone layer and result in OR kernels with very low β-glucan levels.
Starch and protein are also nutritionally important for oat food. The OR kernels receiving a 20 s peeling treat-ment demonstrated significantly higher starch content compared with normal kernels (63.3 g vs 57.0 g, P < 0.01) (Table 1). On the other hand, while the protein level in OR kernels exposed to a 20 s peeling treatment tended to be higher than normal control (16.02 g vs. 15.88 g), there was no significant difference (P > 0.01) (Table 1). In addition, the 20 s peeling treatment pro-duced OR kernels with significantly higher kernel whiteness than the normal kernels (79.9 vs 77.0, P < 0.01). All the above results point to the conclusion that 20 s peeling treatments can efficiently reduce kernel lipase activity, avoid great β-glucan loss, and markedly
increase kernel whiteness, lipid levels and starch levels in OR kernels. In light of these results, we suggest that 20 s is the optimal peeling time for the production of OR kernels.
3.2. Effects of Steaming and Roasting on the Levels of β-Glucan, Lipid, Protein and starch in OR kernels
We previously reported that steaming and roasting treatments did not show significant effects on oat
β-glucan and lipid levels in normal oat kernels [4]. In the current study, we tested the effects of the same steaming and roasting treatments on the levels of β-glucan, lipid, protein and starch in OR kernels. We did not find sig-nificant differences (P > 0.01) in the levels of β-glucan, lipid, protein and starch between any of the deactivation groups and the control group (Table 2).
This indicated that the steaming and roasting treat-ments did not cause significant nutritional loss in OR kernels.
3.3. Effects of Steaming and Roasting on the Lipase and Peroxidase Activities in OR Kernels
The present study demonstrated that NPS, AS and IR treatments exterminated lipase and peroxidase activities in VAO-2 OR kernels, while HAR treatments failed to exterminate lipase and peroxidase activities, leaving 19.8
[image:3.595.84.511.483.590.2]μ·mol·g–1·h–1 lipase activity and detectable peroxidase activity in VAO-2 OR kernels (Table 2). The results also indicated that IR, NPS, and AS treatments were effective
Table 1. Starch level, protein level, β-glucan level and whiteness of OR kernels with different peeling time.
No. Peeling time (s) β-glucan level (g) Starch level (g) Protein level (g) Whiteness
1 0 3.47 ± 0.16a 57.0 ± 1.2b 15.88 ± 0.26a 77.0 ± 2.8c
2 5 3.53 ± 0.13a 60.6 ± 1.7ab 16.08 ± 0.19a 78.7 ± 3.5b
3 10 3.24 ± 0.08b 61.7 ± 0.8ab 15.96 ± 0.35a 79.6 ± 3.3ab 4 15 2.90 ± 0.10c 63.7 ± 2.0a 15.93 ± 0.14a 79.5 ± 3.8ab 5 20 2.91 ± 0.32c 63.3 ± 1.1a 16.02 ± 0.26a 79.9 ± 2.8ab 6 25 2.28 ± 0.25f 63.2 ± 1.5a 16.02 ± 0.18a 79.9 ± 3.0ab
7 30 2.31 ± 0.09f 63.6 ± 0.5a 15.82 ± 0.41a 80.7 ± 3.1a
8 35 3.02 ± 0.33c 62.8 ± 3.0a 15.86 ± 0.30a 80.4 ± 4.1a
9 40 2.57 ± 0.27e 63.0 ± 1.3a 15.99 ± 0.25a 80.8 ± 2.9a
[image:3.595.83.515.632.696.2]10 45 2.78 ± 0.08d 65.1 ± 0.9a 16.00 ± 0.18a 80.8 ± 3.1a Note: values in a column followed by different letters were significantly different at P < 0.01.The results of the levels of β-glucan, starch, and protein were presented as β-glucan, starch, and protein contents in grams per 100 grams OR kernels.
Table 2. Nutritional components and enzyme activities in OR kernels with or without deactivation treatments.
Treatments β-glucan level (g) Lipid Level (g) Starch level (g) Protein level (g) Lipase activity (μ·mol·g–1·h–1)
Control 3.52 ± 0.39a 6.60 ± 0.07a 68.1 ± 2.2a 16.15 ± 0.09a 188.0 ± 1.8a NPS 2.72 ± 0.33a 6.31 ± 0.11a 62.7 ± 0.5a 15.94 ± 0.32a 0
AS 3.33 ± 0.21a 6.81 ± 0.10a 60.7 ± 1.4a 15.92 ± 0.17a 0 HAR 2.91 ± 0.32a 7.20 ± 0.19a 66.8 ± 1.5a 16.11 ± 0.13a 19.8 ± 1.4b
IR 3.16 ± 0.29a 6.85 ± 0.09a 66.1 ± 1.2a 16.38 ± 0.25a 0
Copyright © 2011 SciRes. Openly accessible athttp://www.scirp.org/journal/AS/ methods for the enzyme deactivation of VAO-2 OR
ker-nels. What should be mentioned here is that the effects of IR treatments on normal kernels and OR kernels of dif-ferent oat varieties were variable. We previously found that IR treatments could exterminate the lipase and per-oxidase activities in VAO-2 naked oat kernels [4]. We found in the present study that the VAO-2 OR kernels exposed to 20 s peeling treatments also showed zero li-pase and peroxidase activities after the same IR treat-ments. Interestingly, the data in our lab from VAO-3 and VAO-10, another two Canadian naked oat varieties, showed that IR treatments (18 s) exterminated lipase and peroxidase activities in peeled kernels (unpublished data). However, IR treatments (18 s) could not completely de-activate the enzyme activities in VAO-3 and VAO-10 normal kernels, with 4 and 14 μ·mol·g–1·h–1 lipase activi-ties remained respectively [4]. The results therefore im-plied that, for some, though not all, oat varieties, peeling pretreatments are essential to the successful enzyme de-activation of subsequent IR treatments.
3.4. Effects of Steaming and Roasting on the Pasting Properties of OR Flour
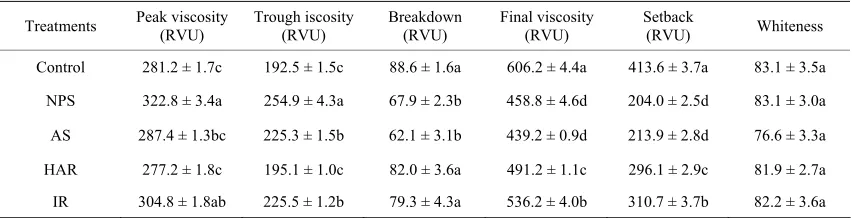
We also examined the effects of steaming and roasting treatments on the flour pasting properties of OR kernels, because these properties are important for the processing functionality of OR foods. The results showed that the peak viscosity and final viscosity of the OR kernels tested were 281.2 and 606.2 RVU respectively (Table 1), and that the levels were significantly higher (P < 0.01) than those of the normal kernels tested (240.9 and 466.7 RVU, respectively). There were two possible reasons for the significant differences between the normal kernels and the OR kernels. The first was higher starch levels could have caused higher peak and final viscosities. The second was that the significant differences (P < 0.01) in the β-glucan level between the OR kernels and normal kernels could have resulted in the differences in the pasting behaviors between the two kernels. Some have reported that the level of β-glucan seems to affect the
pasting behaviours of flour and starch in cereals. Sy-mons and Brennan (2004) [12] reported that a substitu-tion of 5% wheat starch with barley β-glucan decreased peak viscosity, final viscosity, and breakdown values in comparison to the control starch (P < 0.05). Yoo and Lee (2007) [13] reported that the incorporation of β-glucan into wheat flour and starch significantly decreased peak and final viscosities.
Our previous study showed that steaming and roasting treatments improved the starch gelatinization properties in normal kernels [4]. The current study demonstrated that the same steaming and roasting treatments signifi-cantly decreased the final viscosity and setback values in comparison to the control group (P < 0.01) (Table 3). It is believed that heat moisture treatments can increase the content of resistant starch, and that the final viscosity of cereal flour can be significantly reduced by adding re-sistant starch to the flour [14,15]. We therefore suggest that the roles of steaming and roasting treatments on the level of resistant starch in both OR and normal kernels should be studied.
3.5. The Effects of Steaming and Roasting on the Whiteness of OR Kernels
In China, OR kernels are mixed with rice kernels and consumed together as food. OR kernels with higher whiteness are closer to the color of rice kernels, and can thus provide the products with a better appearance. In the current research, the whiteness of the OR kernels were significantly higher than that of the normal oat kernels. The steaming and roasting treatments did not demonstrate significant effects on the whiteness of the OR kernels compared with the control group (P > 0.01).
4. CONCLUSIONS
[image:4.595.85.511.598.707.2]20 s was suggested as the optimal treatment time for the production of OR kernels, because it was posited that 20 s peeling treatments could significantly reduce kernel lipase activity, avoid great β-glucan loss, and increase
Table 3. Peak viscosity, trough viscosity, breakdown, final viscosity, setback and whiteness of oat rice kernels with or
without deactivation treatment.
Treatments Peak viscosity (RVU) Trough iscosity(RVU) Breakdown (RVU) Final viscosity(RVU) Setback (RVU) Whiteness
Control 281.2 ± 1.7c 192.5 ± 1.5c 88.6 ± 1.6a 606.2 ± 4.4a 413.6 ± 3.7a 83.1 ± 3.5a
NPS 322.8 ± 3.4a 254.9 ± 4.3a 67.9 ± 2.3b 458.8 ± 4.6d 204.0 ± 2.5d 83.1 ± 3.0a
AS 287.4 ± 1.3bc 225.3 ± 1.5b 62.1 ± 3.1b 439.2 ± 0.9d 213.9 ± 2.8d 76.6 ± 3.3a
HAR 277.2 ± 1.8c 195.1 ± 1.0c 82.0 ± 3.6a 491.2 ± 1.1c 296.1 ± 2.9c 81.9 ± 2.7a
IR 304.8 ± 1.8ab 225.5 ± 1.2b 79.3 ± 4.3a 536.2 ± 4.0b 310.7 ± 3.7b 82.2 ± 3.6a
X. Z. Hu et al. / Agricultural Sciences 2 (2011) 56-60 60
kernel whiteness, lipid levels, and starch levels in OR kernels. The steaming and roasting treatments did not cause nutritional loss to OR kernels in terms of the levels of β-glucan, lipid, protein or starch. In addition, it was found that the IR treatments could exterminate the lipase and peroxidase activities and significantly reduced the final viscosity and setback value of OR kernels.
5. ACKNOWLEDGEMENTS
We thank Dr. Judith R. Fr´egeau, Dr. Jianqiang Zhou, and Dr. Vern D. Burrows for their support and encouragement in carrying out this work. We appreciate Dr. Todd Smith, Dr. Yin Ma, and Ms. Valerie Senyk for their help to proofread the manuscript. The research was financially supported by the Public Industry Project from the Ministry of Agriculture (nyhyzx07-009), Northwest A&F University Key Re-search Project for Young Staff, the Earmarked Fund for Chinese Agri-culture research System for Oat and Buckwheat (grant number: CARS- 08-D1), and the Agriculture Development Project from Yangling Demonstration Zone.
REFERENCES
[1] Youngs, V.L. (1978) Oat lipids. Cereal Chemistry, 55,
591-597.
[2] Urquhart, A.A., Altosaar, I., Matlashewski, G.J. and Sa-hasrabudhe, M.R. (1983) Localization of lipase activity in oat grains and milled oat fractions. Cereal Chemistry,
60, 181-183.
[3] Urquhart, A.A., Brumell, C.A., Altosaar, I., Matlashewski, G.J. and Sahasrabudhe, M.R. (1984) Lipase activity in oats during grain maturation and germination. Cereal Chemistry, 61, 105-108.
[4] Hu, X.Z., Xing, X.H. and Ren, C.Z. (2010) The effects of steaming and roasting treatments on β-glucan, lipid and starch in the kernels of naked oat (Avena nuda). Journal of the Science of Food and Agriculture, 90, 690-695.
[5] Hu, X.Z., Wei, Y.M., Ren, C.Z. and Zhao, J. (2009) Rela-tionship between kernel size and shape and lipase activ-ity of naked oat before and after peeling treatment. Jour-nal of the Science of Food and Agriculture, 89, 1424-
1427.doi:10.1002/jsfa.3607
[6] Ames, N.P. and Rhymer, C.R. (2003) Development of a
laboratory-scale flaking machine for oat end products testing. Cereal Chemistry, 80, 699-702.
doi:10.1094/CCHEM.2003.80.6.699
[7] Zhang, D., Doehlert, D.C. and Moore, W.R. (1997) Fac-tors affecting and groat flour slurry viscosity. Cereal Chemistry, 74, 722-726.
doi:10.1094/CCHEM.1997.74.6.722
[8] Kwon, D.Y. and Rhee, J.S. (1986) A simple and rapid colorimetric method for determination of free fatty acids for lipase assay. Journal of the American Oil Chemists' Society, 63, 89-92.doi:10.1007/BF02676129
[9] Anderson, J.W., Spencer, D.B., Hamilton, C.C., Smith, S.F., Tietyen, J., Bryant, C.A. and Oeltgen, P. (1990) Oat bran cereal lowers serum total and LDL cholesterol in hypercholesterolemic men. The American Journal of Clinical Nutrition, 52, 495-499.
[10] Kestin, M., Moss, R., Clifton, P.M. and Nestel, P.J.J. (1990) Comparative effects of three cereal grains in plasma lipids, blood pressure, and glucose metabolism in mildly hypercholesterolemic men. The American Journal of Clinical Nutrition, 52, 661-666.
[11] Kirby, R.W., Anderson, J.W., Sieling, B., Rees, E.D., Chen, W.L., Miller, R.E. and Kay, R.M. (1981) Oat-bran intake selectively lowers serum low-density lipoprotein cholesterol concentration in hypercholesterolemic men.
The American Journal of Clinical Nutrition, 34, 824-829. [12] Symons, L.J. and Brennan, C.S (2004) The effect of bar-ley beta-glucan fiber fractions on starch gelatinization and pasting characteristics. Journal of Food Science, 69,
C257-C261.
[13] Yoo, M.S. and Lee, Y.T. (2007) Pasting properties of crude beta-glucan from spent brewer's yeast on wheat flour and starch. Food Science and Biotechnology, 16,
485-488.
[14] Kishida, T.R., Nogami, H.T., Himeno, S.W. and Ebihara, K.S. (2001) Heat moisture treatment of high amylose cornstarch increases its resistant starch content but not tts physiologic effects in rats. Journal of Nutrition, 131,
2716-2721.
[15] Higgins, J.A (2004) Resistant starch: Metabolic effects and potential health benefits. Journal of AOAC Interna-tional, 87, 761-768.