ORIGINAL ARTICLE
Proteomic analysis of the postsynaptic density implicates
synaptic function and energy pathways in bipolar disorder
M Föcking1, P Dicker2, LM Lopez1, M Hryniewiecka1, K Wynne3, JA English1, G Cagney3and DR Cotter1,4The postsynaptic density (PSD) contains a complex set of proteins of known relevance to neuropsychiatric disorders such as schizophrenia and bipolar disorder. We enriched for this anatomical structure in the anterior cingulate cortex of 16 bipolar disorder samples and 20 controls from the Stanley Medical Research Institute. Unbiased shotgun proteomics incorporating label-free quantitation was used to identify differentially expressed proteins. Quantitative investigation of the PSD identified 2033 proteins, among which 288 were found to be differentially expressed. Validation of expression changes of DNM1, DTNA, NDUFV2, SEPT11 and SSBP was performed by western blotting. Bioinformatics analysis of the differentially expressed proteins implicated metabolic pathways including mitochondrial function, the tricarboxylic acid cycle, oxidative phosphorylation, protein translation and calcium signaling. The data implicate PSD-associated proteins, and specifically mitochondrial function in bipolar disorder. They relate synaptic function in bipolar disorder and the energy pathways that underpin it. Overall, ourfindings add to a growing literature linking the PSD and mitochondrial function in psychiatric disorders generally, and suggest that mitochondrial function associated with the PSD is particularly important in bipolar disorder.
Translational Psychiatry(2016)6,e959; doi:10.1038/tp.2016.224; published online 29 November 2016
INTRODUCTION
The postsynaptic density (PSD) is a highly organized structure attached to the postsynaptic neuronal terminal. It comprises a complex network of cytoskeletal scaffolding and signaling proteins that facilitate the movement of receptor and signaling complexes. The PSD is critical for normal neurotransmission and synaptic plasticity1through the modulation of signaling mechan-isms involvingN-methyl-D-aspartate,α -amino-3-hydroxy-5-methyl-4-isoxazolepropionic acid and metabotropic glutamate receptors. Synaptic plasticity is implicated in neuropsychiatric disorders,2–5 and thus the PSD is implicated.6–13 However, although known constituents of the PSD have been implicated in bipolar disorder and schizophrenia at both gene14–16 and protein expression
levels,14,17–20 no major findings are reported to contribute to bipolar disorder risk.21,22As synaptic plasticity is highly dependent on mitochondrial function,23 energy metabolism acting at the level of the PSD may underpin PSD dysfunction in bipolar disorder and indeed other neuropsychiatric disorders.
Mass spectrometry-based proteomic methods have the ability to reliably identify and quantify several thousands of disease-associated protein changes derived from complex anatomical structures. The reliable quantitation of low-abundance proteins within specific cellular compartments until recently has been challenging and this has led to a shift in the use of
pre-fractionation enrichment methods combined with mass
spectrometry-based proteomic techniques. This approach has successfully yielded a detailed characterization of the PSD proteome in rodents and in healthy postmortem human brain tissue.24 The differential expression of the PSD in schizophrenia compared with controls wasfirst reported recently by our team25
highlighting altered pathways of endocytosis, long-term potentia-tion and calcium signaling in schizophrenia. The identified PSD proteome (including a gene critical to synaptic plasticity—MAPK3) was significantly associated in gene set enrichment analysis with schizophrenia, validating independent reports of PSD enrichment in schizophrenia. Furthermore, numerous mitochondrial proteins were differentially expressed in the PSD schizophrenia proteome and these changes were not associated with antipsychotic administration.25 This was in keeping with previous studies of the brain in neuropsychiatric diseases.26–36Thesefindings are of relevance to bipolar disorder, considering the known overlap with schizophrenia in terms of clinical presentation, genomic, structural imaging,37 transcriptome and protein expression.26 To date, no study has assessed the protein expression of the PSD in the cortex in bipolar disorder compared with controls.
In the current investigations, we enriched for the PSD in the anterior cingulate cortex (ACC) in bipolar disorder and in control human brain samples. This is a candidate brain region in both bipolar disorder and schizophrenia.38–41We undertook a label-free liquid chromatography–mass spectrometry (LC-MS/MS) investiga-tion to identify disease-associated changes in protein expression within the PSD in bipolar disorder compared with controls. We hypothesized three findings. First, that the altered protein expression would overlap with that observed in schizophrenia PSD.25Second, that a distinct pattern of altered protein expression would emerge in keeping with genomic and mRNA expression bipolar disorder studies. Third, that mitochondria-associated proteins would be differentially expressed in this PSD-enriched fraction in bipolar disorder (based on our own and other recent
1
Department of Psychiatry, Royal College of Surgeons in Ireland, Education and Research Centre, Beaumont Hospital, Dublin, Ireland;2
Departments of Epidemiology and Public Health, Royal College of Surgeons in Ireland, Dublin, Ireland;3
Proteome Research Centre, UCD Conway Institute of Biomolecular and Biomedical Research, School of Medicine and Medical Sciences, University College Dublin, Dublin, Ireland and4
Department of Psychiatry, Beaumont Hospital, Dublin, Ireland. Correspondence: Dr M Föcking or Professor DR Cotter, Department of Psychiatry, Royal College of Surgeons in Ireland, Education and Research Centre, Education and Research Centre, Dublin 9, Ireland.
E-mail: [email protected] or [email protected]
Received 1 April 2016; revised 26 September 2016; accepted 28 September 2016
studies implicating mitochondrial function in major psychiatric disorders).
MATERIALS AND METHODS Samples
Human postmortem brain tissue of the supragenual (BA24) ACC was obtained from the Stanley Medical Research Institute’s Array Collection (www.stanleyresearch.org). The series consists of 105 subjects, including 35 schizophrenia, 35 bipolar disorder and 35 control cases. Information on prescribed psychotropic medication is provided by the Stanley Medical Research Institute.
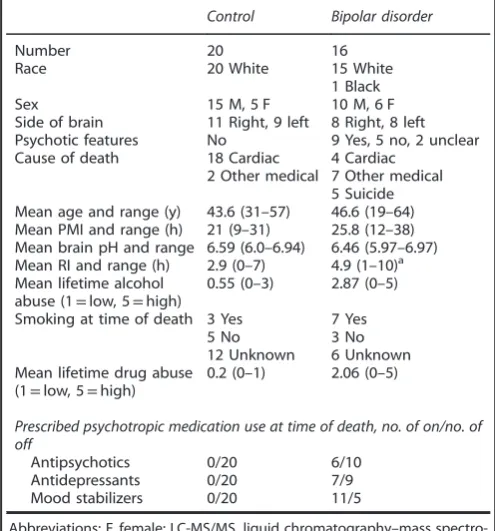
A subset of 20 bipolar disorder samples and 20 control samples were selected from the series to match as closely as possible for age and tissue pH.35,42 Table 1 provides detailed demographic information on these
subjects. To obtain enough tissue for the enrichment protocol, two samples were subpooled based on the Euclidean distance (Supplementary Table 1). Investigators were blind to group identity until completion of the data analysis. Ethical approval (Application No. REC080) was granted by the Royal College of Surgeons in Ireland Research Ethics Committee. Two subpooled samples were subsequently excluded from the bipolar disorder group as we were unable to obtain enough PSD protein for our analyses.
Comparing the PSD in ACC in bipolar disorder and controls
The enrichment for the PSD was undertaken using methods established previously and recently validated for postmortem brain material.24In brief, the method involves differential sucrose centrifugation and further fractionations by Triton X-100 extractionfirst at pH 6, and then at pH 8, leading to the separation of the PSD fraction (for details see Supplementary Methods and our previous work25).
Sample preparation for mass spectrometry
Fifty micrograms of protein from each homogenate was denatured in 10μl 2% RapiGest solution (Waters, Elstree, UK) at 80 °C for 10 min. Samples were subsequently reduced in the presence of 50 mM TCEP (tris2-carboxyethyl-phosphine) (Sigma Aldrich, Wicklow, Ireland) at 60 °C for 60 minutes and alkylated in the dark with 200 mM iodoacetic acid acid (Sigma Aldrich). Protein was digested with 5μg of sequence grade modified trypsin (Promega, Southampton, UK), in a 37 °C shaking incubator for 16 hours. Digestion was stopped and the RapiGest precipitated with formic acid (0.1% v/v). After digestion, peptides were resuspended in 0.5% trifl uor-oacetic acid, dried in an Eppendorf Vacufuge (Eppendorf, Hauppauge, NY, USA) and desalted using ZipTips (Millipore, Bedford, MA, USA).
Mass spectrometry analysis
Label free LC-MS was performed on a Thermo Scientific Q Exactive mass spectrometer connected to a Dionex Ultimate 3000 (RSLCnano) chromato-graphy system. Tryptic peptides were resuspended in 0.1% formic acid. Each sample was loaded onto a fused silica emitter (75μm ID, pulled using a laser puller (Sutter Instruments P2000)), packed with Reprocil Pur C18 (1.9μm) reverse phase media and was separated by an increasing acetonitrile gradient over 120 minutes at aflow rate of 250 nL/min. The mass spectrometer was operated in positive ion mode with a capillary temperature of 320 °C, and with a potential of 2300V applied to the frit. All data was acquired with the mass spectrometer operating in automatic data dependent switching mode. A high resolution (70,000) MS scan (300–1600 m/z) was performed using the Q Exactive to select the 12 most intense ions prior to MS/MS analysis using HCD.
Data processing and analysis
We collected two types of mass spectrometry data in the experiments. It is formally a‘shotgun’experiment and the collected tandem mass spectra were used to identify the proteins. The parent ion signal (MS1 scan) on high resolution instruments such as the Q Exactive used is widely used to calculate protein abundance in so-called ‘label-free’ proteomics experiments.43The signal for each peptide derived from a given protein
is integrated over time (the time it takes to enter the instrument via HPLC), and the summed signals are used to estimate the relative abundance of each protein. To analyze the data, we used the MaxQuant programme specifically for label-free experiments using high resolution instruments supported by Andromeda as a database search engine for peptide identification.44This program has several statistical control steps to ensure
that only high quality reliable ion signals are accepted.
Label free quantitation (LFQ) was performed as previously described.45
Carbamidomethylation was defined as a fixed modification, while oxidation and acetylation of the protein N-terminus were defined as variable modifications. Only peptides with seven or more amino acid residues were allowed for identification. Additionally, at least one unique peptide was required to identify a protein. The cut off for false discovery rate for peptide and protein identification was set to 0.01. The label free algorithm takes the maximum number of identified peptides between any two samples and compares the intensity of these peptides to determine peptide ratios.
LFQ intensity values were used for protein quantification across the groups.
Raw LFQ intensities were extracted from the MaxQuant software and log base 2 transformed prior to analysis to eliminate distributional skew and to give approximate normality. To avoid bias associated with protein under-representation between groups, proteins were excluded in cases where there was less than 50% availability of the LFQ intensities in each biological group. After data filtering, 45872 LFQ values remained. Regression normalization was performed to remove technical variation between samples.46
Statistical analysis
Protein intensities were screened for anomalous and missing data before log transformation (log base 2) and quantile regression normalization. A two-sample t-test (two-sided) analysis was performed on each protein comparing bipolar disorder with controls.
Significance testing was performed at the 5% level, and a false discovery rate (FDR)47of 5% was used toflag those protein identifications deemed
[image:2.595.45.293.404.670.2]statistically significant after adjustment for multiple comparisons. Fold changes were obtained from an exponentiation (power of 2) of the Table 1. Demographic information for the 36 samples used for
analyzing protein expression by LC-MS/MS in the anterior cingulate cortex
Control Bipolar disorder
Number 20 16
Race 20 White 15 White
1 Black
Sex 15 M, 5 F 10 M, 6 F
Side of brain 11 Right, 9 left 8 Right, 8 left
Psychotic features No 9 Yes, 5 no, 2 unclear
Cause of death 18 Cardiac
2 Other medical
4 Cardiac 7 Other medical 5 Suicide Mean age and range (y) 43.6 (31–57) 46.6 (19–64) Mean PMI and range (h) 21 (9–31) 25.8 (12–38) Mean brain pH and range 6.59 (6.0–6.94) 6.46 (5.97–6.97) Mean RI and range (h) 2.9 (0–7) 4.9 (1–10)a Mean lifetime alcohol
abuse (1=low, 5=high)
0.55 (0–3) 2.87 (0–5)
Smoking at time of death 3 Yes 7 Yes
5 No 3 No
12 Unknown 6 Unknown
Mean lifetime drug abuse (1=low, 5=high)
0.2 (0–1) 2.06 (0–5)
Prescribed psychotropic medication use at time of death, no. of on/no. of off
Antipsychotics 0/20 6/10
Antidepressants 0/20 7/9
Mood stabilizers 0/20 11/5
difference in group means. Fold changes o1 were inverted (−1/fold change) to present a consistent scale of measurement.
Family-wise analysis was performed for two families of proteins. Mitochondrial dysfunction and the septin family were investigated as they were highlighted from pathway analysis and visual inspection, respectively. A family-wiseP-value for the difference between groups was obtained from a nested model (analysis of variance) of the corresponding proteins (n= 39 mitochondrial dysfunction,n= 9 septins).
The management of data and statistical analyses were carried out with the SAS version 9.2 statistical software (SAS Institute, Cary, NC, USA) and R version 3.1 statistical software (R Foundation for Statistical Computing, Vienna, Austria).
Classification offindings
See Supplementary Methods for methods of classification of protein changes using DAVID NIH, Search Tool for the Retrieval of Interacting Genes and Ingenuity Pathway Analysis.
Validation of differentially expressed proteins
Proteins were selected for validation based on their degree of differential expression and membership of the main processes and protein families implicated by our current proteomic analysis and comparison with gene expression literature,29,48 namely mitochondrial function (NDUFV2 and
[image:3.595.40.546.83.239.2]SSBP), endocytosis (DNM1 and DTNA) and a member of the Septin family Table 2. Topfive significant canonical pathways identified among the 288 differentially expressed proteins (t-test;Po0.007) between bipolar disorder and control samples
Canonical pathway Proteins P-value Ratio
Oxidative phosphorylation ATP5A1, ATP5B, ATP5C1, ATP5F1, ATP5H, ATP5J2, ATP5O, CYC1, CYCS, MT-ND4, MT-ND5, NDUFA2, NDUFA5, NDUFA6, NDUFA7, NDUFA8, NDUFA9, NDUFA10, NDUFA12, NDUFA13, NDUFB1, NDUFB3, NDUFB4, NDUFB9, NDUFB11, NDUFS1, NDUFS2, NDUFS3, NDUFS5, NDUFS6, NDUFV1, NDUFV2, UQCR10, UQCRC2, UQCRH, UQCRQ
1.06E−39 36/109 (0.33)
Mitochondrial dysfunction ATP5A1, ATP5B, ATP5C1, ATP5F1, ATP5H, ATP5J2, ATP5O, CYC1, CYCS, GPD2, GPX4, MT-ND4, MT-ND5, NDUFA2, NDUFA5, NDUFA6, NDUFA7, NDUFA8, NDUFA9, NDUFA10, NDUFA12, NDUFA13, NDUFB1, NDUFB3, NDUFB4, NDUFB9, NDUFB11, NDUFS1, NDUFS2, NDUFS3, NDUFS5, NDUFS6, NDUFV1, NDUFV2, PDHA1, PRDX3, UQCR10, UQCRC2, UQCRH, UQCRQ
2.57E−37 40/171 (0.234)
EIF2 signaling EIF2B3, EIF2S3, EIF3C, EIF4G2, PDPK1, PPP1CB, PPP1CC, RPL3, RPL6, RPL7, RPL8, RPL9, RPL12, RPL18, RPL13A, RPS2, RPS5, RPS10
1.62E−10 18/185 (0.097)
Calcium signaling ATP2A2, ATP2B2, CAMK2B, CAMKK1, ITPR1 LETM1, PPP3CA, PPP3R1, PRKACB, PRKAR2B, RYR2, SLC8A2, TPM1, TPM3
2.64E−07 14/178 (0.079)
TCA cycle CS, DLD, DLST, IDH3B, IDH3G, MDH2 6.36E−07 6/23 (0.26)
Pathways were identified using Ingenuity Pathway Analysis (Qiagen, Redwood City, CA, USA). Significant pathways are determined using the Fisher's exact test to compare the number of proteins that are most significantly perturbed in the data.
Figure 1. Forest plots of pathway analysisfindings. The topfive significant canonical pathways identified among the false discovery rate (FDR)-positive 288 differentially expressed proteins between bipolar disorder and control samples with fold changes and 95% confidence intervals are presented.
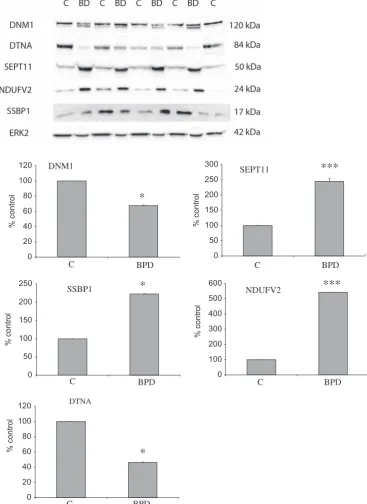
[image:3.595.49.542.269.574.2]0 50 100 150 200 250 300
% control
0 20 40 60 80 100 120
% control
0 20 40 60 80 100 120
% control
0 100 200 300 400 500 600
% con
tro
l
0 50 100 150 200 250
% con
tro
l
NDUFV2 SEPT11
DTNA
DNM1
SSBP1
*
***
***
*
*
C
BPD
C C
C C
BPD
BPD BPD
[image:4.595.118.486.61.566.2]BPD
(SEPT11). Validation was undertaken using antibodies to these proteins in the same above-mentioned bipolar disorder and control samples from the Stanley Foundation Array series and animal model of haloperidol-treated rats. For further details on the procedure and specificity of the antibodies used for this study see Supplementary Methods.
RESULTS
Identification of PSD proteins and pathways dysregulated in schizophrenia
Thirty-six subjects pooled into 18 samples (8 pairs bipolar disorder and 10 pairs of control) were studied (Table 1). A total of 2867 proteins were identified by tandem mass spectrometry (Q-Exactive) after data input to the MaxQuant bioinformatics software (Max-Planck Institute for Biochemistry, Munich, Germany). Proteins were excluded if they were detected in less than 50% of samples from each group, leaving 2033 proteins for inclusion in thefinal statistical analysis (Supplementary Table 2).
Six hundred twenty proteins were differentially expressed in bipolar disorder compared with controls (P⩽0.05). Two hundred eighty-eight proteins were found to be significantly differentially expressed after correcting for multiple testing with FDRo0.05 (Supplementary Table 2 and Supplementary Figure 1).
We asked whether the 288 PSD proteins contained functionally related protein subsets. Five pathways were found to be significantly enriched when analyzed by Ingenuity Pathway Analysis: oxidative phosphorylation, mitochondrial dysfunction, EIF2 signaling, calcium signaling and the TCA cycle (Table 2 and Figure 1).
Furthermore, both the septin and mitochondrial dysfunction set of proteins were differentially expressed in a family-wise analysis (both P-values o0.0001). The overall fold change for the nine septins in the data set was 1.60, with a 95% confidence interval from 1.34 to 1.92. The 39 mitochondrial dysfunction proteins showed an overall fold change of 2.05 (95% confidence interval 1.57–2.67).
Confirmation of proteomicfindings
Validation using human samples. Validation was undertaken for proteins from different classes, namely mitochondrial function, endocytosis and septin family using western blotting for DNM1, DTNA, NDUFV2, SSBP1 and SEPT11 in the PSD-enriched samples from the Stanley Foundation Array series. See Figure 2 and Table 3 for the details of this validation work.
Validation using Haloperidol-treated rats. We previously explored the proteomic effect of antipsychotic medication (haloperidol) on
the PSD using a rat model of antipsychotic drug treatment.25Of the 26 proteins in the treatment group found to be statistically differentially expressed compared with controls, four were included in our list of significantly differentially expressed protein in the bipolar disorder PSD (Po0.05; FAM162A, MCCC1, RIN1 and mTOR), and one in our list of 288 FDR-corrected proteins in the bipolar disorder PSD (FAM162A), and also altered in the same direction. These findings suggest that differential expression of these proteins may be drug-related. However, new western blot analyses for thefindings in this study demonstrated that DNM1, DTNA, NDUFV2, SEPT11 and SSBP1 were not significantly altered in rats treated with haloperidol (Table 3), indicating that the differential expression of these latter proteins in bipolar disorder PSD is not antipsychotic treatment-related. Overall, as the majority of expression changes observed by us in human samples were not seen in the rat antipsychotic model, a purely pharmacological explanation for the majorityfindings seems less likely (albeit using a different species, and a single antipsychotic compound).
Comparison with schizophrenia PSDfindings
We compared the abovefindings with the previous data obtained from the schizophrenia PSD samples25 (LTQ ORBITRAP, see Supplementary Tables 3 and 4 for details of overlapping proteins and pathways). Taking all 143 differentially expressed schizo-phrenia PSD proteins into consideration (Po0.05), we found an overlap of 54.5% with the current bipolar PSD differentially expressed data set (78/143), indicating a shared pathophysiology in keeping with past genetic and proteomic49investigations.
Mitochondrialfindings using MitoCarta
As proteins linked to‘mitochondrial dysfunction’were prominent in the list of differentially expressed proteins in the current study, we asked whether the set of 288 proteins were more likely to have a mitochondrial location in the cell.
Using MitoCarta (www.broadinstitute.org/pubs/MitoCarta/)50 we found 97 of the 288 differentially expressed proteins (FDR) as having a mitochondrial localization (Supplementary Table 5).
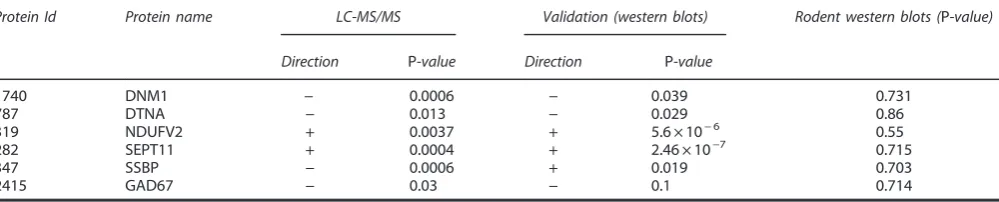
[image:5.595.46.546.77.178.2]There was an over-representation of mitochondrial proteins differentially expressed within the PSD proteome of bipolar disorder compared with controls (according to MitoCarta, Po0.01 Fisher’s Exact test). As a group, mitochondrial proteins were generally upregulated (Figure 1 and Supplementary Table 5 (83/97)). Overexpression of the mitochondrial-associated protein NDUFV2 was confirmed by western blotting (see validation work). Table 3. Summary of validation work
Protein Id Protein name LC-MS/MS Validation (western blots) Rodent western blots (P-value)
Direction P-value Direction P-value
1740 DNM1 − 0.0006 − 0.039 0.731
787 DTNA − 0.013 − 0.029 0.86
319 NDUFV2 + 0.0037 + 5.6 × 10⁻⁶ 0.55
282 SEPT11 + 0.0004 + 2.46 × 10⁻⁷ 0.715
347 SSBP − 0.0006 + 0.019 0.703
2415 GAD67 − 0.03 − 0.1 0.714
Abbreviations: LC-MS/MS, liquid chromatography–mass spectrometry; PSD, postsynaptic density. Validation was undertaken using western blot analysis for DNM1, DTNA, NDUFV2, SEPT11 and SSBP1 in the PSD-enriched samples from the Stanley Foundation Array series. In keeping with our LC-MS/MS experiments, DNM1 and DTNA1 expression was reduced, and SEPT11 and NDUF2 were found to be increased. SSBP was found to be decreased in the MS data but increased by western blotting. This most probably is due to the antibody recognizing different/all isoforms of the protein. Western blot analyses demonstrated that DNM1, DTNA, NDUFV2, SEPT11 and SSBP1 were not significantly altered in rats treated with haloperidol.
DISCUSSION
In this work, we used proteomic methods to study the PSD in bipolar disorder. We provide robust data implicating this multi-protein complex in bipolar disorder. Specifically, we enriched for the PSD of the ACC in bipolar disorder and control samples and used mass spectrometry-based proteomic methods to character-ize differential expression of the PSD-associated proteins. Overall, 288 proteins were found to be significantly differently expressed following FDR out of a total of 2033 protein identified and suitable for group comparison. The most notable proteomic changes involved those proteins with roles in mitochondrial functions and tricarboxylic acid cycle, oxidative phosphorylation and the processes of protein translation through EIF2 signaling, long-term potentiation, calcium signaling and endocytosis. All of these processes are important in synaptic plasticity. Together, these findings provide support for the view that abnormal protein expression within the PSD contributes to the pathophysiology of bipolar disorder through effects on synaptic plasticity.
The potential biological importance of the PSD to neuropsy-chiatric illness is high. The PSD is an electron-dense multiprotein complex under the postsynaptic membrane, which is readily identified by electron microscopy. It has been characterized previously in the rodent and human cortex using proteomic methods, and it contains many neuroreceptors such asN -methyl-D-aspartate, α-amino-3-hydroxy-5-methyl-4-isoxazolepropionic acid and metabotropic glutamate receptors, which influence long-term potentiation51 and synaptic plasticity, and which are implicated schizophrenia and bipolar disorder. In keeping with our current data, previous studies characterizing the PSD have shown that in addition to numerous neuroreceptors it contains many proteins associated with mitochondrial function, protein transla-tion, long-term potentiatransla-tion, calcium signaling and endocytosis. The PSD role in synaptic neurotransmission thus extends beyond structural components of receptor signaling into roles in which synaptic function is dependent such as energy metabolism52and
protein translation23 and calcium signaling.53To our knowledge, no previous study has enriched for the PSD in bipolar disorder and assessed its differential protein expression compared with controls. Here, for we believe thefirst time, we demonstrate the importance of processes that underpin synaptic plasticity and mitochondrial functions in the bipolar disorder PSD proteome.
The findings reported here are relevant to the previous literature, implicating these processes in neuropsychiatric dis-orders, in particular schizophrenia. Our team recently applied this method to study the PSD in the ACC in schizophrenia and observed altered expression of proteins involved in endocytosis, long-term potentiation and calcium signaling.25Thesefindings are
consistent with previous gene and protein expression studies of schizophrenia and, although to a lesser extent, bipolar disorder.49 Reduced expression of two proteins centrally involved in
clathrin-mediated endocytosis, namely Dynamin1 and AP2, were
described in the schizophrenia PSD. Interestingly, both these proteins were found to be dysregulated in the current study, arguing that the process of clathrin mediated endocytosis is disturbed in major psychiatric disorder. The processes of long-term potentiation and calcium signaling (see Table 2 and Supplementary Table 6) were also implicated in the PSD in both schizophrenia and the current study of bipolar disorder. This is in keeping with previous studies and a shared role of these processes inN-methyl-D-aspartate receptor function and synaptic
plasticity.51We previously observed altered expression of proteins with known roles in N-methyl-D-aspartate function, and in the
current study we have observed significant downregulation of ARFGAP, PLP1, SHANK3, CAMK2B, SYNPO and PRDX1 and upregulation of AMPH. The mitochondrial-related proteins (ATP5H, SSBP1, SLC25A4 and NDUFV2) previously shown to be
differentially expressed in the PSD in schizophrenia were also differentially expressed in the PSD in bipolar disorder.
Beyond our hypothesized findings, we observed highly
significant upregulation for each Septin 3, 5, 7, 8, 9 and 11. Septins have roles in dendritic spine morphology,54myelination,55 synaptic vescicle fusion,56membrane curvature57and cytoskeletal dynamics, which has been implicated in schizophrenia.58Septin 5, 6 and 11 specifically have been implicated in schizophrenia and bipolar disorder previously in keeping with the proposed synaptic–dendritic basis to the disorders.59
It is informative to place the differentially expressed bipolar disorder proteome reported here with current genomic literature. First, there is a 42% overlap between our study and a highly enriched functionally related PSD gene set reported in an integrative genomic study in bipolar disorder brain samples (17/40 proteins)14(see Supplementary Table 7 for details of these findings).
Second, three of our differentially expressed proteins over-lapped with the nine genes that were reported in a pathway meta-analysis of bipolar disorder and showed differential expression in the dorsolateral prefrontal cortex in bipolar disorder patients:48 inositol 1,4,5-trisphosphate receptor type 1 (Po0.005, overlap with ITPR2 isoform of 65% as determined by BLAST analysis), dystrobrevin alpha (DTNA, Po0.05) and neurotrophic tyrosine kinase receptor.
Third, Konradiet al.29identified 43 genes altered at the mRNA level in the hippocampus in bipolar disorder patients. We have shown that 56% of those were also dysregulated in our differentially expressed bipolar disorder proteome reported here (see Supplementary Table 8 for details). Furthermore, the PSD is implicated with schizophrenia through several genome-wide association and whole-exome-sequencing studies. However, genome-wide association studies and pathway analysis of genome-wide association studies data from the Psychiatric Genomics Consortium have not identified PSD-associated genes in their primaryfindings as contributing to bipolar disorder risk. The lack offindings may be because of sample size differences between schizophrenia and bipolar disorder genome-wide association studies, and we wait with anticipation for the next installment from the Psychiatric Genetics Disorder on Bipolar Disorder, promising samples of420 000 cases. Studies to date have implicated histone methylation,21cAMP signaling,22nuclear mitochondrial genes,48 although there is mounting evidence for mitochondrial DNA variants in schizophrenia,60 and to a lesser degree in bipolar disorder. More robust evidence, which would have an impact on mitochondrial function, is derived from genetic studies pointing to the involvement of the calcium channels in bipolar disorder, and studies of peripheral cells from subjects with bipolar disorder have shown alteration in calcium dynamics and energy production.61 Energy production is a function of mito-chondria, and thus these changes are consistent with the current study.
potentiation of neurotransmitter release and synaptic plasticity.23
As the provision of an ATP supply power synapse-associated polyribosome complexes and clathrin-dependent endocytic machinery at postsynaptic sites, our observations of altered EIF2 signaling and endocytosis in the PSD in bipolar disorder could potentially be secondary to altered mitochondrial function. EIF2 signaling has been observed recently in two studies of schizophrenia-derived stem cells,63,64thus implicating the process of protein translation in both of the major psychosis. Thefindings raise the testable hypothesis that the major psychoses involve altered mitochondrial function at the level of the synapse that has an impact locally on protein translation and endocytosis, and so on altered synaptic plasticity. Altered trafficking patterns of mitochondria to postsynaptic densities may also contribute, and this possibility is supported by the observed altered expression in the current study of mitochondrial-trafficking proteins KIF1A, DynLL2 and the clathrin mediated endocytosis-associated protein Dynamin1. Further studies are warranted for a deeper under-standing of the mitochondrial proteins, and to test whether the mitochondrial changes are indeed primary, and the synaptic changes secondary, as there also is the possibility that this could be the opposite.
Our study has several strengths and weaknesses. We used proteomic technology to identify differentially expressed proteins within the PSD in bipolar disorder. With more sensitive mass spectrometers being developed, the differences and the amount of identifications have been improved. Whereas our previous set of schizophrenia PSD samples were run on a linear ion trap (LTQ Orbitrap (at the end of 2012)), for the current study we used a quadrupole mass filter (Q-Exactive). We confirmed the protein expression changes of a number of proteins that were broadly representative of the main implicated functional pathways and processes using western blotting. We confirmed altered expres-sion of proteins involved in clathrin mediated endocytosis, such as Dynamin1, Dystrobrevin (involved in the formation and stability of synapses), and the mitochondrial proteins NDUFV2 and SSBP; while NDUFV2 is involved in electron transfer, SSBP1 is involved in mitochondrial biogenesis and also confirmed Septin 11.
A further strength of our findings is the consistency of the direction of changes of proteins involved in several of the implicated pathways and processes. For example, 38 of the 39 mitochondria-associated proteins as shown by Ingenuity Pathway Analysis to be dysregulated in BPD were increased.
Postmortem studies have limitations that include the well-known confounds such as chronic exposure to neuroleptics, alcohol, tissue pH and postmortem delay that can confound these studies. We designed our study so that age, brain pH and sex were matched closely across groups. We could not account for the potential influence of medication effects, alcohol use, smoking or other recreational substance use, and future work will be needed to address these issues. In particular, it is known that antidepres-sants and smoking have effect on mitochondrial functions;50,65
however, the direction of these influences is inconclusive.66,67
In order to account for the potential effect of chronic exposure to neuroleptics in our bipolar disorder cases, we studied the PSD proteome of rats chronically exposed to haloperidol. Few changes were identified following this treatment, although four
proteins—FAM163A, RIN1, mTOR and MCCC1—shown to be
dysregulated in bipolar disorder were dysregulated in the same direction by haloperidol treatment, suggesting that these effects may have been drug treatment-related (see Supplementary Table 9). We also compared our findings with data from recently published articles of chronic treatment of rats with lithium or valproate.68–70Nanavatiet al.69used proteomic methods to assess the PSD-enriched hippocampus following chronic treatment with lithium or valproate. Overall, there was little overlap with our findings, although they did observe dysregulation of ANK3, IGSF8 and CAPZB in the same direction as observed by us, suggesting
that their findings may be drug treatment-related. Two other proteomic studies of the rat prefrontal cortex following chronic lithium or valproate treatment identified CNP, GAP43, MAP2, MAPRE2 and TCEB2 in the same direction as in the bipolar data set, indicating that thesefindings may be drug treatment-related (see Supplementary Table 9). However, we cannot fully confirm or exclude correlations within the patient group between the key proteins and medication as for this we would have to look at drug-naive patient samples that were not available to us. Previous studies are supportive of the view that mitochondrial hypofunc-tion may be induced by antipsychotic agents, although dendritic morphology71and mitochondrial gene expression27are reported
to be unchanged or largely reduced72 and mood stabilizers are considered to have a neuroprotective effect on mitochondria.30It
should also be appreciated that our understanding of the broader protein content of the PSD is based on proteomic studies of enriched samples and that the methods used can vary, leading to different PSD proteomes. The method used is seen as enrichment rather than a fractionation technique, and there is a possibility that the mitochondrial proteins in the PSD-enriched fraction might come from other cellular locations.
However, our PSD enrichment method is well published, and this along with our sensitive LC-MS/MS method yielded a PSD proteome, which is very similar to that described previously.
In conclusion, in this study, which is to our knowledge thefirst of its kind, we have identified and compared the unique set of proteins involved in the PSD in bipolar disorder. Our study provides unique insights into the disorder at the synaptic level and suggests that mechanisms involving altered mitochondrial function, protein translation, calcium signaling, endocytosis and septin function at the level of the PSD are involved in the pathophysiology of bipolar disorder. As these processes act in concert to support synaptic plasticity, they provide insights into the variety of processes that may be targeted in the search for novel treatments for the disorder.
CONFLICT OF INTEREST The authors declare no conflict of interest.
ACKNOWLEDGMENTS
Postmortem brains were donated by the Stanley Foundation Brain Bank Consortium courtesy of Llewellyn B Bigelow, Maree J Webste and staff. We thank the donors. We also thank Aisling McGrath for help with enrichments and characterization, Zhi Miin Ong, Nathalie Edmunds and Killian O’Connor for help with western blotting. Access to and use of mass spectrometry instrumentation and computing facilities at the Conway Institute is gratefully acknowledged. This work was supported by a Brain and Behaviour Research Foundation Award (MF), the Stanley Medical Research Institute and the Irish Health Research Board through a Health Research Award (to DC, GC and MF) and a Health Research Board Clinician Scientist Award (to DC).
REFERENCES
1 Bayes A, Collins MO, Croning MD, van de Lagemaat LN, Choudhary JS, Grant SG. Comparative study of human and mouse postsynaptic proteomesfinds high compositional conservation and abundance differences for key synaptic proteins.
PLoS One2012;7: e46683.
2 de Bartolomeis A, Buonaguro EF, Iasevoli F, Tomasetti C. The emerging role of dopamine-glutamate interaction and of the postsynaptic density in bipolar dis-order pathophysiology: implications for treatment.J Psychopharmacol2014;28: 505–526.
3 Forero DA, Herteleer L, De Zutter S, Norrback KF, Nilsson LG, Adolfsson Ret al.A network of synaptic genes associated with schizophrenia and bipolar disorder.
Schizophr Res2016;172: 68–74.
4 Inal-Emiroglu FN, Karabay N, Resmi H, Guleryuz H, Baykara B, Alsen Set al. Cor-relations between amygdala volumes and serum levels of BDNF and NGF as a neurobiological markerin adolescents with bipolar disorder.J Affect Disord2015;
182: 50–56.
5 Ohgi Y, Futamura T, Hashimoto K. Glutamate signaling in synaptogenesis and NMDA receptors as potential therapeutic targets for psychiatric disorders.Curr Mol Med2015;15: 206–221.
6 Bayes A, Collins MO, Galtrey CM, Simonnet C, Roy M, Croning MDet al.Human post-mortem synapse proteome integrity screening for proteomic studies of postsynaptic complexes.Mol Brain2014;7: 88.
7 Clinton SM, Meador-Woodruff JH. Abnormalities of the NMDA receptor and associated intracellular molecules in the thalamus in schizophrenia and bipolar disorder.Neuropsychopharmacology2004;29: 1353–1362.
8 Grant SG. Synaptopathies: diseases of the synaptome.Curr Opin Neurobiol2012;
22: 522–529.
9 Gupta DS, McCullumsmith RE, Beneyto M, Haroutunian V, Davis KL, Meador-Woodruff JH. Metabotropic glutamate receptor protein expression in the pre-frontal cortex and striatum in schizophrenia.Synapse2005;57: 123–131. 10 Hammond JC, McCullumsmith RE, Funk AJ, Haroutunian V, Meador-Woodruff JH.
Evidence for abnormal forward trafficking of AMPA receptors in frontal cortex of elderly patients with schizophrenia.Neuropsychopharmacology2010;35: 2110–2119. 11 Kenny EM, Cormican P, Furlong S, Heron E, Kenny G, Fahey Cet al.Excess of rare novel loss-of-function variants in synaptic genes in schizophrenia and autism spectrum disorders.Mol Psychiatry2014;19: 872–879.
12 Harrison PJ, Weinberger DR. Schizophrenia genes, gene expression, and neuro-pathology: on the matter of their convergence.Mol Psychiatry2005;10: 40–68. 13 Kristiansen LV, Patel SA, Haroutunian V, Meador-Woodruff JH. Expression of the
NR2B-NMDA receptor subunit and its Tbr-1/CINAP regulatory proteins in post-mortem brain suggest altered receptor processing in schizophrenia. Synapse
2010;64: 495–502.
14 Akula N, Wendland JR, Choi KH, McMahon FJ. An integrative genomic study implicates the post-synaptic density in the pathogenesis of bipolar disorder.
Neuropsychopharmacology2015;41: 886–895.
15 Fromer M, Pocklington AJ, Kavanagh DH, Williams HJ, Dwyer S, Gormley Pet al. De novomutations in schizophrenia implicate synaptic networks.Nature2014;506: 179–184.
16 Purcell SM, Moran JL, Fromer M, Ruderfer D, Solovieff N, Roussos Pet al.A polygenic burden of rare disruptive mutations in schizophrenia.Nature2014;506: 185–190. 17 Bayes A, van de Lagemaat LN, Collins MO, Croning MD, Whittle IR, Choudhary JS
et al.Characterization of the proteome, diseases and evolution of the human postsynaptic density.Nat Neurosci2011;14: 19–21.
18 Behan AT, Byrne C, Dunn MJ, Cagney G, Cotter DR. Proteomic analysis of mem-brane microdomain-associated proteins in the dorsolateral prefrontal cortex in schizophrenia and bipolar disorder reveals alterations in LAMP, STXBP1 and BASP1 protein expression.Mol Psychiatry2009;14: 601–613.
19 Funk AJ, McCullumsmith RE, Haroutunian V, Meador-Woodruff JH. Abnormal activity of the MAPK- and cAMP-associated signaling pathways in frontal cortical areas in postmortem brain in schizophrenia.Neuropsychopharmacology2012;37: 896–905.
20 Pennington K, Beasley CL, Dicker P, Fagan A, English J, Pariante CMet al. Pro-minent synaptic and metabolic abnormalities revealed by proteomic analysis of the dorsolateral prefrontal cortex in schizophrenia and bipolar disorder.Mol Psychiatry2008;13: 1102–1117.
21 Consortium NaPASoPG. Psychiatric genome-wide association study analyses impli-cate neuronal, immune and histone pathways.Nat Neurosci2015;18: 199–209. 22 Nithianantharajah J, Komiyama NH, McKechanie A, Johnstone M, Blackwood DH
St, Clair Det al.Synaptic scaffold evolution generated components of vertebrate cognitive complexity.Nat Neurosci2013;16: 16–24.
23 Mattson MP, Gleichmann M, Cheng A. Mitochondria in neuroplasticity and neuro-logical disorders.Neuron2008;60: 748–766.
24 Hahn CG, Banerjee A, Macdonald ML, Cho DS, Kamins J, Nie Zet al.The post-synaptic density of human postmortem brain tissues: an experimental study paradigm for neuropsychiatric illnesses.PLoS One2009;4: e5251.
25 Focking M, Lopez LM, English JA, Dicker P, Wolff A, Brindley Eet al.Proteomic and genomic evidence implicates the postsynaptic density in schizophrenia.Mol Psychiatry2015;20: 424–432.
26 English JA, Pennington K, Dunn MJ, Cotter DR. The neuroproteomics of schizo-phrenia.Biol Psychiatry2011;69: 163–172.
27 Hjelm BE, Rollins B, Mamdani F, Lauterborn JC, Kirov G, Lynch Get al.Evidence of mitochondrial dysfunction within the complex genetic etiology of schizophrenia.
Mol Neuropsychiatry2015;1: 201–219.
28 Kato T, Kato N. Mitochondrial dysfunction in bipolar disorder.Bipolar Disord2000;
2(3 Pt 1): 180–190.
29 Konradi C, Eaton M, MacDonald ML, Walsh J, Benes FM, Heckers S. Molecular evidence for mitochondrial dysfunction in bipolar disorder.Arch Gen Psychiatry
2004;61: 300–308.
30 Konradi C, Sillivan SE, Clay HB. Mitochondria, oligodendrocytes and inflammation in bipolar disorder: evidence from transcriptome studies points to intriguing parallels with multiple sclerosis.Neurobiol Dis2012;45: 37–47.
31 Manji H, Kato T, Di Prospero NA, Ness S, Beal MF, Krams M et al.Impaired mitochondrial function in psychiatric disorders. Nat Rev Neurosci 2012; 13: 293–307.
32 Nierenberg AA, Kansky C, Brennan BP, Shelton RC, Perlis R, Iosifescu DV. Mito-chondrial modulators for bipolar disorder: a pathophysiologically informed paradigm for new drug development.Aust N Z J Psychiatry2013;47: 26–42. 33 Sequeira A, Rollins B, Magnan C, van Oven M, Baldi P, Myers RMet al.
Mito-chondrial mutations in subjects with psychiatric disorders.PLoS One2015;10: e0127280.
34 Shao L, Martin MV, Watson SJ, Schatzberg A, Akil H, Myers RMet al.Mitochondrial involvement in psychiatric disorders.Ann Med2008;40: 281–295.
35 Vawter MP, Tomita H, Meng F, Bolstad B, Li J, Evans Set al.Mitochondrial-related gene expression changes are sensitive to agonal-pH state: implications for brain disorders.Mol Psychiatry2006;11: 663–679.
36 Kirov G, Pocklington AJ, Holmans P, Ivanov D, Ikeda M, Ruderfer Det al. De novo
CNV analysis implicates specific abnormalities of postsynaptic signalling com-plexes in the pathogenesis of schizophrenia.Mol Psychiatry2012;17: 142–153. 37 Goodkind M, Eickhoff SB, Oathes DJ, Jiang Y, Chang A, Jones-Hagata LBet al.
Identification of a common neurobiological substrate for mental illness. JAMA Psychiatry2015;72: 305–315.
38 Cordes JS, Mathiak KA, Dyck M, Alawi EM, Gaber TJ, Zepf FDet al.Cognitive and neural strategies during control of the anterior cingulate cortex by fMRI neuro-feedback in patients with schizophrenia.Front Behav Neurosci2015;9: 169. 39 Lyoo IK, Sung YH, Dager SR, Friedman SD, Lee JY, Kim SJet al.Regional cerebral
cortical thinning in bipolar disorder.Bipolar Disord2006;8: 65–74.
40 Nenadic I, Maitra R, Dietzek M, Langbein K, Smesny S, Sauer Het al.Prefrontal gyrification in psychotic bipolar I disorder vs. schizophrenia.J Affect Disord2015;
185: 104–107.
41 Wang D, Zhou Y, Zhuo C, Qin W, Zhu J, Liu Het al.Altered functional connectivity of the cingulate subregions in schizophrenia.Transl Psychiatry2015;5: e575. 42 Mexal S, Berger R, Adams CE, Ross RG, Freedman R, Leonard S. Brain pH has a
significant impact on human postmortem hippocampal gene expression profiles.
Brain Res2006;1106: 1–11.
43 Cox J, Mann M. Quantitative, high-resolution proteomics for data-driven systems biology.Annu Rev Biochem2011;80: 273–299.
44 Cox J, Neuhauser N, Michalski A, Scheltema RA, Olsen JV, Mann M. Andromeda: a peptide search engine integrated into the MaxQuant environment.J Proteome Res
2011;10: 1794–1805.
45 Luber CA, Cox J, Lauterbach H, Fancke B, Selbach M, Tschopp Jet al.Quantitative proteomics reveals subset-specific viral recognition in dendritic cells.Immunity
2010;32: 279–289.
46 Callister SJ, Barry RC, Adkins JN, Johnson ET, Qian WJ, Webb-Robertson BJet al.
Normalization approaches for removing systematic biases associated with mass spectrometry and label-free proteomics.J Proteome Res2006;5: 277–286. 47 Benjamini Y, Hochberg Y. Controlling the false discovery rate: a practical and
powerful approach to multiple testing.J R Stat Soc1995;Series B: 289–300. 48 Nurnberger JI Jr., Koller DL, Jung J, Edenberg HJ, Foroud T, Guella Iet al.
Identi-fication of pathways for bipolar disorder: a meta-analysis.JAMA Psychiatry2014;
71: 657–664.
49 Föcking M, Dicker P, English JA, Schubert KO, Dunn MJ, Cotter DR. Common proteomic changes in the hippocampus in schizophrenia and bipolar disorder and particular evidence for involvement of cornu ammonis regions 2 and 3.Arch Gen Psychiatry2011;68: 477–488.
50 Iwamoto K, Bundo M, Kato T. Altered expression of mitochondria-related genes in postmortem brains of patients with bipolar disorder or schizophrenia, as revealed by large-scale DNA microarray analysis.Hum Mol Genet2005;14: 241–253. 51 Malenka RC, Bear MF. LTP and LTD: an embarrassment of riches.Neuron2004;44:
5–21.
52 Li Z, Okamoto K, Hayashi Y, Sheng M. The importance of dendritic mitochondria in the morphogenesis and plasticity of spines and synapses. Cell2004; 119: 873–887.
53 West AE, Chen WG, Dalva MB, Dolmetsch RE, Kornhauser JM, Shaywitz AJet al.
Calcium regulation of neuronal gene expression.Proc Natl Acad Sci USA2001;98: 11024–11031.
54 Ide M, Lewis DA. Altered cortical CDC42 signaling pathways in schizophrenia: implications for dendritic spine deficits.Biol Psychiatry2010;68: 25–32. 55 Buser AM, Erne B, Werner HB, Nave KA, Schaeren-Wiemers N. The septin
cytos-keleton in myelinating glia.Mol Cell Neurosci2009;40: 156–166.
56 Dolat L, Hu Q, Spiliotis ET. Septin functions in organ system physiology and pathology.Biol Chem2014;395: 123–141.
57 Bezanilla M, Gladfelter AS, Kovar DR, Lee WL. Cytoskeletal dynamics: a view from the membrane.J Cell Biol2015;209: 329–337.
59 Doherty JL, Owen MJ. Genomic insights into the overlap between psychiatric disorders: implications for research and clinical practice.Genome Med2014;6: 29. 60 Mamdani F, Rollins B, Morgan L, Sequeira PA, Vawter MP. The somatic common deletion in mitochondrial DNA is decreased in schizophrenia.Schizophr Res2014;
159: 370–375.
61 Xu C, Li PP, Kennedy JL, Green M, Hughes B, Cooke RGet al.Further support for association of the mitochondrial complex I subunit gene NDUFV2 with bipolar disorder.Bipolar Disord2008;10: 105–110.
62 Zhao Z, Xu J, Chen J, Kim S, Reimers M, Bacanu SA et al. Transcriptome sequencing and genome-wide association analyses reveal lysosomal function and actin cytoskeleton remodeling in schizophrenia and bipolar disorder.Mol Psy-chiatry2015;20: 563–572.
63 English JA, Fan Y, Focking M, Lopez LM, Hryniewiecka M, Wynne Ket al.Reduced protein synthesis in schizophrenia patient-derived olfactory cells.Transl Psychiatry
2015;5: e663.
64 Topol A, English JA, Flaherty E, Rajarajan P, Hartley BJ, Gupta Set al.Increased abundance of translation machinery in stem cell-derived neural progenitor cells from four schizophrenia patients.Transl Psychiatry2015;5: e662.
65 Miro O, Alonso JR, Jarreta D, Casademont J, Urbano-Marquez A, Cardellach F. Smoking disturbs mitochondrial respiratory chain function and enhances lipid peroxidation on human circulating lymphocytes. Carcinogenesis 1999; 20: 1331–1336.
66 Bubber P, Tang J, Haroutunian V, Xu H, Davis KL, Blass JPet al.Mitochondrial enzymes in schivzophrenia.J Mol Neurosci2004;24: 315–321.
67 Scaini G, Rezin GT, Carvalho AF, Streck EL, Berk M, Quevedo J. Mitochondrial dysfunction in bipolar disorder: Evidence, pathophysiology and translational implications.Neurosci Biobehav Rev2016;68: 694–713.
68 Lakshmanan J, Seelan RS, Thangavel M, Vadnal RE, Janckila AJ, Casanova MFet al.
Proteomic analysis of rat prefrontal cortex after chronic lithium treatment.
J Proteomics Bioinformatics2012;5: 140–146.
69 Nanavati D, Austin DR, Catapano LA, Luckenbaugh DA, Dosemeci A, Manji HK
et al.The effects of chronic treatment with mood stabilizers on the rat hippo-campal post-synaptic density proteome.J Neurochem2011;119: 617–629. 70 Thangavel M, Seelan RS, Lakshmanan J, Vadnal RE, Stagner JI, Parthasarathy LK
et al.Proteomic analysis of rat prefrontal cortex after chronic valproate treatment.
J Neurosci Res2014;92: 927–936.
71 Hill JJ, Hashimoto T, Lewis DA. Molecular mechanisms contributing to dendritic spine alterations in the prefrontal cortex of subjects with schizophrenia.Mol Psychiatry2006;11: 557–566.
72 Ji B, La Y, Gao L, Zhu H, Tian N, Zhang Met al.A comparative proteomics analysis of rat mitochondria from the cerebral cortex and hippocampus in response to antipsychotic medications.J Proteome Res2009;8: 3633–3641.
This work is licensed under a Creative Commons Attribution 4.0 International License. The images or other third party material in this article are included in the article’s Creative Commons license, unless indicated otherwise in the credit line; if the material is not included under the Creative Commons license, users will need to obtain permission from the license holder to reproduce the material. To view a copy of this license, visit http://creativecommons.org/licenses/ by/4.0/
© The Author(s) 2016
Supplementary Information accompanies the paper on the Translational Psychiatry website (http://www.nature.com/tp)