DESERT 14 (2009) 71-82
DEM-based
analysis of morphometric features in humid and
hyper-arid environments using artificial neural network
A.H. Ehsani
a*, F. Quiel
ba
Assistant Professor, International Research Center for living with Desert, University of Tehran, Tehran, Iran b
Department of Civil and Architectural Engineering, Royal Institute of Technology (KTH), SE-100 44 Stockholm, Sweden
Received: 22 November 2008; Received in revised form: 30 December 2008; Accepted: 15 February 2009
Abstract
This paper presents a robust approach using artificial neural networks in the form of a Self Organizing Map (SOM) as a semi-automatic method for analysis and identification of morphometric features in two completely different environments, the Man and Biosphere Reserve “Eastern Carpathians” (Central Europe) in a complex mountainous humid area and Yardangs in Lut Desert, Iran, a hyper arid region characterized by homogeneous repetition of wind-eroded landforms. The NASA Shuttle Radar Topography Mission (SRTM) has provided Digital Elevation Models (DEM) for over 80% of the land surface. Version 3.0 SRTM data provided by the CGIAR-CSI GeoPortal are the result of substantial editing effort on the SRTM DEM produced by NASA. Easy availability of SRTM 3 arc second data promoted great advances in morphometric studies and numerical description of terrain surface features as shown by many literature references. The goal of this study was to develop a new semi-automatic DEM-based method for geo-morphometric feature recognition and to explore the potential and limitation of SRTM 90 meter data in such studies. The 3 arc seconds data were re-projected to a 90 m UTM grid. Bivariate quadratic surfaces with moving window size of 5×5 were fitted to this DEM. The first derivative, slope steepness and the second derivatives minimum curvature, maximum curvature and cross-sectional curvature were calculated as geo-morphometric parameters and were used as input to the SOMs. Different learning parameter setting, e.g. initial radius, final radius, number of iterations, and the effect of the random initial weights on average quantization error were investigated. A SOM with a low average quantization error was used for further analysis. Feature space analysis, morphometric signatures, three-dimensional inspection and auxiliary data facilitated the assignment of semantic meaning to the output classes in terms of geo-morphometric features. Results are provided in a geographic information system as thematic maps of landform entities based on form and slope. Geo-morphometric features are scale-dependent and the resolution of the DEM limits the information, which can be derived. The results demonstrate that a SOM is an efficient scalable tool for analyzing geo-morphometric features as meaningful landforms under diverse environmental conditions. This method provides additional information for geomorphologic and landscape analysis even in inaccessible regions and uses the full potential of morphometric characteristics.
Keywords: DEM; Self Organizing Map; Morphometric Feature; Neural Network; Yardang; Lut Desert
1. Introduction
The Shuttle Radar Topography Mission
Corresponding author. Tel.: +98 21 88973295; Fax: +98 21 88971717.
E-mail address: [email protected]
A quantitative technique to analyze land surface features is known as (geo-) morphometry. In simple terms, geo-morphometry aims at extracting (land) surface parameters (morphometric, hydrological etc.) and objects (watersheds, stream networks, landforms etc.) using a set of numerical measures derived from DEMs such as slope steepness, profile curvature, plan convexity, cross-sectional curvature, minimum and maximum curvature (Fisher et al., 2004; Pike, 2000; Wood, 1996a). In the past, manual methods have been widely used to classify landforms from DEM (Hammond, 1964). Geomorphic phenomena are scale-dependent (Evans, 2003). This specific and scale-dependent behavior of the landscape morphology can not be denied. Scale dependency in this context means that the characteristics of a point or an area on a surface vary when measured over different spatial extents or different spatial resolution (Tate and Wood, 2001; Walsh et al., 1998; Wood, 1996b; Wood, 2002).
Yardangs a Turkman word used by the Swedish explorer Sven Hedin (1903) meaning ‘steep bank’ occur also on Mars and possibly on Venus (Goudie, 2007). They are streamlined forms up to 150 km long and 75 m in height resulting from a number of formative processes, including wind abrasion, deflation, fluvial incision, desiccation cracking, slumping, weathering and mass movement (Goudie, 2007; McCauley et al., 1977; Ward and Greeley, 1984). A limited number of morphometric investigations have been done on yardangs. Goudie (2007) identified mega-yardangs in hyper-arid environments with rainfall total less than 50 mm including central Asia, the Lut desert in Iran, northern Saudi Arabia, Bahrain, the Libyan desert in Egypt, central Sahara, the Namib Desert, the high Andes and the Peruvian desert. Yardangs tend to occur in areas of sand transport rather than sand accumulation (e.g. Lut, Saudi Arabia, northern Namibia) and may have been shaped over millions of years (Goudie, 2007). Gutierrez-Elorza et al (2002) studied the existence and generation of yardangs in the semiarid central sector of the Ebro Depression in Spain. They concluded that generation of yardangs in that area is related to the presence of playas, which constitute the source of abrading particles during dry periods. In another study Alavi Panah et al (2007) used Landsat Thematic Mapper (TM) data to characterize land cover and surface conditions of yardangs in Lut desert. They showed that the
main land cover types of Lut desert could be differentiated by supervised maximum likelihood classification. However, their study was based on extensive time-consuming field work and Landsat data. Inbar and Risso (2001) studied different size yardangs of volcano terrains in the southern Andes, Argentina. They showed that micro and meso-yardangs are formed on ignimbrite flows but mega-yardangs are developed in basaltic lava flows as long parallel corridors.
Self Organizing Map (SOM) is an unsupervised and nonparametric artificial neural network algorithm that clusters high dimensional input vectors into a low dimensional (usually two dimensional) output map in such a way, that topology of the data is preserved. Preserving topology means that the SOM preserves the spatial relations between input neighboring points. This important property among others such as versatile, spatially organized internal representations, potential as a robust substitute for clustering and visualization analysis (Suganthan, 2001), learning ability from complex, multi-dimensional data and transformation to visual clusters (Kiang, 2001) make a SOM to a very efficient tool for many applications. Some examples are: speech recognition (Leinonen et al., 1993), image data compression (Manikopoulos, 1993), image or character recognition (Bimbo et al., 1993; Sabourin and Mitiche, 1993), robot control (Ritter et al., 1989; Takahashi et al., 2001; Walter and Schulten, 1993), medical diagnosis (Vercauteren et al., 1990), lithological discrimination using Landsat TM data (Mather et al., 1998), urban land use classification (Özkan and Sunar Erbek, 2005), ecological modeling (Lek and Guegan, 1999), Morphometric features analysis (Ehsani and Quiel, 2008), landscape elements analysis (Ehsani and Quiel, 2007; Ehsani and Quiel, 2009), hyperspectral image classification and anomaly detection (Penn, 2002a; Penn, 2002b; Penn and Wolboldt, 2003) and classification of remote sensing data (Duda and Canty, 2002 ; Jianwen and Bagan, 2005). The major aims of this study are to:
● Provide a semi automatic method based on morphometric parameters derived from 90 m DEM to identify dominant morphometric features in humid and hyper-arid regions using SOM as an unsupervised neural network algorithm.
● Examine the effect of random weight initialization on the quantization error of optimal SOM.
2.Materials and methods
2.1. Study area
The study areas are:
1) An area centered at the common border of Poland, Slovakia and Ukraine and located
between 48° 52' N and 49° 25' N latitude, 21° 59' E and 23° 1’ E longitude with a total area about 4500 Km2. It covers the biosphere reserve
“Eastern Carpathians” with the Bieszczady national park in Poland, Uzanski national park in Ukraine and Poloniny national park in Slovakia and exhibits large morphological variations (Fig 1). The climate is moderately cool and humid with an annual mean temperature of 5.9° C and average annual precipitation between 1100-1200mm (Augustyn, 2004; Tobias Kuemmerle et al., 2006).
Fig. 1. a) location of the study area and b) Relief shaded topography from SRTM data of the study area at the border of Poland, Slovakia and Ukraine in “Eastern Carpathians”
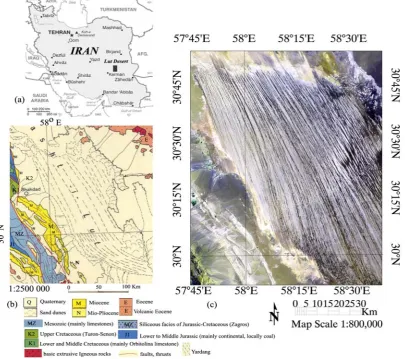
2) Lut Desert (Dasht-e Lut, or Dasht-i Lut) is a low area of about 400 × 800 km2 consisting of
several large basins separated by low ridges (Krinsley, 1970; Walker, 1986). These basins stretch southward from the Khorasan province into the Kerman province between 29° 30' N and 30° 49' N, 57° 47' E and 59° 53' E. The study area is located on the western side of Lut desert with strong diagonal lines result from wind erosion and episodic floods actions on the Neogene silts known as yardang (Fig. 2). The Lut desert according to meteorological data is characterized by a hyper-arid climate with an annual rainfall of less than 10 mm. The average mean daily temperature ranges from 11° in January to 40° in July. The eastern part of Lut desert is characterized by a great massif of dunes while the western part contains Mega-Yardangs, some of the world’s largest desert forms separated by large wind-swept corridors (Krinsley, 1970; Walker, 1986). This paper concentrates on the Mega_Yardangs. Altitude according to the radar
data ranges 100 to 404 meter above sea level (Fig. 3).
2.2. Data
The data sets in this study consist of:
● The version 3.0 SRTM data are distributed in a geographic (Lat/Long) projection, with the WGS84 horizontal datum and the EGM96 vertical datum. In this study, SRTM, C band, data were re-projected to UTM grid, Datum WGS84.
● Landsat ETM+ data, path 186, row 26 dated 2000-09-30 (Central Europe) and path 159 row 39 dated 2001-08-03 (Lut desert, Iran).
● 60 cm resolution QuickBird satellite image (panchromatic band) collected on Oct 15, 2005.
● Climate data, such as monthly and yearly average temperature, degree days and annual rainfall. The climate data are obtained via models based on analysis of long weather station time series and DEM.
Fig. 2. (a) Location of study area in the south east of Iran, (b) Geological map of the study area and (c) Red-Green-blue (RGB) color composite of bands 7, 5 and 2 of Landsat 7 data
2.3. Methods
For a semi-automated method, it is necessary to implement algorithms, which identify landforms from quantitative, numerical attributes of topography. In geomorphic studies of landscapes, the first and second order derivatives of DEM are the basic components for morphometric analysis (Evans, 1972). The second order derivatives of DEM are affected by geomorphological processes (Evans, 1972; Wood, 1996b).
To calculate the morphometric features, a local window is passed over the DEM and the change in gradient of a central point in relation to its neighbors is derived using a bivariate quadratic function:
Z = ax2
+ by2 + cxy + dx + ey + f
Where: x, y, Z are local coordinates and a to f are quadratic coefficients (Evans, 1972).
Then,
● Slope = arctan ( sqrt (d 2
+ e 2))
● Cross-section curvature = n × g × (b × d 2+ a × e2-
c × d × e)/(d 2+ e2)
● Maximum curvature = n × g × (-a-b + sqrt ((a-b)
2 + c2))
● Minimum curvature = n × g × (-a-b- sqrt ((a-b) 2+
c2))
Where: g is the grid resolution of the DEM, and n is the size of the moving window.
Wood (1996a) considered slope steepness, cross-sectional curvature, maximum and minimum curvature as a unique set to identify morphometric features. Morphometric features are identified using rules and definitions. Wood (1996a) defined a set of criteria to classify digital elevations models into morphometric classes. In regions with zero slopes (flat), the aspect is undefined and maximum and minimum curvatures are used as alternative parameters. At locations with positive values for slope, channels have negative cross-sectional curvature, ridges have positive cross-sectional curvature and sloping planes have zero cross-sectional curvature. These morphometric data sets were used as input for SOM algorithm.
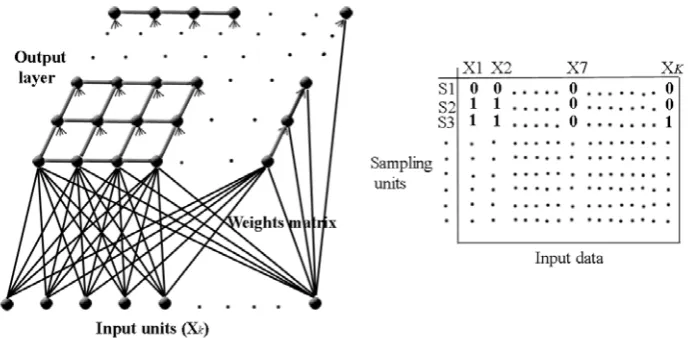
Self Organizing Map (SOM) is an unsupervised artificial neural network for clustering and visualization of information, preserving the topological relationship in the input (Kohonen, 2001). It converts the nonlinear statistical relationships of high dimensional input data to low dimensional (usually two dimensional) output grid (Kohonen, 2001). The SOM characteristics like learning ability, abstraction with topology preservation and visualization can be utilized in complex tasks such as morphometric analysis and landform classification (Ehsani and Quiel, 2007). An example of a Self-Organizing map network is shown in figure 4.
Fig. 4. Kohonen’s Self Organizing Map structure
The input layer consists of xk units, is fully connected to all output map units. The output map known as mapping cortex (MC) or Kohonen layer is made up from n×m output units (Schaale and
presented by the input vectors. The learning procedures move the randomly initialized weight vectors into positions, which describe best what is presented to them. For each object in the training data set, the distance between the model weight vectors and the input vector is computed. Then the competition starts and the winner neuron with smallest distance is selected. The weights of the winner neuron and its neighborhood are updated using learning rules. This procedure is cycled up to a predefined number of iterations for learning. The derived morphometric parameters were used as input to SOM. Before learning, weights of the map units were initialized randomly. The learning was performed in two phases, rough learning and fine tuning. During rough learning, initial neighborhood radius and learning rate are large. During fine tuning, the learning rate and neighborhood distance decrease very slowly, while maintaining the topological order learned in the previous phase. After learning, the map units are evenly distributed across the input space so that neighboring neurons can recognize the best matching vectors for each trained map unit (Richardson and Risien, 2003; Sueli and Lima, 2006).
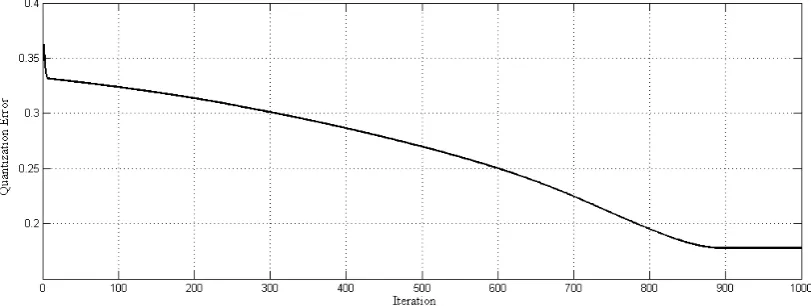
The quality of the results is measured with an average quantization error. Quantization error is the Euclidian distance between an input data vector and the best matching unit (Kohonen, 2001). These measures are useful in choosing suitable learning parameters such as initial radius, final radius of neighborhood and number of learning iterations. The optimal map is expected to yield the lowest average quantization error, because it is fitted best to the input data (Kohonen, 2001). 42 SOM each with different settings of learning parameters but the same randomly initialized weights were tested and the optimal map with the lowest average quantization error was selected for morphometric feature identification (Fig. 5). One important methodological question is how the random weights selection influences the average quantization error, and to what degree the result is dependant on these weights. The answer to this question is crucial for the consistency of the method to produce the same results. Thirty SOMs were tested with the same learning configuration of optimal SOM but different random weight initializations.
Fig. 5. Changes of the average quantization error versus number of iterations for optimal self organizing map
Using feature space analysis, spectral signature analysis, three-dimensional inspection, auxiliary data, Landsat ETM+ data and 60 cm panchromatic band of high resolution satellite imagery from QuickBird, dependency of optimal map units to morphometric features i.e. yardangs were defined. The changes of yardangs and morphometric features in elevation, slope, cross sectional curvature, maximum and minimum curvatures were studied along a 13230 m transect sample. Mean and standard deviation of morphometric
features for each input parameters were calculated. Morphometric signatures of features were plotted using mean values of input parameters.
3. Results
3.1. Optimal self organizing map
2 and 1 pixel respectively with eight different final radius starting from 3, decreasing to 0.01. The map with an initial radius of three and the same value for final radius produced the highest average quantization error. The map with initial radius of 3, final neighborhood radius of 0.01 and 1000 iterations shows the best performance with lowest average quantization error of 0.1780 and 0.1040 for Eastern Carpathians and Lut desert respectively.
To investigate the effect of random starting weights on the average quantization error, initial weight vectors were selected randomly ten times, run with 10, 50 and 1000 iterations and the average quantization error was calculated for each map. The results indicate that, at least in this study, if many iterations (at least 1000) are used, the output classes and the global minimum error of the network are not sensitive to random initialization of the input weight vectors. This
implies that the output of the network is consistent and independent of the starting weights.
3.2. Identification of morphometric features
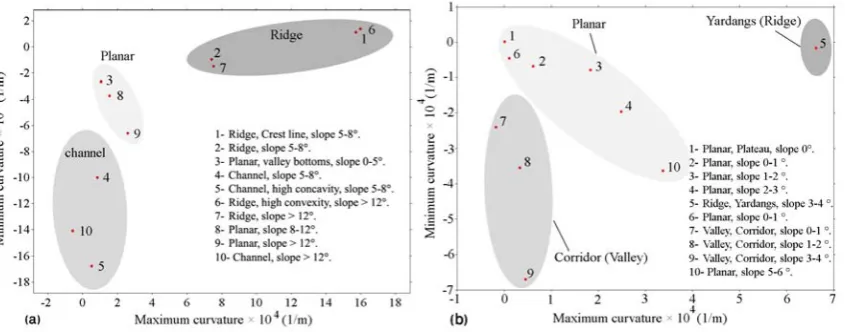
The output map units from SOM are just clusters. Studying the spatial relationship between different map units along with morphometric parameters using feature space analysis allowed us to interpret and label them as morphometric features. By analyzing the topographic information for each class, we can interpret the results in terms of landform elements. In two-dimensional feature space plots of mean values of maximum curvature (x-axis) and minimum curvature (y-axis) for map units, the major morphometric features (channel, planar, ridge, corridor, yardangs) of both regions are identified (Fig. 6).
Fig. 6. Distribution of morphometric features in two dimensional feature spaces a) Eastern Carpathians and b) Lut desert
In both areas, channels (or corridors) showed negative minimum curvature and zero or near zero maximum curvature. Conversely, ridges (or yardangs) revealed positive maximum curvature and zero or near zero minimum curvature. Values of both maximum and minimum curvature were positive for crest line class. Classes with plane features were located between ridge (Yardang) and channels (corridors) and had small values for minimum and maximum curvature. Typically in the Eastern Carpathians the values for curvatures and slope are much higher than in the Lut desert. E.g. curvatures reach mean class values of 18 in the Carpathians, but only 7 in Lut desert.
The signature graph in the figure 7 reveals that classes 3, 8 and 9 are identified as planar
morphometric object at a small scale but as series of forming elements at another, larger scale. Classes 5 and 10 have the lowest values for maximum, minimum and cross sectional
curvatures and represent channels. Class 1 with the highest mean value of minimum and maximum curvatures is labeled as crest line.
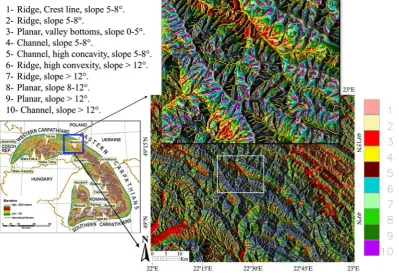
Fig. 7. Morphometric signatures of the SOM output classes. Ellipses show the examples of morphometric feature’s characteristics. Class's legend refers to Fig. 8
Fig. 8. Morphometric features map using SOM with DEM-90 in Eastern Carpathians with dropped drainage network over zoom
sample
The analysis of the results and satellite images also showed the effectiveness of the method to
clear that the pattern of mega_yardangs and their corridors running from NNW-SSE is parallel to the prevailing wind known as “wind of 120 days”. Five classes (1, 2, 3, 4 and 6) of planar features with low elevation and slope are found extensively in the north and east of the study area. The wide sloping planar features (class 10) are detected mainly in the transition zone between yardangs and corridors where the edge of feature may are abraded and flattened by wind or other
processes. Class 5 or yardangs were very well identified in parallel ranks running northwest to southeast with average slope between 3 to 4 degrees. This base of the convex ridge slope forms a steep angle with the floor riddled with rills and ravines from periodic floodwaters. Three classes were identified for corridors (valleys) between yardangs with mean slopes between 0 to 4 degrees. In some places, crescent dunes wander along these corridors.
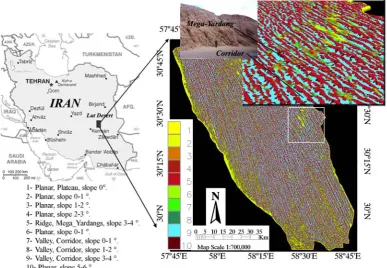
Fig. 9. Morphometric features map using SOM with DEM-90 in Lut desert with 3D zoom sample and field image. Mega yardangs
and corridors between them are represented by red and cyan color
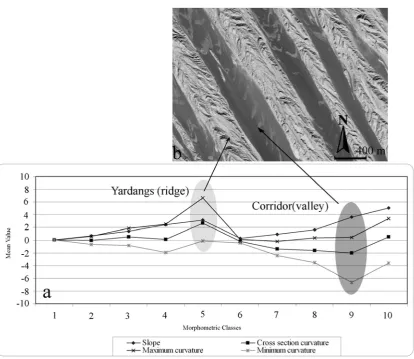
Morphometric signatures for slope, cross- sectional curvature, maximum and minimum curvatures of SOM resultant classes, remarkably yardangs and corridors are illustrated in figure 10. This representation not only highlights that slopes vary for different classes but also reveals that yardangs and corridors could be easily detected from different morphometric signatures. The yardangs are associated with high values for maximum curvature and corridors show high negative values for minimum curvature. The
steepest slopes are observed in class 10 with a mean of 5 degrees corresponding to sloping planar features.
Result of this method revealed that from the total 6481 km2 coverage of the study area, about
2035 km2 (31%) are classified as yardang while
corridors, described by 3 classes (7, 8 and 9), in total cover 2732 km2 (42%). Class 6 characterizes
Fig. 10. a) Morphometric signatures of yardangs and corridors. (b) The 60-centimeter QuickBirde image showing the mega yardangs and corridors.. Yardangs oriented to the prevailing wind direction, 330° and corridors in some places are
covered by sand sheets. Class's legend refers to Fig.9
4. Conclusions
The SRTM mission provided the most complete high-resolution digital topographic database of the Earth. Unfortunately, only 3 arc seconds data are available for most scientific research. The morphometric analysis and feature space analysis of first and second order derivatives of DEM such as slope, cross-sectional curvature, maximum curvature and minimum curvature led to the interpretation of SOM outputs as appropriate landform classes.
Eastern Carpathians are characterized by elongated ridges and valleys. These ridges are dissected resulting in small patches of landform elements like ridge with very steep slope, channels with moderate slopes and plains with
gentle slope. These local landform elements are large enough to be recognized in morphometric parameters calculated with a 5×5 window, corresponding to 450 m on the ground. With much larger window sizes, these local features disappear and are replaced by feature which describing regional patterns. Therefore, size, shape and pattern of identified geo-morphometric objects depend on the underlying DEM resolution and the selected window size.
resolution but become unrecognizable if their width is less than the grid resolution. Morphometric signatures, three-dimensional inspection, auxiliary data such as 30 m resolution Landsat ETM+ and 60 cm resolution QuickBird data facilitated the evaluation of the output SOM in terms of geomorphometric features. The optimal self organizing map with suitable learning parameters should be selected for feature identification. Examination of the effect of random weight initialization on optimal SOM revealed that with a high number of iterations (in this study 1000 steps) the network becomes stable and the weight vectors move to the same global minimum error. This is an important finding, confirming that this procedure is repeatable and produces consistent results.
Overall, this study demonstrated that SOM provide a valuable method to extract information on morphological features in a wide range of landscapes that can be used in geosciences, environmental and geo-ecosystem modeling. This procedure is promising and offers new possibilities to study both types of terrain features, general landforms and landform elements.
Acknowledgement
We are grateful to Swedish Institute for funding all travel expenses in the framework of the Visby program. We like to thank the University of Tehran, International Desert Research Center and all our colleagues especially Docent Ivan Kruhlov, Department of Physical Geography, Ivan Franko University in Lvov, Ukraine and Dr. Mieczyslaw Sobik, Institute of Geography and Regional Development, University Wroclaw, Poland for interesting discussions and for providing facilities and support.
References
Alavi Panah, S.K., C.B., Komaki, A., Goorabi, and H.R., Matinfar, 2007. Characterizing Land Cover Types and Surface Condition of Yardang Region in Lut Desert (Iran) Based upon Landsat Satellite Images. World Applied Sciences Journal., 2: 212-228.
Augustyn, M., 2004. Anthropogenic pressure in the environmental parameters of the Bieszczady Mountains. Biosphere Conservation., 6: 43-53.
Bimbo, A.D., L., Landi, and S., Santini, 1993. Three- dimensional planar-faced object classification with Kohonen maps. Opt. Eng., 32: 1222-1234.
Duda, T. and M., Canty, 2002. Unsupervised classification of satellite imagery: choosing a good algorithm
International Journal of Remote Sensing., 23: 2193- 2212.
Ehsani, A.H. and F., Quiel, 2007. Artificial Neural Networks for Landscape Analysis of the Biosphere Reserve “Eastern Carpathians” with Landsat ETM+ and
SRTM data., The Problems of Landscape Ecology., XX, Warsaw, Poland.
Ehsani, A.H. and F., Quiel, 2008. Geomorphometric feature analysis using morphometric parameterization and artificial neural networks. Geomorphology, 99: 1-12.
Ehsani, A.H. and F., Quiel, 2009. A semi-automatic method for analysis of landscape elements using shuttle radar topography mission and landsat ETM+ data. Computers & Geosciences, 35: 373-389
Evans, I.S., 1972. General geomorphology, derivatives of altitude and descriptive statistics. In: R.J. Chorley (Editor), Spatial Analysis in Geomorphology. Methuen & Co. Ltd, London, pp. 17-90.
Evans, I.S., 2003. Scale specific landforms and aspects of the land surface. In: I.S. Evans, R. Dikau, E. Tokunaga, H. Ohmori and M. Hirano (Editors), Concepts and modeling in geomorphology: International Perspectives. Terrapub, Tokyo, pp. 61-84.
Fisher, P., J. Wood, and T., Cheng, 2004. Where is Helvellyn? Fuzziness of Multiscale Landscape Morphometry. Transactions of the Institute of British Geographers, 29: 106-128.
Goudie, A.S., 2007. Mega-Yardangs: A Global Analysis Geography Compass, 1: 65–81.
Gutierrez-Elorza, M., G. Desir, and F., Gutierrez- Santolalla, 2002. Yardangs in the semiarid central sector of the Ebro Depression (NE Spain). Geomorphology, 44: 155-170.
Hammond, E.H., 1964. Analysis of properties in landform geography: an application to broadscale landform mapping. Annals of Association of American Geographers, 54: 11-19.
Hedin, S., 1903. Central Asia and Tibet. Charles Scribner and Sons, New York, 608 pp.
Inbar, M. and C., Risso, 2001. Holocene yardangs in volcanic terrains in the southern Andes, Argentina. Earth Surface Processes and Landforms, 26: 657-666. Jianwen, M. and H.,Bagan, 2005. Land-use classification using ASTER data and self-organized neural networks. International Journal of Applied Earth Observation and Geoinformation, 7: 183-188.
Kiang, M.Y., 2001. Extending the Kohonen self-organizing map networks for clustering analysis. Computational Statistics & Data Analysis, 38: 161-180.
Kohonen, T., 2001. Self Organizing Maps. Springer, New York, pp. 501.
Krinsley, D.B., 1970. A geomorphological and palaeoclimatological study of the playas of Iran. U.S. Geological Survey. U.S. Government Printing Office, contract. PROCP 700-800. US Air Force Cambridge Research. 329 pp.
Lek, S. and J., Guegan, 1999. Artificial neural networks as a tool in ecological modelling, an introduction. Ecological Modelling, 120: 65-73.
Manikopoulos, C.N., 1993. Finite state vector quantisation with neural network classification of states. IEEE Proc.- F, 140: 153-161.
Mather, P.M., B.Tso, and M., Koch, 1998. An evaluation of Landsat TM spectral data and SAR-derived textural information for lithological discrimination in the Red Sea Hills, Sudan International Journal of Remote Sensing, 19: 587-604.
McCauley, J.F., M.J. Grolier, and C.S., Breed, 1977. Yardangs. In: D.O. Doehring (Editor), Geomorphology in Arid Regions. Allen and Unwin, London, pp. 233- 269.
Özkan, C. and F., Sunar Erbek, 2005. Comparing feature extraction techniques for urban land-use classification. International Journal of Remote Sensing, 26: 747- 757.
Penn, B.S., 2002a. Using self-organizing maps for anomaly detection in hyperspectral imagery, IEEE Aerospace Conference. Big Sky, MT, pp. 1531-1535.
Penn, B.S., 2002b. Using self-organizing maps, histograms, and standard deviation to detect anomalies in hyperspectral imagery data, 5th International Airborne Remote Sensing Conference, Miami, Florida. Penn, B.S. and M.W., Wolboldt, 2003. Methods for detecting anomalies in AVIRIS imagery, 12th Jet Propulsion Laboratory Airborne Earth Science Workshop, Pasadena, California.
Pike, R.J., 2000. Geomorphology - Diversity in quantitative surface analysis. Progress in Physical Geography, 24: 1-20.
Richardson, A..J. and C., Risien, 2003. Using self- organizing maps to identify patterns in satellite imagery. Progress In Oceanography, 59: 223-239.
Ritter, H., T. Martinetz, and K., Schulten, 1989. Topology- conserving maps for learning visuo-motor- coordination. Neural Networks, 2: 159–168.
Sabourin, M. and A., Mitiche, 1993. Modeling and classification of shape using a Kohonen associative memory with selective multiresolution. Neural Networks, 6: 275-283.
Schaale, M. and R., Furrer, 1995. Land surface classification by neural networks. International Journal of Remote Sensing, 16: 3003-3031.
Sueli, A..M. and J. O., Lima, 2006. Comparing SOM
neural network with Fuzzy c-means, K-means and traditional hierarchical clustering algorithms. European Journal of Operational Research, 174 1742-1759. Suganthan, P., 2001. Pattern classification using multiple hierarchical overlapped self-organising maps. Pattern Recognition, 34(11): 2173-2179.
Takahashi, T., T., Tanaka, K. Nishida and T., Kurita, 2001. Self-organization of place cells and reward-based navigation for a mobile robot, 8th International Conference on Neural Information Processing, Shanghai (China).
Tate, N. and J., Wood, 2001. Fractals and scale dependencies in topography. In: N. Tate and P. Atkinson (Editors), Modelling scale in geographical information science. Wiley, Chichester, pp. 35-51. Tobias Kuemmerle, C. Volker Radeloff, K. Perzanowski, and P., Hostert, 2006. Cross-border comparison of land cover and landscape pattern in Eastern Europe using a hybrid classification technique Remote Sensing of Environment, 103: 449-464.
Vercauteren, L. et al., 1990. The classification of brain tumours by a topological map, International Neural Networks Conference, Paris, pp. 387-391.
Walker, A.S., 1986. Chapter 8: Plate E-19. In: M. Nicholas, S. Short and J. Robert W. Blair (Editors), Geomorphology from Space. NASA, Walsh, S.J., D. R. Butler, and G., Malanson, 1998. An overview of scale, pattern, process relationships in geomorphology: a remote sensing and GIS perspective. Geomorphology, 21(3-4): 183-205.
Walter, J.A. and K. J., Schulten, 1993. Implementation of self-organizing neural networks for visuo-motor control of an industrial robot. IEEE Trans. Neural Networks, 4: 86-95.
Ward, A.W. and R., Greeley, 1984. Evolution of the yardangs at Rogers Lake, California. Geol. Soc. Am. Bull., 95: 829-837.
Wood, J., 1996a. The Geomorphological Characterization of Digital Elevation Models, University of Leicester, UK, Leicester.
Wood, J., 1996b. The Geomorphological Characterization of Digital Elevation Models, Ph.D Dissertation, Leicester, UK.