in the population sciences published by the Max Planck Institute for Demographic Research Konrad-Zuse Str. 1, D-18057 Rostock · GERMANY www.demographic-research.org
DEMOGRAPHIC RESEARCH
VOLUME 11, ARTICLE 13, PAGES 357-394
PUBLISHED 15 December 2004
www.demographic-research.org/Volumes/Vol11/13/
DOI: 10.4054/DemRes.2004.11.13
Research Materials
Perinatal mortality in the Netherlands
Backgrounds of a worsening
international ranking
Joop Garssen
Anouschka van der Meulen
1 Introduction 359
2 Sources and limitations 361
3 Risk factors and their effect on perinatal mortality 365 3.1 Age, marital status and pregnancy history 366 3.2 Socio-economic status and ethnic origin 372
3.3 Multiple births 375
3.4 Baby’s sex 378
3.5 Pregnancy duration 380
3.6 Other risk factors 382
4 Conclusions and discussion 385
5 Acknowledgements 387
Research Materials
Perinatal mortality in the Netherlands
Backgrounds of a worsening international ranking
Joop Garssen 1
Anouschka van der Meulen 2
Abstract
Perinatal mortality rates have dropped sharply in the past few decades, in the Netherlands as well as in all other European countries. However, as the decrease has generally slowed down since the 1980s, the Netherlands has lost its prominent position in the international ranking of countries with favourable perinatal mortality rates. This lower ranking is not only the result of the dialectics of progress, but also the consequence of a relatively restrained use of antenatal diagnostics. In addition, the Netherlands is among the European countries scoring highest on a number of important risk factors. This article examines the effect on perinatal mortality rates of known risk factors, in particular the presence of non-western foreigners, multiple births and older mothers. With respect to the latter factor, it is concluded that children of older mothers run a significantly higher risk of foetal mortality, whereas babies of young mothers (including women in their early twenties) run a higher risk of infant mortality. For babies of non-western mothers, infant mortality rates are higher, although there are substantial differences between ethnic backgrounds. First week mortality is most unfavourable for Surinamese and Antillean/Aruban children, and post-neonatal mortality is highest among Turkish and Moroccan babies. The fact that relatively many non-western foreigners from countries with relatively high risks of perinatal mortality have settled in the Netherlands, is one of the reasons for the fall in the international ranking. Lastly, the increase in the number of multiple births has been stronger in the Netherlands than in most other countries. The higher incidence of assisted reproduction explains most of this increase.
____________________________
Perinatal mortality
Mortality in the period around birth, or perinatal mortality, is defined here as the sum of late foetal mortality (stillbirth) after a pregnancy duration of at least 24 weeks, and mortality in the first week after birth (the first 168 hours; early neonatal mortality). Perinatal mortality in a certain period is calculated per thousand live and stillborn babies in that period.
1. Introduction
At the end of 2003 the publication of perinatal mortality rates for a number of European countries gave rise to some commotion in the media and among policymakers in the Netherlands. The Peristat project, financed by the European Commission and published in November 2003, suggested that the Netherlands compared unfavourably with other European countries, in particular with respect to perinatal mortality. This drop in status - from being one of the leading countries to one bringing up the rear - dominated the reports on the Peristat project, and prompted the relevant authorities to put the information into perspective. Just as in other European countries, perinatal mortality in the Netherlands has dropped sharply in recent decades. This means the differences between the countries have become so small that they are much less significant than they used to be, and are relatively sensitive to other, not necessarily unfavourable, factors. Policies in the area of medical treatment of newborn babies, for example, play a part for extremely premature babies: Dutch doctors are more likely than their European colleagues to refrain from treating newborns if their prospects are unfavourable (De Leeuw et al., 2000). And in spite of all the efforts by the Peristat team, the comparability of the various national registrations also affects the conclusions. Lastly, it is not true that the Dutch situation has deteriorated in absolute terms; it is only less favourable in comparison with other European countries. Infant mortality and perinatal mortality have been stable in the Netherlands for a number of years now, at just over 5 and nearly 8 per thousand respectively. An overview of foetal and early neonatal mortality rates according to the Peristat-study is given in table 1. The foetal mortality rates in this table are calculated for all births at or after 28 weeks of gestation.
It should be mentioned here that at the time the Peristat results were published it was already known that the Netherlands was no longer leading the field where perinatal mortality is concerned; Köhler (2003), among others, had pointed this out. Much earlier publications (e.g. Hoogendoorn, 1986; Mackenbach, 1992) pointed to the levelling out of the decrease in perinatal mortality in the 1980s. In their comparative analysis for the 15 EU-countries, Achterberg and Kramers (2001) established that the Netherlands had fallen from fourth to eleventh place in the perinatal mortality rankings in the period 1960-1996. In the rankings for infant mortality the fall was comparable, from second to tenth place, but less worrying in absolute terms.
However, the developments in the international ranking are not only the consequence of the dialectics of progress. Countries such as Sweden and Finland, which had very favourable perinatal mortality rates forty years ago, are still among the countries with the lowest rates. Indeed studies of individual cases of death in various European countries in the period 1993-1998 have shown that developments in perinatal mortality are related to suboptimal care before, during and after childbirth. Four out of ten deaths are supposedly attributable to inadequate care (Richardus et al., 2003). In the Netherlands, this has partly to do with the fact that not all the possibilities afforded by antenatal diagnostics are used, which means that fewer foetuses with serious defects are aborted than in other countries. This results in more deaths shortly before or after birth (Van der Pal-De Bruin et al., 2002).
Table 1: Foetal and early neonatal mortality rates according to Peristat-study
Source: Buitendijk, Zeitlin, Cuttini, Langhoff-Roos and Bottu, 2003
2. Sources and limitations
Both the precise calculation of perinatal mortality (and to a much lesser extent infant mortality) and the construction of an international ranking are strongly determined by the chosen definition and by differences in policy and practice. The perinatal mortality rate can vary by as much as 50 percent, for example, depending on which definition is used, and under-registration of perinatal mortality may amount to as much as 20 percent (Richardus et al., 1998). Although problems related to definitions are less relevant for the study of trends and differences within the Netherlands, a varying level of registration can certainly have an effect on the established trends. This under-registration may partly be caused by doctors and midwives not reporting all cases, and
Year Foetal mortality
(28+ weeks)
Early neonatal mortality
Rate 95% CI Rate 95% CI
Austria 2001 2.6 2.2 - 3.1 2.2 1.9 - 2.6
Belgium (Flanders) 2000 3.2 2.6 - 3.7 2.2 1.8 - 2.6
Denmark 2000 3.8 3.3 - 4.3 3.3 2.8 - 3.7
Finland 2000 2.8 2.2 - 3.3 1.7 1.4 - 2.0
France 2000 n.a. 2.1 2.0 - 2.2
Germany (9 Bundesländer) 2000 2.9 2.8 - 3.1 n.a.
Greece 1998 4.7 3.5 - 5.9 4.8 3.7 - 6.0
Ireland 1999 4.2 3.6 - 4.8 3.2 2.7 - 3.7
Italy 1998 3.7 3.6 - 3.9 2.7 2.6 - 2.8
Luxembourg 2000 4.4 2.4 - 6.4 1.6 0.6 - 2.6
The Netherlands 1999 4.6 4.2 - 4.9 3.5 3.3 - 3.8
Portugal 1999 4.3 3.8 - 4.7 2.5 2.2 - 2.8
Spain (Madrid, Valencia, País Vasco) 2000 n.a. 1.5 1.3 - 1.8
Sweden 2000 3.9 3.5 - 4.3 1.7 1.4 - 1.9
England and Wales, UK 2000 n.a. 2.8 2.7 - 2.9
Northern Ireland, UK 2000 3.3 2.5 - 4.2 2.7 2.0 - 3.4
Scotland, UK 2000 4.0 3.5 - 4.6 2.9 2.4 - 3.3
partly because the completeness of the information flow from the registration in the municipality of death to Statistics Netherlands cannot be guaranteed.
The first mentioned source of under-registration may occur at different points in time. Doctors and midwives may decide to adjust the duration of pregnancy downwards, in order to spare the parents of a stillborn child the emotional burden and the costs of funeral or cremation if the duration is only just over 24 weeks (Anthony, 2001). According to law, if a foetus dies after a pregnancy of at least 24 weeks, it must be reported as a stillbirth and the municipal registrar must give permission for burial or cremation. This practice is the result of the fact that requirements concerning registration are not rooted in epidemiological research, but are devised by the legislator who attaches a number of consequences to them (Keirse, 1987).
In later stages of pregnancy, too, not all deaths are reported as they should be according to law. A study by Van der Wal et al. (1996) points out that around one tenth of perinatal mortality is attributable to abortion in the third trimester of pregnancy, when antenatal tests have shown serious defects. In one in eight cases no official stillbirth is reported in this stage of pregnancy. Abortion following antenatal screening has, in recent decades, probably had an upward effect on the perinatal mortality rates and a downward effect on infant mortality in recent decades. Finally, deaths of babies immediately after birth are not always recorded as the death of a live born baby (and thus do not result in both a record for birth and a record for death in the municipal population register). This deviation from the guidelines does not have an effect on the perinatal mortality rate, but does result in a slightly lower infant mortality rate.
The second source of under-registration is in the information flow between the municipality where the death occurs and Statistics Netherlands. Unlike mortality of live born babies, which is reported to Statistics Netherlands digitally (via the exchange system of municipal population registers), stillbirths are reported by means of paper forms. Until 1994 the completeness of this information was checked with the aid of mailing lists and death certificate numbers. However, this audit was abolished with the introduction of the digital municipal population register (Kardaun, 2003).
Deaths which occur within 168 hours of birth are included in first-week mortality, and thus also in perinatal mortality. In practice, Statistics Netherlands determines first week mortality on the basis of the number of days between birth and death, ignoring the actual time of death. There is, therefore, a certain inaccuracy around the boundary between perinatal and postneonatal mortality. However, as only 3 percent of first-week mortality occurs on the seventh day after birth, and only some of these deaths will be classified in the wrong category, the effect on the mortality rates concerned will only be small. It has no effect at all on infant mortality rates.
level of perinatal mortality and infant mortality, as well as the breakdown into first-week, neonatal and postneonatal mortality and a number of characteristics of the death. These statistics are based on information which is sent to the population registration via the so-called A-declaration form (declaration of death and/or declaration of stillborn child). The registrar makes up a death certificate and – if the baby was born alive – a birth certificate. In the latter case, a baby will be entered into and removed from the population register. This is not done for stillbirths, and for this reason stillbirths are not included in this information flow. The information on stillborn babies is based on a paper information flow, which consists of an enumeration card with details of the mother, (usually) the father and the birth.
To determine perinatal mortality, the B-declaration form (the declaration of the cause of death) is very important. The B-declaration form comprises a module for stillbirths, including details of pregnancy duration (nearly always completed) and cause of death (unknown in 40 percent of cases as the autopsy has yet to take place; Kardaun, 2003). The enumeration card and the B-form are linked by Statistics Netherlands, with municipality, date and death certificate number as linking keys.
The Peristat study, which for the Netherlands was based on figures resulting from linking anonymous register data from the first line (midwives) and the second line (gynaecologists) probably contains some double counts. The figures presented here, on the other hand, probably suffer from a certain extent of under-reporting but are, in spite of this, valuable, among other things because they give insight into differences between ethnic groups. The discrepancies between the two sources are, at any rate, not large: foetal mortality observed by Statistics Netherlands was 6.2 per thousand (after pregnancy duration of at least 24 weeks in the period 1997-2002), while Peristat found a foetal mortality rate of 7.7 per thousand (after pregnancy duration of at least 22 weeks, in 1999; the rate calculated for a pregnancy duration of at least 28 weeks is 4.6 per thousand).
Earlier research (Anthony et al., 2001) based on data for 1995, showed that foetal mortality (after 24 weeks) was 6.37 per thousand according to Statistics Netherlands, compared with 7.71 per thousand according to linked medical registers. Perinatal mortality (for the same pregnancy duration) was 9.44 and 10.68 per thousand respectively, a difference of 12 percent. For earlier years De Galan-Roosen et al. (1997) found a difference of at least 8.1 percent, and Doornbos et al. (1987) established a difference of 14.3 percent.
is not reported to the population registration. In Ireland this is the case for 10 percent (Scott et al., 1981).
Figure 1: Annual number of perinatal deaths registered by Statistics Netherlands, 1990-2002
Information on the completeness of statistics on perinatal mortality for more recent years than 1995 is not available, but the development in the number of cases of perinatal mortality since 1995 (Figure 1) does not lead us to believe that an appreciable increase has taken place in the proportion of cases not recorded. This is also the case for foetal mortality, the perinatal mortality component which is most sensitive to incomplete registration. This graph is based on data as published in Statistics Netherlands’ StatLine database for a pregnancy duration of at least 28 weeks.
Today, early neonatal deaths account for around 60 percent of infant mortality in the Netherlands, and because this category also accounts for 35 to 40 percent of perinatal mortality there is a considerable overlap between these two indicators. The two are also ‘communicating vessels’, and a shift in mortality in the first week to a later period in the baby’s first year would lead to a fall in perinatal and early neonatal deaths and a rise in neonatal mortality in the second to fourth week and possibly a rise in postneonatal mortality (second to twelfth month). Because the number of extremely premature babies and children with a very low birth weight has increased in recent decades (WBC, 1998), and an increasing proportion of these babies are admitted to neonatal intensive care units, part of perinatal mortality has been said to have shifted to
0 500 1000 1500 2000 2500
1990 1991 1992 1993 1994 1995 1996 1997 1998 1999 2000 2001 2002
perinatal deaths (28+ weeks)
infant mortality as a result of technological improvements in antenatal and perinatal care.
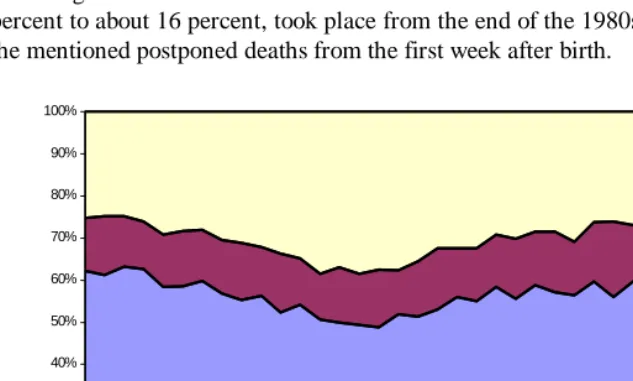
Whether such a shift has actually taken place cannot be established with the aid of mortality rates. The shift would have taken place in a period in which all categories of mortality showed a strong decrease. Figure 2 shows the distribution of mortality within the first year in the period 1970-2002. In this period, infant mortality fell from 12.7 to 5.0 per thousand. The Figure does not show an increase in the proportion of postneonatal deaths, although there is a slight increase in the proportion of deaths occurring in the second to fourth week after birth. This increase, from about 12.5 percent to about 16 percent, took place from the end of the 1980s and may be related to the mentioned postponed deaths from the first week after birth.
Figure 2: Distribution of infant deaths by age at death, 1970-2002
3. Risk factors and their effect on perinatal mortality
Earlier studies have revealed a large number of risk factors with respect to perinatal mortality, and have been able to quantify the effect of some of them. Some of these risk factors are related to the mother, others to the child. Well-known risk factors for the mother are age, marital status (especially single motherhood), pregnancy history, socio-economic status, height, ethnic origin, smoking and drinking, fertility treatment, chronic
0% 10% 20% 30% 40% 50% 60% 70% 80% 90% 100%
1970 1975 1980 1985 1990 1995 2000
week 5-52
week 2-4
disease and complications during pregnancy and childbirth. For the baby risk factors include pregnancy duration and weight at birth, multiple births, sex, position at birth and congenital abnormalities (Richardus et al., 1998). This paragraph will look mainly at the risk factors for which (supplementary) information is available from the population and cause of death statistics.
3.1 Age, marital status and pregnancy history
Among other things, perinatal mortality correlates with the age of the mother, but this is not a linear relationship. Research into the link between infant mortality and mother’s age shows a U-shaped relation, with the highest risks for babies of very young and relatively old mothers (Geronimus, 1992). On the basis of Dutch data (from the national obstetrics register), Van Enk et al. (2000) showed that teenage pregnancies are unfavourable from a medical point of view, with an increased risk of premature birth and perinatal death. According to this study children of very young mothers have a higher risk of perinatal mortality, even after correction for premature birth.
The above-mentioned U-shaped relation between mother’s age and infant mortality, and the increased risk of death for babies of teenage mothers in particular, is also illustrated in Figure 3. Since 1960 infant mortality has fallen across the board, but the age pattern largely remains unchanged. Today the risk is lowest for mothers aged between 25 and 45 years, with relatively small differences between the age groups. Remarkably, in all the periods illustrated mortality among babies of mothers aged 20 to 24 years is above average. For the period 2000-2002 mortality among these babies was nearly 40 percent higher than average. Mortality is highest for babies of teenage mothers and those of mothers aged 45 and older, for whom the risk is more than twice as high.
Although the number of women aged over 40 who have a baby has increased in recent years, these are almost exclusively women between 40 and 45 years. The number of babies born to women aged 45 and older is very small. In 2002 only one in a thousand newborn babies had a mother aged 45 or older (Statistics Netherlands, 2004). For this reason Figure 3 does not give a mortality rate for these babies in the more recent periods.
remains after correction for the effect of age of the mother and various biological and socio-economic characteristics.
Dutch data for the period 1997-2002 show a weak but statistically significant U-shaped relation between father’s age and infant mortality. After a proportional redistribution of the data for fathers of unknown age (13 percent of all fathers), infant mortality rates are lowest in the age groups of 30-34 and 35-39 years (4.9 per thousand live births). The rates are 6.0 per thousand in the age group of 20-24 years and 5.9 per thousand for children of fathers aged 45 years and older. The risk for children of teenage fathers cannot be accurately determined as, during the period 1997-2002, only 14 registered fathers of this age lost a child in its first year of life.
Figure 3: Number of infant deaths by age of mother, 1960-2002
For the period 1996-2002 it has also been examined to what extent the risk of stillbirth is increased among young and old mothers. This relation is illustrated in Figure 4. Teenage mothers appear to have an above average risk of stillbirth, but older mothers run by far the greatest risk. Women aged 45 years or older have a fourfold risk of stillbirth if compared to women in the first half of their thirties.
0 5 10 15 20 25 30
< 20 years 20-24 years 25-29 years 30-34 years 35-39 years 40-44 years 45+ years per thousand live births
1960-1962
1970-1972
1980-1982
1990-1992
2000-2002 (mother)
Figure 4: Number of stillbirths by age of father* and mother, 1996-2002 (* data for 1997-2002; age unknown redistributed proportionally)
Very few statistical data are available on the effect of father’s age on foetal mortality. Recent research based on Czech data (Rychtaříková et al., 2004) demonstrated an increase in foetal mortality starting at the youngest age category (15-19 years). The researchers suppose that this increase is caused by damage to sperm cells that progresses with age, but point out that this hypothesis is not yet proven.
Figure 4 shows, for the period 1997-2002, the number of stillbirths per thousand births in the Netherlands. In order not to underestimate the overall level of foetal mortality, data for stillbirths with unknown father (16 percent of total) are proportionally redistributed over the age groups. In spite of this, stillbirth rates in the youngest age groups are probably still somewhat underestimated. The U-shaped pattern clearly corresponds with that of the mother, but the age effect of the father appears to be less distinct. The Figure suggests that, at higher ages, physiological causes are more important among women than among men. On the other hand it is likely that among fathers other than physiological causes play a role in the higher risks at younger ages, in view of sperm cell damage that is expected to increase with age. Unfortunately, due to the lack of further biological and socio-economic data on the father, as well as the necessity to eliminate the effect of mother’s age – ages of both parents showing a strong correlation – this assumption cannot be further examined here.
0 5 10 15 20 25
< 20 years 20-24 years 25-29 years 30-34 years 35-39 years 40-44 years 45+ years per thousand (live and still-)
births
Figure 5: Percentage of births (all parities) by age of mother, 1950-2002
Unlike older mothers, for younger mothers physiological reasons probably play only a small role in perinatal mortality (Van Enk et al., 2000) and infant mortality. Other factors, such as an unfavourable socio-economic position, the absence of a partner, a (related) lack of social support and a relatively high prevalence of sexually transmitted diseases play a greater role in this age group. In turn, these factors are strongly correlated to ethnicity. Infants of non-western foreign mothers turn out to have a risk of mortality that is around one third higher than average (Van Duin, 2002; Garssen et al., 2003).
Not only do mothers aged 40 or older have a higher risk of stillbirth when they have a baby, there are also more of them than of teenage mothers (Figure 5). While the number of babies born to teenage mothers has fallen on balance since 1990, from 4.4 to 3.3 thousand (in 2003), the number of newborn babies with a mother in her forties rose from 2.4 to 4.7 thousand. Moreover, unlike a few decades ago when the proportion of older mothers was much larger than it is today, more and more women in their forties have their first baby at this age. Regardless of mother’s age, firstborn children have a higher risk of mortality. Figure 6 gives a picture of how substantially the proportions of older mothers having their first baby have risen in recent decades. In 2003 one in eleven first born babies had a mother aged 36 or older, compared with one in 68 in 1975.
0 1 2 3 4 5 6 7 8 9
1950 1955 1960 1965 1970 1975 1980 1985 1990 1995 2000 % of all live births
Studies conducted in other countries have shown that babies of unmarried mothers have a higher mortality risk than those of married mothers. On the basis of figures for the United States, a doubled risk was found (MacDorman and Atkinson, 1999). However, the presence of a partner is much more important than the marital status of the mother, especially in a society where unmarried cohabitation – and particularly persisting cohabitation after the birth of a baby - has become acceptable. Data from Flanders show that babies of mothers who are not married, and whose father is not recorded on their birth certificate, have a fourfold risk of dying compared to children of married mothers (www.wvc.vlaanderen.be). There is little difference in mortality risk between children of married mothers and children with a father recorded on the birth certificate. In the Netherlands, too, children of a mother without a partner have an above average risk of dying. This situation is common among teenage mothers, and also explains why children of Turkish and Moroccan teenage mothers – who are usually married – are less likely to die than those of Antillean mothers (Achterberg and Kramers, 2001). Only one in fifty Antillean teenage mothers are married at the time they have their baby, and the remainder are mostly single (Garssen, 2004).
Figure 6: Percentage first births by age of mother, 1950-2002
In addition to birth rank and presence of a father, short birth intervals also result in a higher risk of perinatal mortality (Golding, 1991). Smits and Essed (2001) attribute the
0 0,5 1 1,5 2 2,5 3 3,5 4 4,5 5
1950 1955 1960 1965 1970 1975 1980 1985 1990 1995 2000
% of all live born first children
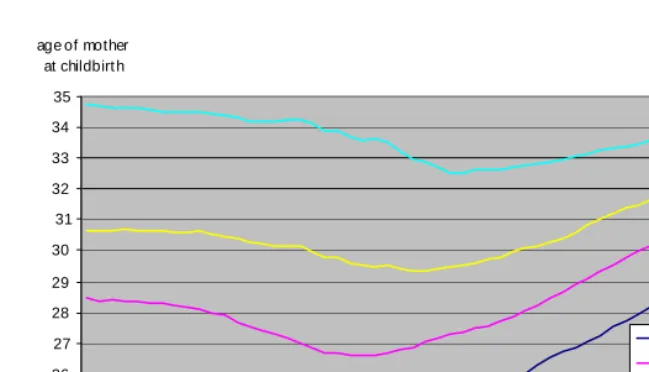
Figure 7: Average age of mother at childbirth, by parity, 1950-2002
3.2 Socio-economic status and ethnic origin
Various studies have established a connection between socio-economic status (SES), ethnic origin and infant mortality. A number of studies also tried to determine the separate effects of SES and origin, but there are no unequivocal results. This is because of the complexity of the relationship between SES and behaviour that partly depends on SES and partly on the cultural identity of the ethnic groups. Because these aspects may have fluctuating degrees of both positive and negative effects on health, the relationship between SES and mortality will also show differences between ethnic groups. Thus Kunst et al. (2003) concluded that the differences in health by SES are great for Antilleans, but absent for Moroccans. For Moroccans this has a downward effect on mortality, an effect that may also be valid for young babies. The Mediterranean diet and the fact that only few of them smoke and drink alcohol are factors that are good for the health of mothers and mothers to be. On the other hand it is feasible that Turkish children are more than average exposed to the damaging effects of tobacco smoke (Van Velzen-Mol et al., 1997), as a high percentage of Turkish men smoke and young children are often put down to sleep in the living room.
23 24 25 26 27 28 29 30 31 32 33 34 35
1950 1955 1960 1965 1970 1975 1980 1985 1990 1995 2000 age of mother
at childbirt h
SES is probably important, but for children socio-cultural and lifestyle factors also seem to play an important part (Schulpen, 1996). Van Driel and Van Steenbergen (1996) conclude that SES (at least SES based on neighbourhood of residence) is only slightly associated with perinatal mortality, but is not associated with infant mortality. Van Enk and Buitendijk (1996) also find no relation between SES (neighbourhood) and perinatal mortality. Above a certain threshold value, the material aspects of SES, which are in principle easy to measure accurately, probably hardly relate to mortality. American research (Finch, 2003) has shown that up to a certain level, family income is related to the level of infant mortality, but above that level it is not.
0 2 4 6 8 10 12 14
other non-western Antillean/Aruban Surinamese Moroccan of which Turkish non-western western Dutch
deaths per thousand (live and still-) births
stillbirth after pregnancy of 24+ weeks early neonatal death
Figure 8: Perinatal mortality by ethnicity of child, 1997-2002
In the Netherlands, just as in other western countries, non-western foreign babies have a higher than average risk of mortality. However, there are substantial differences between the ethnic origins, which sometimes even have lower mortality rates than Dutch native babies. This is the case, for example, for some Asian groups of origin, but not for the groups that are relatively strongly represented in the Netherlands (Turks, Moroccans, Surinamese and Antilleans/Arubans).
thousand). The risk of foetal death was nearly 40 percent higher for all non-western groups combined than for the native group.
The differences in perinatal mortality between non-western groups turn out largely to be caused by differences in the mortality risk in the first seven days after birth (Figure 9). This first week mortality is most unfavourable for Surinamese and Antillean/Aruban babies. Their risk of dying in the first week is significantly higher than that for Turkish babies. There is little difference in the risk of stillbirth, however, between the various non-western groups.
For infant mortality, too, the situation for non-western foreign babies is less favourable than for native babies: their risk of dying is on average some 30 percent higher. Again the highest mortality rates are recorded for babies with at least one Surinamese or Antillean/Aruban parent. Their risk of dying in infancy is 40 to 50 percent higher than that of native babies.
In a relative sense, the largest differences are in infant mortality after the first four weeks. In this period mortality is highest for Turkish and Moroccan babies: they run more than twice the risk of dying as native babies.
Figure 9: Infant mortality by ethnicity of child and age at death, 1997-2002
The composition of the group of babies to which these figures relate is changing quite quickly (Figure 10). In 2002 27.7 thousand babies were born to first-generation non-western mothers. About one in seven babies born in the Netherlands belong to this group.
0 1 2 3 4 5 6 7 8
other non-western Antillean/Aruban Surinamese Moroccan of which Turkish non-western western Dutch
deaths per thousand live births
The proportion of children who run the highest mortality risks at the moment has decreased (Turks and Surinamese) or remained almost unchanged (Moroccans and Antilleans/Arubans). Babies from other ethnic groups for whom – depending on their ethnic origin – very different mortality risks apply, are increasing in number. On the basis of Statistics Netherlands’ forecast of the foreign population in the Netherlands, this trend may be expected to continue into the twenties of the present century. The changing composition of this second generation is not expected to have an upward effect on perinatal and infant mortality.
In this respect, it is not easy to determine the mortality rate of children born to the second generation, a strongly growing group. These children belong to the third generation, and are counted as Dutch natives in the population statistics. To calculate mortality for these babies, the mothers’ personal details must be linked to the birth record.
3.3 Multiple births
basis for such a calculation, and that fertility treatment should be seen as the main cause for the increase in multiple births.
Figure 10: Percentage non-western births by ethnicity of child, 1997-2002
Other countries in Europe have also measured an increase in the proportion of multiple births, but the increase in the Netherlands was stronger than in most of these countries (Bréart et al., 2003). Only in Greece and Denmark there were, in comparison, slightly more multiple births than in the Netherlands at the end of the 1990s. As the average age of the mother at birth hardly differs between these countries, this development is probably rooted in the differences in the method and frequency of assisted reproduction. In addition, although part of the increase in the number of multiple births may be attributed to the older ages at the birth of the first child, on the other hand the number of third (and higher order) children has decreased in the course of time. For higher parity pregnancies there is also an increased risk of multiple birth.
0 5 10 15 20 25 30 35 40
1997 1998 1999 2000 2001 2002 %
Figure 11: Number of multiple births per 1000 live births, 1950-2002
Mother’s age is thus probably only of minor, but not negligible, importance for the increase in the percentage of multiple births. Most of the increase in the share of multiple births since the 1980s is probably related to assisted reproduction. Doctors using in vitro fertilisation, a method used since the end of the 1970s, soon started to perform ovarian hyperstimulation as the chance of becoming pregnant was greater if more than one embryo was replaced into the uterus. This practice resulted in a substantial increase in the number of multiple pregnancies. In the Netherlands, too, it was common to replace four or five embryos, although this number was reduced to two or three in the 1990s.
Today no more than two are replaced at a time (Braat et al., 2003). Although this reduces the number of multiple pregnancies (Huisjes et al., 1998), it has little effect on the number of twin pregnancies after successful treatment, still representing between 20 and 35 percent of all births in these cases (Braat et al., 2003).
8 10 12 14 16 18 20
1950 1955 1960 1965 1970 1975 1980 1985 1990 1995 2000
In view of the above the development in the number of twins in recent decades is mostly determined by the development of the number of dizygotic twin births. Figure 12 shows an estimation of the number of dizygotic and monozygotic twins, calculated by means of the ‘Weinberg distribution’ (Weinberg, 1934).
Figure 12: Estimated number of dizygotic and monozygotic twins, 1950-2002 (5 year moving averages)
Multiple pregnancies run an above average risk of resulting in premature birth, with all the complications this involves. Such pregnancies also lead to a greater risk of congenital abnormalities. In addition there is a higher risk of anaemia, bleeding, hypertension and pre-eclampsia during pregnancy (Hepp, 1989). It should be mentioned in this respect that for single births as a result of in vitro fertilisation the risks of perinatal complications and deaths are also increased (Anthony et al., 2002).
3.4 Baby’s sex
At all ages, men run a higher mortality risk than women. This is also the case for the youngest babies and even for the unborn. In the period 1996-2002 there were 7 percent more male than female foetal deaths (after a pregnancy of at least 24 weeks).
0 0,5 1 1,5 2 2,5 3 3,5 4
1950 1955 1960 1965 1970 1975 1980 1985 1990 1995 2000
x 1000
The difference in mortality after birth is considerably larger. In recent years some 20 percent more boys than girls died in the first year of life (Figure 13), although this difference has diminished in the course of time. Half a century ago the infant mortality rate for boys was around 30 percent higher than that for girls. Disorders which originate in the perinatal period and congenital malformations, deformations and chromosomal abnormalities together account for more than four in every five infant deaths (table 2). The incidence of the former disorders is about a quarter higher among boys than among girls. This difference is smaller for congenital malformations, deformations and chromosomal abnormalities (around 12 percent), but varies strongly between types of abnormalities. Cardiovascular defects are much more prevalent (nearly 40 percent) among boys than among girls, but the incidence of neural defects is 20 percent lower than for baby girls. Baby boys are also at a disadvantage for most of the more unusual causes of death. In the period 1996-2002, for example, the incidence of SIDS was 60 percent higher for boys than for girls, and non-natural causes of death affected 40 percent more boys.
0 5 10 15 20 25 30
1950 1955 1960 1965 1970 1975 1980 1985 1990 1995 2000
boys
girls
Table 2: Number of infant deaths per 100 thousand live births, by cause of death and sex, 1996-2002
boys girls
Infectious and parasitic diseases 13.4 12.4
Neoplasms 3.2 4.9
Endocrine, nutritional and metabolic diseases 9.4 6.2
Diseases of nervous system 16.2 12.4
Diseases of circulatory system 7.6 5.6
Diseases of respiratory system 4.3 3.2
Conditions originating in perinatal period 284.9 223.5
Congenital malformations, deform. and chrom. abnormalities 187.2 167.3
of which of nervous system 27.6 35.0
circulatory system 59.4 42.7
Ill-defined and unknown causes 32.4 21.8
of which sudden infant death syndrome 19.2 11.8
External causes 11.2 8.2
of which accidents 6.4 5.6
assault 2.9 1.6
Other causes of death 4.3 5.9
Total 574.1 471.4
3.5 Pregnancy duration
Figure 14: Distribution of number of stillbirths by duration of pregnancy, 1996-2002 (excluding duration unknown)
0 1 2 3 4 5 6 7 8
24 25 26 27 28 29 30 31 32 33 34 35 36 37 38 39 40 41 42 43 44
Figure 15: Distribution of number of early neonatal deaths by duration of
pregnancy, 1960, 1980 en 2000
3.6 Other risk factors
In addition to the risk factors described above for which (supplementary) information from Statistics Netherlands is available, there are a number of other well-known risk factors. The most important among these are lifestyle during conception and pregnancy (especially smoking, alcohol use and sexual activity), parents’ educational level (especially that of the mother) and consanguinity of the parents (predominantly inter-cousin marriages).
Smoking is an important determinant of premature birth, perinatal mortality and infant mortality. Smoking during pregnancy may lead to abnormal development of the placenta, premature birth and delayed growth and may also be accountable for 15 percent of all premature births (Andes and Day, 2000). The risk of low birth weight (less than 2,500 grams) is double for babies of mothers who smoke, and their length and cranial circumference is smaller than average. In the western world smoking during
0 5 10 15 20 25 30
17 18 19 20 21 22 23 24 25 26 27 28 29 30 31 32 33 34 35 36 37 38 39 40 41 42 43 44 duration of pregnancy in weeks %
pregnancy is one of the most important risk factors for low birth weight (Robinson et al., 2000), and even moderate smoking has a demonstrable negative effect. The relation between the number of cigarettes smoked and birth weight is a curve in which the largest reduction in birth weight occurs at a low degree of exposure (England et al., 2001); smoking less during pregnancy therefore does not have a proportionately positive effect on the baby’s health. For this same reason it is not surprising that passive smoking may also have a negative effect on birth weight (Windham et al., 2000). Passive smoking during the first year after birth is also an important risk factor for respiratory disease and SIDS: the mortality risk of babies with smoking mothers is twice as high as that for babies of non-smokers (Dying and Sanner, 1999).
The percentage of women who continue to smoke during pregnancy has decreased in recent years, but is still considerable. This percentage is probably relatively high in the Netherlands compared with other countries in the European Union. In 1996 25 percent of pregnant women smoked before they were pregnant and 21 percent during their pregnancy (Crone, 2003). Babies are in recent years also less frequently exposed to cigarette smoke, although the figures are still comparatively high (Hothouse et al., 2002). According to a study by TNO, 46 percent of families in the Netherlands smoked in the living room in the presence of a small baby in 1996. Eight percent of young babies were exposed to cigarette smoke in cars, and 4 percent during feeding (Baker et al., 1997).
The effect of alcohol depends on the amount consumed and the mother’s age. Older pregnant women who belong to the category of heavy drinkers have an increased risk of a baby with foetal alcohol syndrome (Jacobsen et al., 1998). Alcohol use during pregnancy is the most prevalent non-genetic cause of mental development disorders.
The frequency of premature birth and miscarriage is also connected to sexual aspects of lifestyle. Research has shown that Surinamese, Antilleans, Ghanaians and people from the Cape Verde Islands relatively often show risky sexual behaviour and, consequently, have a higher incidence of genital infections (Hooykaas et al., 1991). Remarkably unfavourable pregnancy outcomes have been reported for black (non-Hindu) Surinamese girls (Van Enk and Buitendijk, 1996; Van Enk et al., 2000). According to Van Enk et al. (2000), about one in twenty pregnancies of black teenage girls have a fatal outcome, and one in seven pregnancies result in premature birth. The researchers attribute this unfavourable outcome partly to the higher prevalence of sexually transmitted diseases in this group. Van der Hoek et al. (1999) found an incidence of Chlamydia of 23 percent among black teenagers in Amsterdam, a considerably higher prevalence than in the rest of the population. Gonorrhoea is remarkably common among Surinamese, Antilleans and Arubans (Vogels et al., 2002).
that foetal mortality is four to five times as high among lower educated women as among higher educated women, in spite of the fact that the latter women are more often treated for fertility problems and that, consequently, more of them have twins. Early neo-natal mortality and infant mortality among lowly educated women is also higher, but to a lesser extent (Swimberghe at al., 2003). The risk of premature birth, low birth weight or birth defects is nearly double. Women with a low educational level show a more unfavourable behaviour with respect to the above-mentioned risk factors (smoking and drinking) and they are less likely to seek antenatal care, and if they do they start later. The risk of perinatal mortality for babies of parents with a university education is significantly lower and this relation is stronger for the mother than for the father (www.wvc.vlaanderen.be). For income, too, this relation has been shown (Cramer, 1995), with the already mentioned remark that income may only play a part up to a threshold value (Finch, 2003). Differences in mortality by parental ethnic origin cannot only be explained from differences in income and education (Hummer, 1993).
Children born to couples who are blood-related have a higher risk of congenital (autosomal recessive) disorders, and thus a higher mortality risk. Such consanguine relationships are more common in some foreign groups. Schulpen et al. (2001) estimate that about one quarter of marriages in the Turkish and Moroccan communities are between cousins. Among Turkish infants the largest number of deaths is attributed to ‘congenital malformations, deformations and chromosomal abnormalities’ (40 percent of the total in 1996-2001; Garssen et al., 2003), a percentage that is slightly above the average for the same period (34 percent). Although foreign research has shown that ethnic groups in which intermarriage is common have significantly higher perinatal mortality rates (Chitty and Winter, 1989), the degree to which this phenomenon increases perinatal mortality cannot be quantified on the basis of figures available here. Compared with other health risks, the extra risk as a consequence of marriages between cousins is probably small (Bennett et al., 2002). For cousins the risk of a seriously ill child is 4.5 to 7 percent, compared with 3 to 4 percent for the total population.
4. Conclusions and discussion
In recent decades, perinatal mortality in the Netherlands has fallen sharply. This decline has levelled out since the 1980s, however, which has resulted in the Netherlands slipping down a number of places in the international ranking of countries with favourable mortality rates.
The fact that Dutch perinatal mortality rates are high within Western Europe can be rendered more plausible (and less ‘reprehensible’) by the observation that the Netherlands is one of the leaders in Europe on all important risk factors (such as mother’s age and multiple births; Klazinga, 2004). Other important factors exerting an upward effect on perinatal mortality are a high percentage of non-western foreign women, less frequent use of antenatal screening, non-treatment of severely handicapped or seriously ill babies and smoking by pregnant women.
Both foetal mortality and infant mortality show a U-shaped relationship with mother’s age. For foetal mortality the risk seems to be significantly higher for the oldest mothers, whereas children of the youngest mothers run the greatest risk of infant mortality. Remarkably, too, babies of 20-24 year-old mothers have an above average risk of infant mortality. This U-shaped relationship persisted in recent decades, although the levels of foetal and infant mortality fell across the board. The fact that more and more women have their first child when they are in the second half of their thirties, or even later, results in a relatively higher risk of foetal mortality in particular. Dutch (first-time) mothers are, together with mothers in Greece and Spain, among the oldest in the world (Coleman and Garssen, 2002). This delay of childbearing has negatively affected the Dutch perinatal mortality rates.
To a lesser extent, a higher age of fathers at the birth of a first child also contributes to an increased foetal and infant mortality rate. Presently, one in eleven first-borns have a father aged 40 years or older, up from one in seventeen in the mid-1990s.
The relation between a short birth interval and higher perinatal mortality found in some studies is probably fairly weak. For most births in the Netherlands the birth intervals have not decreased for a long time. Since the 1970s the interval between second and third children has halved, but since the mid-1990s it has hardly changed at all.
birth. In this period Turkish and Moroccan babies are worst off, with more than twice the risk of mortality of native Dutch babies.
The fact that the Netherlands houses relatively many foreigners who belong to the groups with an above average risk of perinatal mortality, plays a part in the changes in the international rankings mentioned above. The exact extent of this role, in its international perspective, is difficult to quantify however, as international data on numbers of foreigners (according to the definition used here) are not available. On the basis of data for the first generation, which also are not available for all countries involved, it does seem that the Netherlands, together with France and Sweden, is one of the countries with the highest percentage of foreigners. In the Netherlands, all countries of origin with a higher mortality risk together probably account for an above average share of the population. In Sweden, for example, there are many more foreigners with a western background, while people born in Turkey – one of the largest groups of foreigners in Sweden, only account for 3.5 per thousand of the population (compared with 11.4 per thousand in the Netherlands; figures for 2001).
First week mortality in particular, which as mentioned above is higher for Surinamese and Antilleans, seems to be stagnating more in the Netherlands than in many other countries in the European Union. Postneonatal mortality (28-365 days), on the other hand, shows one of the most favourable rates in Europe (Achterberg et al., 2003).
The risk of perinatal mortality is considerably higher than average for multiple births. The strong increase in the age at which Dutch mothers have their babies has had an upward effect on the number of multiple births, and thus on perinatal mortality. The increase in the number of multiple births has been larger in the Netherlands than in most other European countries (except Greece and Denmark), and the differences in the average age at which women have their babies does not show a clear correlation with this. Although age has played an important part in the increase in the number of multiple births since the beginning of the 1980s – according to calculations presented here nearly half are caused by age – the frequency of fertility treatment explains the largest part of the increase. International differences in the occurrence of multiple births are probably connected with the methods and frequency of fertility treatment. The upward effect of this on perinatal mortality is only small though.
factors which contribute to perinatal mortality. International differences in the significance of these factors have partly had an effect on the position of the Netherlands in the international rankings. Smoking during pregnancy and in the presence of the baby, alcohol consumption during and after conception, risky sexual behaviour and consanguine relationship are a few important, preventable factors. For most of these factors no (internationally comparable) data are available, although it is known that Dutch women (along with Danish women) smoke relatively often during pregnancy.
The fact that antenatal diagnostics are used less widely in the Netherlands, and that in the case of extreme premature births advanced medical technology is not used as a matter of course, has also had an effect on perinatal mortality. Developments in this area cannot simply be judged to be favourable or unfavourable, as they are connected with ethical issues on which opinions differ widely. Using medical technology to its utmost in cases of congenital abnormalities and extreme premature birth, in order to reduce perinatal and infant death, would also result in higher morbidity and mortality after the first year of life.
Today, figures on perinatal and maternal mortality are among the most used indicators for a population’s state of health. Of these indicators, infant mortality is considered to be the most objective measure of heath (Schulpen, 1996). The disadvantage of these measures, however, is that as the mortality concerned becomes more and more rare, it loses its significance as an indicator for the general state of health, and in particular as an indicator for the quality of perinatal health care. Both international differences in observations and small errors in measurement, and care practices with respect to extreme premature birth or babies with severe congenital handicaps, have a relatively large effect on the calculated figures. Indeed, as summary measures the figures on perinatal mortality and infant mortality are inadequate, and care and policy aspects that influence the international differences should also be taken into account for a good understanding of developments and trends in this area.
5. Acknowledgements
References
Achterberg. P.W. and P.G.N. Kramers, 2001, Een gezonde start? Sterfte rondom de geboorte in Nederland: trends en oorzaken vanuit internationaal perspectief. RIVM-report 271558003. RIVM, Bilthoven.
Achterberg, P.W., M.J.J.C. Poos and E.A. Van der Wilk, 2003, Zijn er internationale verschillen? In: Volksgezondheid Toekomst Verkenning, Nationaal Kompas Volksgezondheid version 2.5, 11 December 2003. RIVM, Bilthoven (www.nationaalkompas.nl).
Andres, R.L. and M.C. Day, 2000, Perinatal complications associated with maternal tobacco use. Seminars in Neonatology 5(3), pp. 231-241.
Anthony, S. et al., 2001, The reliability of perinatal and neonatal mortality rates: differential under-reporting in linked professional registers vs. Dutch civil registers. Paediatric and Perinatal Epidemiology 15, pp. 306-314.
Anthony, S. et al., 2002, Congenital malformations in 4224 children conceived after IVF. Human Reproduction 17(8), pp. 2089-2095.
Bakker, M.J., M.R. Crone and R.A. Hirasing, 1997, Preventie van passief roken door het ongeboren en geboren kind. Medisch Contact 25, pp. 799.
Braat, D.D.M., Y. Schönbeck and J.A.M. Kremer, 2003, Meerlingzwangerschappen; epidemiologie en beleid. Nederlands Tijdschrift voor Geneeskunde 147(40), pp. 1952-1955.
Braat, D.D.M., Y. Schönbeck and J.A.M. Kremer, 2004, Reply to the comment of Lambalk et al. (2004) on ‘Meerlingzwangerschappen; epidemiologie en beleid’. Nederlands Tijdschrift voor Geneeskunde 148(9), pp. 449-450.
Bréart, G., H. Barros, Y. Wagener and S. Prati, 2003, Characteristics of the childbearing population in Europe. European Journal of Obstetrics & Gynaecology and Reproductive Biology 111, pp. S45-S52.
Buitendijk, S., J. Zeitlin, M. Cuttini, J. Langhoff-Roos and J. Bottu, 2003, Indicators of fetal and infant health outcomes. European Journal of Obstetrics & Gynaecology and Reproductive Biology 111, pp. S66-S77.
Chitty, L.S. and R.M. Winter, 1989, Perinatal mortality in different ethnic groups. Archive of Disease in Childhood (64), pp. 1036-1041.
Cramer, J.C., 1995, Racial and ethnic differences in birth weight. The role of income and financial assistance. Demography 32, pp. 231-247.
Crone, M.R., 2003, The prevention of involuntary smoking by children. Dissertation University of Amsterdam, Amsterdam.
De Galan-Roosen, A.E, J.C. Kuijpers, Y.B. Oei, D. Van Velzen and J.P. Mackenbach, 1997, Discrepantie tussen resultaten van registratie van perinatale doodsoorzaken door CBS en door eigen onderzoek in de regio Delft-Westland-Oostland. Nederlands Tijdschrift voor Geneeskunde 141, pp. 237-240.
De Leeuw, R. et al., 2000, Treatment choices for extremely preterm infants: an international perspective. Journal of Pediatrics 137(5), pp. 608-615.
Doornbos, J.P.R., H.J. Nordeck and P.E. Treffers, 1987, The reliability of perinatal mortality statistics in the Netherlands. American Journal of Obstetrics and Gynaecology 156, pp. 1183-1187.
Dybing, E. and T. Sanner, 1999, Passive smoking, sudden infant death syndrome and childhood infections. Human Exposure Toxicology 18(4), pp. 202-205.
Finch, B.K., 2003, Early origins of the gradient: the relationship between socioeconomic status and infant mortality in the United States. Demography 40(4), pp. 675-699.
Gargiullo, S.C. Zahniser and W.H. Hannon, 2001, Measures of maternal tobacco exposure and infant birth weight at term. American Journal of Epidemiology 153, pp. 954-960.
Garssen, J., 2004, Tienermoeders: recente trends en mogelijke verklaringen. Bevolkingstrends 52(1), pp. 13-22. Statistics Netherlands, Voorburg/Heerlen. Garssen, J., V. Bos, A. Kunst and A. Van der Meulen, 2003, Sterftekansen en
doodsoorzaken van niet-westerse allochtonen. Bevolkingstrends 51(3), pp. 12-27. Statistics Netherlands, Voorburg/Heerlen.
Geronimus, A.T., 1992, The weathering hypothesis and the health of African-American women and infants: evidence and speculations. Ethnicity and Disease 2, pp. 207-221.
Gourbin, C. and G. Wunsch, 1999, Age differentials in infant mortality. Genus LV (1-2), pp. 61-72.
Hepp, H., 1989, Hohergradige Mehrlinge – ein klinisches und ethisches Problem der Reproduktionsmedizin. Geburtshilfe Frauenheilkunde 49, pp. 225-233.
Hertoghe L., P. De Wals, M. Piron, F. Bertrand and M.F. Lechat, 1987, Comparability of published mortality rates in Western Europe: the quantitative impact of differences in gestational age and birthweight criteria. European Journal of Pediatrics 146, pp. 473-476.
Hofhuis, W., P.J.F.M. Merkus and J.C. de Jongste, 2002, Nadelige effecten van passief roken op het (ongeboren) kind. Nederlands Tijdschrift voor Geneeskunde 146(8), pp. 356-359.
Hoogendoorn, D., 1986, Indrukwekkende en tegelijk teleurstellende daling van de perinatale sterfte in verschillende landen. Nederlands Tijdschrift voor Geneeskunde 130, pp. 1436-1440.
Hooykaas, C., F.W. Van der Velde, M.M. Van der Linden and G.J. Van Doornum, 1991, The importance of ethnicity as a risk factor for STD’s and sexual behaviour among heterosexuals. Genitourinary Medicine 67, pp. 378-383. Huisjes, A.J.M., H.W. Bruinse, R.P.M. Steegers-Theunissen, J.M. Merkus and G.H.
Visser, 1998, Meerlingen: een blijvend probleem bij kunstmatige voortplantingstechnieken. Nederlands Tijdschrift voor Geneeskunde 142, pp. 2290-2293.
Hummer, R.A., 1993, Racial differentials in infant mortality in the U.S.: an examination of social and health determinants. Social Forces 72, pp. 529-554.
Jacobsen, J.L., S.W. Jacobsen, R.J. Sokol and J.W. Ager, 1998, Relation of maternal age and patterns of pregnancy drinking to functionally significant cognitive deficit in infancy. Alcoholism: Clinical and Experimental Research 22, pp. 345-351.
Kardaun, J., 2003, Overlijden tijdens zwangerschap en in de eerste levensmaand. Internal paper Statistics Netherlands, 8/15 December 2003.
Keirse, M.J.N.C., 1987, Registratie en betrouwbaarheid van perinatale sterfte in Nederland. Nederlands Tijdschrift voor Geneeskunde 131(21), pp. 891-895. Klazinga, N., 2004, Perinataal presteren (editorial). TSG Tijdschrift voor
Köhler, W, Vroeg dood. Katern Wetenschap en Onderwijs NRC, 20 December 2003. Kunst, A.E., V. Bos and J.P. Mackenbach, 2003, De verwevenheid van
gezondheidsverschillen naar sociaal-economische status met gezondheids- verschillen naar sekse en etniciteit. Een beschrijvend overzicht. Department of Public Health, Erasmus MC, University Medical Center Rotterdam, Rotterdam. Lambalk, C.B., R. Schats, O.P. Bleker, P.M. Elferink and J.F. Orlebeke, 2004,
Commentary on Braat, D.D.M. et al., 2004, ‘Meerlingzwangerschappen; epidemiologie en beleid’. Nederlands Tijdschrift voor Geneeskunde 148(9), pp. 448-449.
Lian, Z.H., M.M. Zack and J.D. Erickson, 1986, Paternal age and the occurrence of birth defects. American Journal of Human Genetics 39, pp. 648-660.
Lieberman, B., 1998, An embryo too many? Human Reproduction 13, pp. 2664-2666. MacDorman, M.F. and J.O. Atkinson, 1999, Infant mortality statistics from the 1997
period linked births/infant death data set. National Vital Statistics Reports 47(23), pp. 1-24.
Mackenbach, J.P., 1992, De Nederlandse zuigelingensterfte in de jaren tachtig. Nederlands Tijdschrift voor Geneeskunde 136(24), pp. 1140-1143.
Richardus, J.H., W.C. Graafmans, S.P. Verloove-Vanhorick and J.P. Mackenbach, 1998, The perinatal mortality rate as an indicator of quality of care in international comparisons. Medical Care 36(1), pp. 54-66.
Richardus, J.H., W.C. Graafmans, S.P. Verloove-Vanhorick and J.P. Mackenbach, 2003, Differences in perinatal mortality and suboptimal care between ten European regions: results of an international audit. British Journal of Obstetrics and Gynaecology 110(2), pp. 97-105.
Rychtaříková, J., C. Gourbin and G. Wunsch, 2004, Paternal age and child death: the stillbirth case. European Journal of Population 20, pp. 23-33.
Robinson, J.S., V.M. Moore, J.A. Owens and I.C. McMillen, 2000, Origins of fetal growth restriction. European Journal of Obstetrics & Gynecology and Reproductive Biology 92, pp. 13-19.
Schulpen, T.W.J., J.E. Van Steenbergen and H.F. Van Driel, 2001, Influences of ethnicity on perinatal and child mortality in the Netherlands. Archive of Disease in Childhood 84, pp. 222-226.
Scott, M.J., J.W.K. Ritchie, B.G. McClure, M.M. Reid and H.L. Halliday, 1981, Perinatal death recording: time for a change? British Medical Journal 282, pp. 707-710.
Smith, G.C.S., J.P. Pell and R. Dobbie, 2003, Interpregnancy interval and risk of preterm birth and neonatal death: retrospective cohort study. British Medical Journal 327, pp. 313.
Smits, L.J.M. and G.G.M. Essed, 2001, Short interpregnancy intervals and unfavourable pregnancy outcome: the role of folate depletion. The Lancet 358 (9298), pp. 2074-2077.
Statistics Netherlands, 2004, Statline, www.cbs.nl.
Stephansson, O., P.W. Dickman and S. Cnattingius, 2003, The influence of interpregnancy interval on the subsequent risk of stillbirth and early neonatal death. Obstetrics & Gynecology 102, pp. 101-108.
Swimberghe, S.L., H. Cammu, H. Verstraelen, G. Martens and D. Bekaert, 2003, De opleiding van de moeder staat in verband met de afloop van haar zwangerschap. Tijdschrift voor Geneeskunde 59(16-17), pp. 978-982.
Tas, R.F.J., 1990, Meerlingen in Nederland, 1900-1988. Maandstatistiek van de Bevolking 38(4), pp. 12-23. Statistics Netherlands, Voorburg/Heerlen.
Tas, R.F.J., 2001, Sterfte in de jaren negentig. Maandstatistiek van de Bevolking 49(2), pp. 6-9. Statistics Netherlands, Voorburg/Heerlen.
Van der Pal-De Bruin, K.M. et al., 2002, The influence of prenatal screening and termination of pregnancy on perinatal mortality rates. Perinatal Diagnosis 22(11), pp. 966-972.
Van der Wal, G., J.M. Bosma and S.L. Hosman-Benjaminse, 1996, Late zwanger- schapsafbrekingen in Noord-Holland. Incidentie en aandoeningen. Nederlands Tijdschrift voor Geneeskunde 140, pp. 605.
Van Duin, C., 2002, Hogere zuigelingensterfte in minder welvarende gebieden en onder niet-westerse allochtonen in Nederland. Maandstatistiek van de Bevolking 50(8), pp. 4-6. Statistics Netherlands, Voorburg/Heerlen.
Van Enk, A. and S. Buitendijk, 1996, Perinatale sterfte bij allochtonen (LVR-analyse), 1990-1993. In: Schulpen, T.W.J. (ed.), 1996, op. cit.
Van Enk, W.J.J., W.H.M. Gorissen and A. Van Enk, 2000, Teenage pregnancy and ethnicity in the Netherlands: frequency and obstetric outcome. European Journal of Contraception and Reproductive Health Care 5, pp. 77-84.
Van Hoorn, W.D. and J. de Beer, 1998, Analysis and projection of regional mortality for the countries of the European Economic Area. Maandstatistiek van de Bevolking 46(6), pp. 8-18. Statistics Netherlands, Voorburg/Heerlen.
Van Velzen-Mol, H,W.M., R.J.F. Burgmeijer, M. Hofkamp and A.L. Den Ouden, 1997, Consensus preventie van wiegendood. Nederlands Tijdschrift voor Geneeskunde 141(37), pp. 1779-1783.
Vogels, T. et al., 2002, Jongeren, seksualiteit, preventie en hulpverlening. Een verkenning van de situatie in 2002. TNO-report 2002.281. TNO, Leiden.
WBC (Wetenschappelijke Begeleidings Commissie van de landelijke neonatale registratie), 1998, Increase in the number of premature births in The Netherlands: comparison of 1983 and 1993. Nederlands Tijdschrift voor Geneeskunde (142)3, pp. 127-131.
Weinberg, W., 1934, Differenzmethode und Geburtenfolge bei Zwillingen. Genetica 16, pp. 282-288.
Windham, G.C., B. Hopkins, L. Fenster and S.H. Swan, 2000, Prenatal active or passive tobacco smoke exposure and the risk of preterm delivery or low birth weight. Epidemiology 11, pp. 427-433.