Dental caries in children: a comparison of
one non-fluoridated and two fluoridated
communities in NSW
Amit Arora
A,Band Robin Wendell Evans
A APopulation Oral Health, Faculty of Dentistry,The University of Sydney B
Corresponding author. Email: [email protected]
Abstract: Aim:The aim of the Child Dental Health
Survey in Lithgow was to establish the oral health status of primary schoolchildren to assist the local council in deciding whether to fluoridate the water and to provide a baseline for future monitoring of changes in caries rates.Methods: All six primary schools in Lithgow were invited to participate, and 653 children aged 6–12 years were clinically exam-ined for dental caries. World Health Organization criteria were used, whereby a decayed tooth is defined as a cavity into the dentine. Caries preva-lence was measured as the mean number of decayed, missing and filled teeth (primary: dmft; secondary: DMFT). Significant caries indices were calculated to categorise children with the mean dmft/DMFT score of the highest 30 percentage (SiC) and the highest 10 percentage (SiC10) of caries. Data for Lithgow were compared with school dental service data for the socioeconomically comparable fluoridated town-ships of Bathurst and Orange.Results:The primary dentition caries estimates (dmft, SiC and SiC10) in Lithgow children aged 6 years were 0.92, 2.72 and 5.81, respectively; the estimates for permanent den-tition caries (DMFT, SiC and SiC10) in Lithgow children aged 12 years were 0.69, 2.05 and 6.41,
respectively. The caries prevalence in the permanent dentition of Lithgow children was significantly higher than that in children living in the fluoridated towns of Bathurst and Orange. No significant differ-ences were observed in the estimates for primary teeth. Conclusion: Although the mean levels of dental caries in schoolchildren in Lithgow were low, oral health inequalities exist between children residing in non-fluoridated Lithgow and the fluori-dated locations of Orange and Bathurst. The local council decided that Lithgow will have fluoridated water by December 2010.
The prevalence of dental caries has declined over time among children in most industrialised countries,1,2 which can be attributed to increased use of fluorides, improved oral hygiene and a decreased frequency of sugar intake.3In 1958, the World Health Organization (WHO) recognised the importance of community water fluoridation and has repeat-edly supported it as a good public health policy to reduce the risk of dental caries.4However, the role of the community in decisions to fluoridate and the legislation for its implemen-tation vary throughout the world. For example, water fluor-idation is mandatory in Singapore and Ireland,5whereas in the United States there is no federal legislation on fluorida-tion and the decision depends on each state.5
Water fluoridation is not mandatory in New South Wales (NSW) and the decision to fluoridate water supplies rests with local government councils under the NSW Fluor-idation of Public Water Supplies Act 1957.6 Water
Vol. 21(11–12) November–December 2010
ISSN 1034 7674
NSW PUBLIC HEALTH
BULLETIN
CONTENTS – See back page w w w . p u b l i s h . c s i r o . a u / j o u r n a l s / p h b
fluoridation has been the predominant public health approach for caries prevention in NSW because of wide-spread coverage with public water supplies, and it is the most cost-effective, equitable, safe means of providing protection from tooth decay.7 More than half of NSW residents live in Sydney, which commenced water fluor-idation in 1968.8In 1993, 100% of metropolitan Sydney was fluoridated, but only 59% of people living elsewhere in NSW had access to fluoridated water.9In an effort to promote further uptake of fluoridation and to reduce the burden of dental caries, in 2004 the NSW Government increased the capital subsidy for installation of new fluor-idation plants from 50% to 100%. Since 2004, efforts by NSW Health, in partnership with area health services, the Australian Dental Association and local governments, has resulted in 94% of the NSW population having access to fluoridated water.10 In 2003, after 10 years of water fluoridation in the Blue Mountains, Evans et al.11found that water fluoridation had reduced the risk of one or more decayed teeth in both the primary and the permanent dentition by 65%. Researchers have reported significant differences in caries prevalence between non-fluoridated and fluoridated areas of NSW.12,13Consequently, to pro-mote water fluoridation in the 6% of rural communities in NSW that are non-fluoridated, locally relevant, up-to-date information on oral health is required.
Lithgow is a rural town located 145 km west of Sydney, with a population of 19 756. In 2005 it was the only area within the boundaries of the Sydney West Area Health Service that remained unfluoridated (Sivaneswaran S, written communication, December 2005). The aim of the Child Dental Health Survey in Lithgow was to establish the oral health status of schoolchildren aged 6–12 years to assist the local council decide whether to fluoridate the water, and to provide a baseline for future monitoring of changes in caries rates. In contrast to the previous broad surveys of children’s oral health in NSW, which included only a few children from this community, a systematic survey of Lithgow children’s dental health was conducted by two dental health professionals using WHO criteria.
Methods
The school principals of all six listed primary schools in the Lithgow local government area were approached by letter to take part in the survey. The parents of all schoolchildren were then invited to take part in the dental survey through a take-home information pack containing information and a consent form. Weekly reminders were sent for 4 weeks using the school newsletters. Children participated in the survey if written consent had been obtained from their parents.
Children aged 6–12 years were clinically examined between August 2006 and November 2006. Children were examined by two public health dental specialists in school-rooms with halogen lights as the light source. Teeth were
examined wet, and if necessary a ball-ended WHO probe was used for exploration. The diagnostic criteria for dental caries were those of the WHO, whereby a decayed tooth is defined as a cavity into the dentine.14The scores of the primary examiner (AA) were calibrated daily under the supervision of a calibrating examiner (RWE), and exam-iner reliability was assessed via Cohen’s Kappa statistic15 on duplicated scores obtained from both intra- and inter-examinations. The kappa value for inter-examiner relia-bility was 0.93, and the intra-examiner reliarelia-bility was 0.98.
Caries prevalence is often represented as the mean number of teeth that are decayed, missing due to decay (extracted) or filled due to decay (termed dmft for primary dentition and DMFT for permanent dentition).16In this study, caries prevalence in primary teeth is reported for children aged 6–10 years as primary (baby) teeth exfoliate with age, and that in permanent teeth is reported for children aged 6–12 years. As the distribution of caries prevalence is not normal but is highly skewed to particular population subsections, mean scores do not capture this skewness. The significant caries index (SiC) is the mean dmft/DMFT score of the 30% of the population with the highest scores.17,18This index can be modified to the mean dmft/ DMFT score of the 10% of the population with the highest scores (SiC10).
As it is possible that the children examined were not representative of the school-aged population, the estimated resident population at 30 June 2006 of children aged 6–12 years in Lithgow was used to calculate sampling weights for each child.19These weights were applied when calculating age-specific indices to produce estimates that were representative of children aged 6–12 years in Lithgow.
Data from Lithgow were compared with school dental service data from the socio-economically comparable fluori-dated townships of Bathurst and Orange. Statistical analysis was undertaken with EpiInfo (version 3.3.2, CDC, Atlanta, USA). Comparisons between the mean dmft/DMFT scores of children in Lithgow and Bathurst and Orange were tested with non-parametric methods (Wilcoxon signed rank test).
Approval to conduct this survey was obtained from the Human Research Ethics Committees of the University of Sydney, the NSW Department of Education and Training, the Catholic Education Board, and the Sydney West Area Health Service. The parents of children found to have caries were notified and given a referral to the public dental health system of the township.
Results
The overall sample included equal proportions of boys and girls. No statistically significant difference in caries experience was observed by gender in the primary or permanent dentition.
The population-adjusted caries experience in primary teeth of children aged 6–10 years is shown in Table 1. The mean dmft score increased from 0.92 to 1.91 between the ages of 6 and 9 years and then declined to 1.43 at age 10 years. The percentage of children with primary decay (dmft40) steadily increased across the age range 6–9 years, from 29.2% to 64.5%; however, this percentage subsequently decreased, and at 10 years of age only 53.9% of children showed evidence of decay in the primary teeth.
The SiC and SiC10for the primary teeth of children aged 6–10 years are shown in Figure 1. For the 30% of children with the most decay, the mean dmft per child was con-siderably higher than the mean for the entire age group, and ranged between 2.72 and 4.38 dmft per child. For the 10% of children with the most caries, the SiC10scores of 6- and 9-year-old children were more than six times and three times greater than the mean dmft scores, respectively.
The population-adjusted caries prevalence in permanent teeth of children aged 6–12 years is shown in Table 2. The mean DMFT score across all age groups was low, with a 12-year-old DMFT of 0.69. Less than 15% of children aged 6–8 years had permanent tooth decay (DMFT40); how-ever, by the end of primary school, 28.4% of children aged 12 years had permanent tooth decay.
The SiC and SiC10for the permanent teeth of children aged 6–12 years are shown in Figure 2. The SiC scores increased from 0.07 DMFT per child for children aged 6 years to 2.05 DMFT per child for children aged 12 years and, for each age group, ranged from approximately 2.5 to 3 times higher than the average DMFT. Across all age groups, the SiC10scores were 4–10 times higher than the correspond-ing age-specific mean DMFT scores.
The caries rates in the primary dentition of Lithgow children were not statistically different from those in
Bathurst and Orange (Table 3). In Lithgow, the mean dmft for children aged 6 years was 0.92, lower than the values recorded by the school dental services in Bathurst and Orange; however, this difference was not statistically significant.
Caries prevalence in the permanent dentition of Lithgow children was significantly higher than that of children living in the fluoridated towns of Bathurst and Orange (Table 4). The mean DMFT for children aged 12 years was 0.69 in Lithgow, 0.33 in Orange and 0.29 in Bathurst.
Discussion
Caries rates in the permanent teeth of Lithgow children were significantly higher than in those living in the fluoridated towns of Orange and Bathurst. No statistically significant differences were observed in caries prevalence in primary teeth between the three townships. The data from the survey provide an important snapshot of the oral Table 1. Population-adjusted primary dentition caries experience (dmft) statistics of children aged 6]10 years in Lithgow, NSW
Age (years)
Children (n)
Decayed (d) Missing (m) Filled (f) dmft dmft.0 (%)
Mean SD Mean SD Mean SD Mean SD
6 106 0.52 2.01 0.08 0.33 0.33 0.82 0.92 2.03 29.20
7 97 0.54 1.50 0.18 0.67 0.84 1.60 1.56 2.15 46.40
8 100 0.33 0.76 0.28 1.09 1.22 1.69 1.82 2.11 61.00
9 93 0.55 1.15 0.24 0.79 1.12 1.62 1.91 2.11 64.50
10 89 0.45 0.83 0.10 0.48 0.87 1.41 1.43 1.81 53.90
dmft: decayed, missing due to caries, filled teeth index for primary (baby) teeth. SD: Standard Deviation.
Data for 11- and 12-year-olds are not included because of exfoliation of primary teeth.
Pr
imar
y dmft
Age (years) 0
1 2 3 4 5 6 7
6 7 8 9 10
SiC SiC10 Mean
Figure 1. Significant caries indicies and mean caries prevalance for primary teeth of children aged 6–10 years in Lithgow, NSW, 2006.
Data for 11- and 12-year-olds are not included due to exfoliation of primary teeth. dmft: decayed, missing due to caries, filled teeth index for primary teeth. SiC: mean dmft score of the 30% of the population with highest caries rate.
SiC10: mean dmft score of the 10% of the population with
highest caries rate.
Dental caries in children
health status of Lithgow children and were presented to the local council for consideration of the fluoridation proposal.
A potential limitation of this study was the 44% response rate. It was anticipated that the participation rate would be good as the dental examinations were carried out at school; nevertheless, absenteeism was common. The response rate was similar to those of previous studies.20To overcome a possible sampling bias, a weighting procedure was used. As this study reports on the findings of clinical examina-tions, we did not report on the potential confounding factors for caries experience. We have, however, taken these into consideration and are conducting further research.
Caries prevalence in primary teeth increased between the ages of 6 and 9 years and then declined due to natural exfoliation. It was also observed that the number of filled primary and permanent teeth increased with age. A possi-ble explanation could be the progress of carious lesions
over time in the absence of fluoridation and the need for dental restoration. In our study, the mean dmft for children aged 6 years in Lithgow was 0.92, much lower than the statewide dmft of 1.53 for 5–6-year-olds reported in 2007.13The dmft was also lower than the mean for 5–6-year-olds in the Sydney West Area Health Service, which was found to be 1.77 in 2007.13 Our data for other age groups were consistent with those for other non-fluoridated areas of NSW, such as Mudgee (dmft¼1.4) (Sivaneswaran S, written communication, August 2009).
The caries experience in the permanent dentition was similar to that for primary teeth. The DMFT for children aged 12 years in Lithgow was 0.69, lower than the statewide DMFT score for 11–12-year-old children reported in 200713 and also lower than the mean DMFT of 0.88 for 11–12-year-olds in Sydney West Area Health Service in 2007.13
The caries rates in the permanent teeth of Lithgow children were higher than the rates in children living in Orange and Bathurst. This may indicate that water fluoridation reduces the risk for dental decay, as noted in other publications from NSW.11–13This was not, however, the case for the primary dentition. The finding that the differences in caries prevalence were not statistically significant for primary teeth may have been due to differences in the populations sampled in the three communities. Furthermore, our rates for the fluoridated and unfluoridated areas were lower than the statewide data.13 This may be due to overreporting of dental decay in statewide examinations, as the State diagnostic criteria included cavitated and non-cavitated carious lesions.
We used the WHO clinical criteria to diagnose caries, whereas the school dental service has access to radiographs as well, resulting in differences in diagnostic criteria and the finding of more caries. In our study, the examiners’ scores were highly reliable, as the clinical examinations were conducted by trained and calibrated dental public health specialists; the school dental service data were Table 2. Population-adjusted permanent dentition caries experience (DMFT) statistics of children aged 6]10 years in
Lithgow, NSW
Age (years)
Children (n)
Decayed (D) Missing (M) Filled (F) DMFT DMFT.0 (%)
Mean SD Mean SD Mean SD Mean SD
6 106 0.01 0.08 0.00 0.00 0.02 0.16 0.02 0.24 0.90
7 97 0.01 0.09 0.00 0.00 0.04 0.22 0.05 0.23 4.10
8 100 0.10 0.42 0.00 0.00 0.10 0.42 0.21 0.63 13.00
9 93 0.08 0.34 0.06 0.37 0.18 0.61 0.32 0.81 17.20
10 89 0.07 0.37 0.00 0.00 0.41 0.82 0.48 0.89 29.80
11 94 0.11 0.51 0.06 0.37 0.49 1.03 0.66 1.25 29.80
12 74 0.15 0.53 0.02 0.16 0.53 1.18 0.69 1.29 28.40
DMFT: Decayed, Missing due to caries, Filled Teeth index for permanent (adult) teeth. SD: Standard Deviation.
Pr
imar
y dmft
Age (years) 0
6 7 8 9 10 11 12
1 2 3 4 5 6 7
SiC SiC10 Mean
Figure 2. Significant caries indices and mean caries prevalence for permanent teeth of children aged 6–12 years in Lithgow, NSW, 2006.
DMFT: Decayed, Missing due to caries, Filled teeth index for permanent teeth. SiC: mean dmft score of the 30% of the
population with highest caries rate. SiC10: mean dmft score
collected by uncalibrated examiners. Our diagnostic cri-teria for caries are more specific than sensitive, and our technique was less invasive, as we did not use radiographs as a diagnostic tool.
The findings of our study on caries prevalence among school-aged children and on parental support on water fluoridation21 were presented to the local council in the hope that this information would encourage it to support the fluoridation proposal. Following this study, the local coun-cil commissioned an independent body (Western Research Institute, Bathurst) to conduct a survey on support for fluoridation in Lithgow. It is heartening to note that 72% of households voted in favour of fluoridation (Murphy T, written communication, August 2009), and the council at its ordinary meeting in November 2007 resolved that: ‘council proceed with water fluoridation and request the installation of the necessary infrastructure’.22Subsequently, Lithgow Council wrote to the Director-General of Health requesting fluoridation of the public water supplies under Section 6 of theFluoridation of Public Water Supplies Act 1957. By the end of 2010, the Lithgow community will have access to fluoridated water. Future investigations will be needed to assess the benefit of water fluoridation in Lithgow.
Conclusion
Although the mean levels of dental caries in schoolchildren in Lithgow were low, oral health inequalities exist between children residing in non-fluoridated Lithgow and the
fluoridated locations of Orange and Bathurst. The local council has decided that Lithgow will have fluoridated water.
Editor’s note
Lithgow was gazetted to be fluoridated on 31 August 2010 and this will be implemented during 2011.23
Acknowledgments
We are grateful for support given by Dr Athin Narayan Sujeer, Dr Shanti Sivaneswaran (Centre for Oral Health Strategy, NSW Health) and Ms Ramona Grimm, and for statistical advice given by Dr Karen Byth (Westmead Hospital) and Ms Anne Ellershaw (Australian Research Centre for Population Oral Health, University of Ade-laide). We are grateful to Elisabeth Heseltine for advice on the writing and editing of this paper. The schoolchildren, principals, teachers and parents are also gratefully acknowledged. This study was funded by the Centre for Oral Health Strategy, NSW Health.
References
1. Marthaler TM. Changes in dental caries 1953–2003.Caries Res
2004; 38: 173–81. doi:10.1159/000077752
2. Peterson PE. Continuous improvement of oral health in the 21st century – the approach of the WHO Global Oral Programme. The World Health Report. Geneva: World Health Organization; 2003.
3. Konig KG. Changes in the prevalence of dental caries: how much can be contributed to changes in diet? Discussion paper.
Caries Res1990; 24: 16–8. doi:10.1159/000261315
4. World Health Organization. WHO Expert Committee on Oral Health Status and Fluoride Use. Fluorides and Oral Health.
Table 3. Primary dentition caries experience among children aged 6 years in unfluoridated Lithgow and the socioeconomically comparable fluoridated towns of Bathurst and Orange, NSW
Town Children
(n)
Decayed (d) Missing (m) Filled (f) dmft dmft.0 (%)
Mean SD Mean SD Mean SD Mean SD
Lithgow 106 0.52 2.01 0.08 0.33 0.33 0.82 0.92 2.03 29.2
Orange 50 0.74 1.72 0.04 0.28 0.40 1.31 1.18 2.12 40.0
Bathurst 46 0.76 1.48 0.07 0.33 0.28 1.03 1.11 2.06 34.8
dmft: decayed, missing due to caries, filled teeth index for primary (baby) teeth. SD: Standard Deviation.
Source: School Dental Service, NSW Health.
Table 4. Permanent dentition caries experience among children aged 12 years in unfluoridated Lithgow and the socioeconomically comparable fluoridated towns of Bathurst and Orange, NSW
Town Children
(n)
Decayed (D) Missing (M) Filled (F) DMFT DMFT50 (%)
Mean SD Mean SD Mean SD Mean SD
Lithgow 74 0.15 0.53 0.02 0.16 0.53 1.18 0.69 1.29 71.6
Orange 46 0.04 0.29 0.00 0.00 0.28 0.98 0.33* 1.01 87.0*
Bathurst 28 0.18 0.77 0.00 0.00 0.11 0.32 0.29* 0.85 85.7*
DMFT: Decayed, Missing due to caries, Filled Teeth index for permanent (adult) teeth. SD: Standard Deviation.
*Significantly different from Lithgow,po0.05. Source: School Dental Service, NSW Health.
Dental caries in children
WHO Technical Report Series No. 846. Geneva: World Health Organization; 1994.
5. Jones S, Lennon M. Fluoridation. In: Pine CM, editor. Community Oral Health. Bath: Wright; 1997. pp. 221–47.
6. Sivaneswaran S, Chong GTF, Blinkhorn AS. Successful fluoridation plebiscite in the township of Deniliquin, New South
Wales, Australia.J Public Health Dent2010; 70: 163–6.
7. Australian Research Centre for Population Oral Health, Dental School, The University of Adelaide. The use of fluorides in
Australia: Guidelines.Aust Dent J2006; 51: 195–9. doi:10.1111/
j.1834-7819.2006.tb00427.x
8. Spencer AJ, Slade GD, Davies M. Water fluoridation in
Australia.Community Dent Health1996; 13(Suppl. 2): 27–37.
9. Sivaneswaran S. Water fluoridation successes in NSW 2003 to
2006.Newsletter Public Health Assoc Aust2006; 24: 7–10.
10. Sivaneswaran S. Investing upstream – water fluoridation
successes in New South Wales.Newsletter Public Health Assoc
Aust2009; 26: 6–7.
11. Evans RW, Hsiau ACY, Dennison PJ, Patterson A, Jalaludin B. Water fluoridation in the Blue Mountains reduces risk for tooth
decay.Aust Dent J2009; 54: 368–73.
doi:10.1111/j.1834-7819.2009.01164.x
12. Armfield J. Public water fluoridation and dental health in New
South Wales.Aust N Z J Public Health2005; 29: 477–83.
doi:10.1111/j.1467-842X.2005.tb00230.x
13. Phelan C, Byun R, Skinner JC, Blinkhorn AS. Child Dental Health Survey 2007: a snapshot of the oral health status of
primary school-aged children in NSW.N S W Public Health Bull
2009; 20: 40–5. doi:10.1071/NB08069
14. World Health Organization. Oral Health Surveys: Basic Methods. 4th ed. Geneva: World Health Organization; 1997.
15. Cohen J. A coefficient of agreement for nominal scales.
Educational and psychological measurement.Educ Psychol
Meas1991; 51: 95–101.
16. Klein H, Palmer CE, Knutson JW. Studies on dental caries: dental status and dental needs of elementary school children.
Public Health Rep1938; 53: 751–65. doi:10.2307/4582532
17. Bratthall D. Introducing the Significant Caries Index together with a proposal for a new global oral health goal for
12-year-olds.Int Dent J2000; 50: 378–84.
18. Nishi M, Stjernsward J, Carlsson P, Bratthall D. Caries experience of some countries and areas expressed by the
Sig-nificant Caries Index.Community Dent Oral Epidemiol2002;
30: 296–301. doi:10.1034/j.1600-0528.2002.00054.x
19. Australian Bureau of Statistics. Population by age and sex, Australia, 2006. Canberra: Australian Bureau of Statistics; 2007. Available at: www.abs.gov.au/ausstats (Cited 15 July 2009).
20. Brennan DS, Spencer AJ, Roberts-Thomson KF. Periodontal disease among 45–54 year olds in Adelaide, South Australia.
Aust Dent J2007; 52: 55–60. doi:10.1111/j.1834-7819.2007. tb00466.x
21. Arora A, Evans RW, Sivaneswaran S, Sujeer AN, Blinkhorn AS. Parental support for water fluoridation in Lithgow, New South
Wales.Aust Dent J2010; 55: 417–22.
doi:10.1111/j.1834-7819.2010.01263.x
22. Lithgow City Council. Minutes Ordinary Meeting of Council. Lithgow: Lithgow City Council, 2007. Available at: http://www. council.lithgow.com/minutes/minutes_071119.pdf (Cited 25 March 2009.)
23. Fluoridation of Public Water Supplies Act 1957.NSW
Reduction in staff smoking rates in North Coast
Area Health Service, NSW, following the
introduction of a smoke-free workplace policy
Gavin S. Dart
A, Eric K. van Beurden
A,B,
Avigdor Zask
A, Chalta Lord
A, Annie M. Kia
Aand Ros Tokley
AA
Health Promotion, Population Health, Planning and Performance, North Coast Area Health Service
B
Corresponding author. Email: [email protected]. nsw.gov.au
Abstract: Aim: To evaluate changes in staff
smoking rates following the implementation of Smoke Free Health Care, an innovative, change-management process that introduced a smoke-free workplace policy in the North Coast Area Health Service of NSW.Methods:Survey questionnaires were sent to all staff before and after the introduc-tion of the policy. Return rates were 17.3% (690/ 3988) in 1999 and 25.4% (2012/7921) in 2007. Chi-square tests and multivariate logistic regression analysis were used to determine differences.
Results:Staff smoking rates decreased significantly
from 22.3% to 11.8% (po0.0001). Smoking rates in 1999 were not significantly different to the state population’s (22.3% and 24.1%,p¼0.3), but were significantly different in 2007 (11.8% and 20.1%, po0.0001). Over a quarter (27.6%) of staff who smoked when implementation began quit smoking; more than twice the rate before implementation (12%, po0.0001).Conclusion:These changes in staff smoking rates indicate the effectiveness of a comprehensive change-management approach to implementing smoke-free workplace policy.
Smoking harms nearly every organ of the body, causing many diseases and reducing the general health of smo-kers.1 Exposure to secondhand smoke can also cause premature death and disease in adults and children who do not smoke.2Smoke-free workplace policies targeting smoking cessation have been introduced in a number of
settings.3 Some have led to moderate decreases in staff smoking rates and cigarette consumption by employees who continue to smoke.4A systematic review of 26 studies of smoke-free workplaces showed that totally smoke-free workplace policies had approximately twice the effect on reducing staff smoking rates (3.8% reduction) as work-place policies that allowed smoking in some areas other than work areas.4The World Health Organization recom-mends that all health care facilities be smoke-free and not permit smoking on the premises either indoors or outdoors.5
In 1999 NSW Health directed all health services across the state to become totally smoke-free through the intro-duction of the NSW Smoke Free Workplace Policy.6 In response, the North Coast Area Health Service (NCAHS) developed a unique change-management process called Smoke Free Health Care and implemented it in all sites.
To our knowledge nothing has been published describing changes in staff smoking rates following the introduction of a smoke-free workplace policy across multiple sites in an Australian regional health service.
This paper presents an evaluation of changes in staff smoking and smoking cessation rates before and after implementation ofSmoke Free Health Care.
Methods
Study population
NCAHS is a regional area health service in New South Wales (NSW), Australia. It employs approximately 8000 staff and services a population of more than 500 000 people. The study involved cross-sectional health service staff smoking surveys conducted in 1999 and 2007. NCAHS consisted of two separate area health services in 1999: Northern Rivers and Mid North Coast (amalga-mated in 2005). The pre-survey was conducted in the Northern Rivers Area Health Service only (3988 staff). The post-survey covered the whole of NCAHS (7921 staff) but included a question to identify those working in previous Northern Rivers Area Health Service sites. Data from statewide adult health surveys in 1998 and 2005 were used for comparison with health service staff smoking rates.7,8
Intervention
NCAHS implemented a systematic and innovative orga-nisational change-management process termed Smoke Free Health Care between 2002 and 2007 that intro-duced a policy banning smoking in indoor and outdoor areas of NCAHS sites.6 Smoke Free Health Care was multi-strategic; along with policy directives, it incorpo-rated mandatory workforce education, humour and improved clinical intervention for nicotine dependent inpatients with smoking cessation and harm minimisation support for staff who smoked.9 All Smoke Free Health Carestrategies were strongly supported at the executive level.9Smoke Free Health Carewas implemented within the context of other population-wide environmental and behavioural initiatives aimed at reducing smoking rates.
Survey design
Two cross-sectional surveys of area health service staff, one administered in 1999 and the other in 2007, were used to collect smoking data. The first survey was conducted in 1999 before the implementation ofSmoke Free Health Care. It established a baseline staff smoking rate and measured interest in smoking cessation. The follow-up survey was conducted in 2007 after the implementation of Smoke Free Health Care. This survey assessed pre and post Smoke Free Health Care staff smoking rates, smoking cessation rates and the perceived success or otherwise ofSmoke Free Health Care(SFHC). Survey instruments were developed by a reference group with expertise in tobacco control and public health evaluation (Box 1). Ethics approvals for the 1999 and 2007 surveys were granted by the Human Research and Ethics Committees of the Northern Rivers Area Health Service and NCAHS respectively.
Data collection and management
The surveys were in Teleform format (a layout that allows handwritten and tick box responses to be detected by an electronic scanner and exported to a computer database) and distributed to all staff with their payslips.10 Return rates were 17.3% (690/3988) in 1999 and 25.4% (2012/ 7921) in 2007. Returned surveys were manually checked and scanned. Data were imported into a database, coded and imported into SAS (version 8.02, SAS Institute, Cary, NC, USA) for final cleaning and analysis.
Data analysis
SAS was used to derive frequencies and means. Confi-dence intervals for proportions were calculated using the method of Fleiss.11Chi-square tests were used for bivari-ate analyses. Multivaribivari-ate logistic regression included pre, post, age and gender as predictors of smoking cessation rates to determine age-adjusted pre to post changes.11 Estimates of sampling bias were determined by compar-ing age by gender and smokcompar-ing status of the survey sample with relevant workforce and NSW Health survey data.7,8,12
Area health service smoking and cessation rates were compared with NSW population rates obtained from NSW Health Survey data.7,8There were no published data for the years our surveys were administered. Therefore, 1999 survey data were compared with 1998 state popula-tion data and the 2007 survey data were compared with the 2005 state population data.
NCAHS sites were progressed to smoke-free status sequentially between 2003 and 2007. Analyses to compare pre and post smoking cessation rates were therefore site-specific and involved all sites surveyed at baseline. The date respondents indicated they had quit smoking was linked to the date their site went smoke-free, which occurred after an intensive ‘Smoke-Free Transition’ inter-vention. The proportion of staff that quit smoking after their site went smoke-free was compared to the proportion of staff that quit smoking, in an equal time period, before the site went smoke-free. For example, where a site went smoke-free in September 2006, the number of staff who reported quitting smoking between September 2006 and the 2007 follow-up survey was compared to the number of staff who reported quitting smoking within the same number of months before September 2006.
Results
The follow-up sample was older than the baseline sample with 67.1% of respondents aged over 40 years in 1999 and 77.5% in 2007 (x2¼100.85, df¼1,po0.0001). Both surveys had a ratio of approximately 3:1 females to males (x2¼0.42, df¼1,p¼0.5162). This is consistent with the general health workforce.4
Box 1. Information collected from the 1999 and 2007Smoke Free Health Caresurveys
• Demographics: gender, age, workplace, employment history (1999, 2007)
• Smoking status: daily, occasional, quit, never (1999, 2007)
• Interest in smoking cessation and readiness to use nicotine replacement therapy (1999)
• If ceased, when: month and year (2007)
• Reasons for cessation: medical advice, influence of colleagues, health, television, billboards and graphic packet warnings, cost
of cigarettes, influence of friends and/or family, my worksite going totally smoke-free, and other (2007)
NCAHS staff smoking rate compared to NSW population Comparisons were made between smoking rates in NCAHS staff samples and the NSW population.7,8 In 1999, smoking rates in the staff sample and the NSW population were not statistically different (22.3% com-pared to 24.8%;x2¼1.01, df¼1, p¼0.3156). In 2007, smoking rates in the staff sample were significantly lower than the NSW population (11.8% compared to 22.2%; x2¼69.80, df¼1,po0.0001) (Figure 1).
Smoking status: pre and post SFHC implementation There were significant decreases in the current staff smoking rate for females from 20.3% to 11.1% and for males from 24.6% to 13.6%. Staff smoking cessation rates increased substantially between the pre and post surveys. For females, the rate increased from 21.3% to 34.1% and for males from 24.6% to 32.7%. This contrasted with reduced smoking cessation in the NSW population (females: 21.2% to 20.1%; males: 28.4% to 25.5%).
The regression model revealed that pre to post SFHC changes in smoking cessation rates were highly significant even after taking into account the effects of age and gender (bpre-post¼ 0.9412, se¼0.1465, po0.0001). Smoking cessation rates increased with age (bage¼ 4742, se¼0.0744, po0.0001) but were unaffected by gender (bgender¼ 0.0915, se¼0.1613,po0.5703). Para-meter estimates were used to generate predicted adjusted smoking cessation rates and changes in cessation rates for selected age by gender cohorts. Age cohorts with sufficient numbers at either end of the scale were chosen to represent these changes. Predicted changes in ex-smokers ranged from 16% (66% to 82%) in more senior female staff to 20% (27% to 47%) for younger males (Figure 2).
Over a quarter (27.6%) of staff who smoked when their site went smoke-free subsequently quit smoking (Figure 3). This reduction is significant and more than double that for
the same time period before SFHC (12.0%, x2¼27.35, df¼1,po0.0001). For those who quit smoking and gave a reason (n¼192), the four main reasons were: health (32.8%); family/friends (19.8%); cost (17.7%); and worksite going smoke-free (10.4%).
Perceived success of SFHC
Approximately half (51.2%) of the 2007 sample consid-ered SFHC to have ‘worked fairly or very well’, while the remainder considered it to have ‘worked OK but still with difficulties’ or to have ‘not worked at all well’. Respon-dents who were still smoking were less positive with only 38.2% responding ‘fairly or very well’.
Discussion
A 10% reduction in staff smoking rates occurred after the implementation of SFHC. This is considerably larger than the mean of 3.8% reported by Fichtenberg and Glantz in their systematic review.4 The apparent success was achieved in spite of initial resistance from staff at many
1999 2007 1998 2005
0 10 20 30 40 50 60 70
⫺
NSW NCAHS
Percent
Never Quit Current
Figure 1. Rates and confidence intervals of ‘never smoked’, ‘quit smoking’ and ‘current smoker’ in North Coast Area Health Service staff compared to NSW population.
27 29
63 66
47 50
80 82
0 100
Male 20–29 Female 20–29 Male 50–59 Female 50–59
Percent
1999 2007
Figure 2. Staff smoking cessation rates in North Coast Area Health Service pre and post implementation ofSmoke Free Health Care, by age and gender.
12
Percent
0 100
28
Pre-SFHC implementation Post-SFHC implementation
Still smoking Ceased smoking
Figure 3. North Coast Area Health Service staff smoking profile pre and post implementation ofSmoke Free Health Care (of respondents who were smoking whenSmoke Free Health Carecommenced at their site).
Reduction in staff smoking rates
sites. While some respondents expressed dissatisfaction with certain aspects of SFHC, most considered it had been successfully implemented.
A potential limitation of this study is the cross-sectional survey design and low response rates. These limit gener-alisability and the extent to which we can attribute the observed decrease in smoking to the intervention alone. However, this design was deemed most feasible in a sequential, service-wide initiative within the broader con-text of statewide policy implementation. Comparison with statewide population smoking rates strengthened the design. As an additional measure of intervention efficacy, the inclusion of smoking cessation rates, in comparative time periods before and after SFHC implementation, provided another source of triangulation.
Self-selection may have introduced some bias in relation to the main outcomes. However, comparisons between the survey sample and workforce demographics, and also NSW Health surveys, suggest this bias was minimal.
The possible influence of the ageing of the workforce was precluded by the adjustment for age and gender effects in the multivariate analysis. This indicated that initial esti-mates, using age-adjusted survey data, resulted in under-estimation of the full impact on staff smoking rates. The fact that approximately half of the 2007 survey respon-dents considered SFHC had worked ‘fairly’ or ‘very well’ and the other half considered that it had worked ‘not at all well’ or ‘OK but with some difficulties’ further suggests that if there was self-selection bias in either direction on this scale, it was not excessive.
The degree of change in staff smoking rates evident over the period of SFHC implementation provides support for smoke-free workplace policies that remove all designated smoking areas, include a staff education component and support staff smoking cessation through a comprehensive organisational change-management process. SFHC imple-menters recommend that wherever smoke-free policy exemptions exist, staff health and safety risk assessments should be undertaken because the evidence suggests that maintaining designated smoking areas is likely to contri-bute to continued smoking by staff. This was acknowl-edged in an internal Phillip Morris memo in 1992 which referred to a body of company research that reported: ‘Total prohibition of smoking in the workplace strongly affects industry volumey. Milder workplace restrictions, such as smoking only in designated areas, have much less impact on quitting rates.’13
Conclusion
Decreases in staff smoking rates and increases in smoking cessation rates evident from the pre and post SFHC
implementation surveys were large and significant when compared to secular trends. This intervention appears to have been more effective than other interventions reported in the literature. The results support existing evidence for the effectiveness of smoke-free workplace interventions that simultaneously implement environmental and beha-vioural strategies.
Acknowledgments
We would like to thank Mark Mitchell, Christine Sullivan and Uta Dietrich for questionnaire design comments, Gail Bennett for Teleform development, Kate Jackson for data collection and Ian Smith for workforce data support.
References
1. CDC Office on Smoking & Health. National Center for Chronic Disease Prevention & Health Promotion – CDC. The health consequences of smoking. A report of the Surgeon General. Atlanta: CDC’s Office on Smoking & Health; 2004.
2. U.S. Department of Health & Human Services. The health consequences of involuntary exposure to tobacco smoke: A report of the Surgeon General. U.S. Department of Health & Human Services, Centers for Disease Control and Prevention, Coordinating Center for Health Promotion, Office of Smoking and Health; 2006.
3. Moher M, Hey K, Lancaster T. Workplace interventions for
smoking cessationCochrane Database Syst Rev2005; (Issue 2):
CD003440.
4. Fichtenberg CM, Glantz SA. Effect of smoke-free workplaces on
smoking behaviour: systematic review.BMJ2002; 325: 188–94.
doi:10.1136/bmj.325.7357.188
5. Raw M, Anderson P, Batra A, Dubois G, Harrington P, Hirsch A et al. WHO Europe evidence based recommendations on the
treatment of tobacco dependence.Tob Control2002; 11(1): 44–6.
doi:10.1136/tc.11.1.44
6. Health NSW. Smoke Free Workplace Policy. Sydney: NSW Department of Health; 1999.
7. Public Health Division, NSW Department of Health. Report on the 1997 and 1998 NSW Health Surveys. Available from: www. health.nsw.gov.au/PublicHealth/surveys/hsa/9798/hsindex.htm (Cited November 2007.)
8. Centre for Epidemiology and Research. 2005 Report on Adult Health from the New South Wales Population Health Survey. Sydney: NSW Department of Health; 2006.
9. Kia AM, van Beurden EK, Dart GS, Barrack CM, Mitchell MD. Smoke Free Health Care: an organisational change to increase
effective intervention for tobacco.N S W Public Health Bull
2008; 19(3–4): 60–4. doi:10.1071/NB07115
10. Autonomy. Autonomy TeleForm: Product Brief. 2009.
11. Fleiss JL. Statistical Methods for Rates and Proportions. 2nd ed. New York: John Wiley and Sons; 1981.
12. North Coast Area Health Service. Business objects database (Sep07) 2007.
Gastroenteritis outbreaks in institutions
Roy Byun
A, Vicky Sheppeard
Band Rowena Bull
CA
NSW Public Health Officer Training Program, NSW Department of Health
B
Centre for Population Health, Sydney West Area Health Service C
School of Biotechnology and Biomolecular Sciences, The University of New South Wales
Outbreaks of gastroenteritis, characterised by diarrhoea, vomiting and/or abdominal cramps in two or more people, often occur in semi-closed settings such as hospitals and aged-care facilities. Several characteristics common to institutional settings facilitate outbreaks of gastroenter-itis: close human contact and communal living; shared bathroom facilities; movement of ill staff and patients between wards/facilities; a higher proportion of suscepti-ble people (because of their age or underlying illness); centralised food preparation/handling; and often impaired continence of inhabitants.
Epidemiology
In New South Wales (NSW) outbreaks of gastroenteritis in residential or educational institutions, child-care or health-care facilities are notifiable under the NSWPublic Health Act 1991. In 2008 there were 575 outbreaks and almost 9600 people affected by gastroenteritis in institutions in NSW.1The number of outbreaks varies each year, largely influenced by the epidemiology of noroviruses which are known or suspected to cause the vast majority of these outbreaks.2 Consequently, the seasonal pattern of out-breaks follows that of norovirus, with the incidence of outbreaks increasing in autumn, peaking in winter and declining over spring and summer.
Causative agents
Several bacterial, viral and parasitic agents are responsible for gastroenteritis outbreaks in institutions. Foodborne outbreaks of gastroenteritis are less frequent and may reflect mandatory safe food handling and hygiene prac-tices. However, outbreaks do occur, and the most common foodborne pathogens in Australia includeSalmonellaspp., norovirus andClostridium perfringens.2,3
The majority of institutional outbreaks of gastroenteritis are spread through person-to-person contact and are caused by viruses including norovirus, rotavirus and adenoviruses. Recently, transmission of the bacterium
Clostridium difficile has been responsible for a large number of outbreaks in institutions worldwide, associated with person-to-person spread of a new epidemic strain in the Northern hemisphere.4
Norovirus
Human noroviruses are small round viruses that belong to the Caliciviridae family of viruses. They are a major cause of large gastroenteritis outbreaks in settings where there is close human contact.
Noroviruses can infect people of all ages and cause symptoms including severe vomiting, diarrhoea, abdom-inal cramps and general malaise. Symptoms usually develop 24–48 hours after being exposed to the virus. The illness is self-limiting, resolving in 12–72 hours. Currently, there is no specific treatment for norovirus gastroenteritis and there is no vaccine to prevent infection.
Several characteristics of norovirus are believed to con-tribute to its outbreak potential: they are highly contagious (as few as 10 virus particles can cause infection); transmis-sion can occur through the ingestion of contaminated food and water, by person-to-person spread, and also by air-borne spread of aerosolised vomitus; the virus is shed for prolonged periods even after symptoms have ceased; asymptomatic carriers could propagate an outbreak; the virus is very resistant to environmental conditions; and the viral genome is continually evolving.5
Clostridium perfringens
Clostridium perfringens is a spore-forming anaerobic bacterium that is ubiquitous in soil and in the intestines of humans and many animals. C. perfringens strains expressing the enterotoxin (CPE) type A are a common cause of foodborne outbreaks of gastroenteritis.6Spores of C. perfringens are capable of withstanding cooking temperatures and if the food is allowed to cool slowly the spores germinate. Foodborne outbreaks of CPE gastro-enteritis can occur when large quantities of food, especially meat-based dishes, are prepared in advance and kept warm for several hours before serving.7
After the consumption of contaminated food enterotoxin is released in the small intestine. Symptoms usually begin 6–24 hours after ingestion and may include intense abdom-inal cramps and watery diarrhoea. The illness is short lived and is completely resolved within 24 hours in most people, although it can be prolonged in the elderly. There is no specific treatment for CPE gastroenteritis and the best
10.1071/NB09038 Vol. 21(11–12) 2010 NSW Public Health Bulletin | 267
method of avoiding outbreaks of CPE gastroenteritis is safe food handling.
Public health control measures
The immediate control of outbreaks of gastroenteritis in an institution is important to prevent the spread of infection to other residents, staff and visitors. In 2005, a toolkit titled ‘Gastro Pack’ was developed that provides information on the early recognition of an outbreak, implementation of control measures, management of affected people and communication strategies.8 The Department of Health and Ageing have released a similar resource titled ‘Gastro Info Kit’, designed specifically for outbreaks in aged-care facilities.9Use of these guidelines should aid in the con-tainment of gastroenteritis outbreaks in institutions.
References
1. NSW Department of Health, Communicable Diseases Branch. Gastroenteritis Outbreaks in Institutions Database. (Cited 5 November 2009.)
2. Cretikos M, Telfer B, McAnulty J. Enteric disease outbreak
reporting, New South Wales, Australia, 2000 to 2005.N S W
Public Health Bull2008; 19(1–2): 3–7. doi:10.1071/NB07078
3. The OzFoodNet Working Group. Monitoring the incidence and causes of diseases potentially transmitted by food in Australia:
annual report of the OzFoodNet Network, 2007.Commun Dis
Intell2008; 32(4): 400–24.
4. Riley TV.Clostridium difficile: a pathogen of the nineties.
Eur J Clin Microbiol Infect Dis1998; 17(3): 137–41.
5. Estes MK, Verkataram Prasad BV, Atmara RL. Noroviruses
everywhere: has something changed?Curr Opin Infect Dis2006;
19: 467–74. doi:10.1097/01.qco.0000244053.69253.3d
6. Smedley JG, 3rd, Fisher DJ, Sayeed S, Chakrabarti G, McClane
BA. The enteric toxins ofClostridium perfringens.Rev Physiol
Biochem Pharmacol2004; 152: 183–204. doi:10.1007/s10254-004-0036-2
7. Young MK, Smith P, Holloway J, Davison RP. An outbreak of
Clostridium perfringensand the enforcement of food safety
standards.Commun Dis Intell2008; 32: 462–5.
8. NSW Department of Health. Gastro Pack. Available from: http://www.health.nsw.gov.au/resources/publichealth/ infectious/diseases/gastro_pack_pdf.asp (Cited 6 September 2009.)
9. Department of Health and Ageing. Gastro-Info – Outbreak Coordinator’s Handbook. Available from: http://www.health. gov.au/internet/main/publishing.nsf/Content/ageing-publicat-gastro-kit-handbook.htm (Cited 6 September 2009.)
Genital
Chlamydia trachomatis
infection
Evan Freeman
A, Basil Donovan
B,Cand Katherine Brown
D,EANSW Public Health Officer Training Program, NSW Department of Health
B
National Centre in HIV Epidemiology and
Clinical Research, The University of New South Wales C
The Sydney Sexual Health Centre, Sydney Hospital D
South Eastern Sydney Illawarra Area Health Service E
The University of Wollongong
Chlamydia trachomatisis one of three species of Chlamy-diaethat commonly cause disease in humans. It is respon-sible for ano-genital and conjunctival (conjunctivitis and trachoma) infections. Infant conjunctivitis and pneumonia can result from maternal genital infection.1C. trachomatis serovars D–K are responsible for most sexually-acquired genital infections. Serovar L2causes a severe proctolitis or genital ulcer lymphadenopathy syndrome known as lymphogranuloma venereum which is beginning to re-appear in Australia among men who have sex with men.2
Chlamydia is a notifiable condition in New South Wales (NSW) under the Public Health Act 1991. There were 14 947 laboratory-confirmed cases notified in 2009. Known as the ‘silent disease’, it is the most reported sexually transmissible infection (STI) in Australia, the United States, the United Kingdom and Canada. Due to the mainly asymptomatic nature of chlamydia, chronic infection and re-infection are common,3highlighting the importance of screening.4People aged less than 25 years have the highest rates of infection.
Symptoms
ectopic pregnancy and infertility.3 Either gender can develop reactive arthritis, associated with mucocutaneous lesions.
Testing
Ano-genital tract infection can be detected using self-collected vaginal or anal swabs or a urine specimen. Self-collected specimens have lowered the barriers to testing. A clinician may collect a cervical swab if a woman has symptoms or as part of a pap test. A variety of nucleic acid amplification tests are also used, with sensitivities in the range of 85–97% and specificities exceeding 99%.
Treatment
Uncomplicated ano-genital infection is treated with a single oral dose of azithromycin.1 Complicated infec-tions (pelvic inflammatory disease and epididymitis) and lymphogranuloma venereum require treatment with doxy-cycline for a minimum of 14 days; other antibiotics are also often required.5
Re-infection and contact tracing
While cure rates are high (495%), re-infection rates are also high (approximately 30%). Therefore, people treated for chlamydia should be retested after 12 weeks of treat-ment. As infected sexual partners are typically asympto-matic, they often do not present for contact testing and treatment. The value and legality of dispensing a second dose of azithromycin for the patient to deliver to their partner(s) (patient-delivered partner therapy) has been recommended for review in Australia.6
The Australian Collaboration for Chlamydia Enhanced Sentinel Surveillance (ACCESS) Project
The Commonwealth-funded ACCESS Project has been established in response to increasing numbers of chlamy-dia notifications, with the possibility that much of the increase could be due to increased testing.7Priority popu-lations requiring ongoing surveillance include Aboriginal and Torres Strait Islanders, young heterosexuals, men who have sex with men, and sex workers. An early impression determined through this pilot sentinel surveillance is that rates of chlamydia may not be rising as quickly as the notification data suggest.
Fast-track treatment: using patient-delivered partner therapy to reduce chlamydia prevalence
Patient-delivered partner therapy has been considered because of the increasing number of diagnoses and the concern that current clinical treatment systems are not slowing the spread of disease. This process includes the patient providing advice to their partner about the nature of chlamydial infection, testing and treatment.
It is believed to work best when clients are selected; avoiding high-risk populations where other STIs and bloodborne viruses may be of concern (e.g. injecting drug users and men who have sex with men). The Centers for Disease Control and Prevention in the United States has included this option within its current guidelines for STI management.
References
1. Heymann DL, editor. Control of Communicable Diseases Manual. 19th ed. Washington: American Public Health Association; 2008.
2. Stark D, van Hal S, Hillman R, Harkness J, Marriott D. Lymphogranuloma venereum in Australia: anorectal Chlamydia
trachomatis serovar L2b in men who have sex with men.J Clin
Microbiol2007; 45(3): 1029–31. doi:10.1128/JCM.02389-06
3. Cretikos M, Davies S, Brotherton A. Chlamydia, gonorrhoea and
syphilis.N S W Public Health Bull2006; 17(5–6): 86–7.
4. Geisler WM, Wang C, Morrison SG, Black CM, Bandea CI, Hook EW, 3rd. The natural history of untreated Chlamydia trachomatis infection in the interval between screening and
returning for treatment.Sex Transm Dis2008; 35(2): 119–23.
doi:10.1097/OLQ.0b013e318151497d
5. Centers for Disease Control and Prevention. Updated recom-mended treatment regimens for gonococcal infections and associated conditions – United States, April 2007. Available from: http://www.cdc.gov/std/treatment/2006/updated-regimens.htm (Cited 1 February 2010.)
6. McNulty A, Teh MF, Freedman E. Patient delivered partner therapy for chlamydial infection—what would be missed?
Sex Transm Dis2008; 35(9): 834–6. doi:10.1097/ OLQ.0b013e3181761993
7. Chen MY, Fairley CK, Donovan B. Nowhere near the point of diminishing returns: correlations between chlamydia testing and
notification rates in New South Wales.Aust N Z J Public Health
2005; 29(3): 249–53. doi:10.1111/j.1467-842X.2005.tb00763.x
GenitalChlamydia trachomatisinfection
Ross River virus disease in inland NSW: higher
than average notifications in 2007
–
08
Julie A. Tall
A,C, Anthony M. Brown
B,
Therese C. Jones
Aand Catherine A. McKenna
A APopulation Health Division, Greater Western Area Health Service B
School of Rural Health, The University of Sydney C
Corresponding author. Email: [email protected]
Abstract: This study showed that Ross River
virus notifications in the Greater Western Area Health Service of NSW were higher in 2007–08 than any other financial year for the 1997–2009 period. The study also examined the epidemiology of those notifications. Notification and population data were retrieved from the NSW Health Notifiable Diseases Database and HOIST Popula-tions Library respectively. Age-standardised noti-fication rates were highest in Bogan, Bourke, Brewarrina, Gilgandra, Narromine, Walgett and Warren. Notifications peaked for the 35–39-year age group and were evenly distributed between the sexes. Notifications peaked in February. Aborigi-nal status was under-reported.
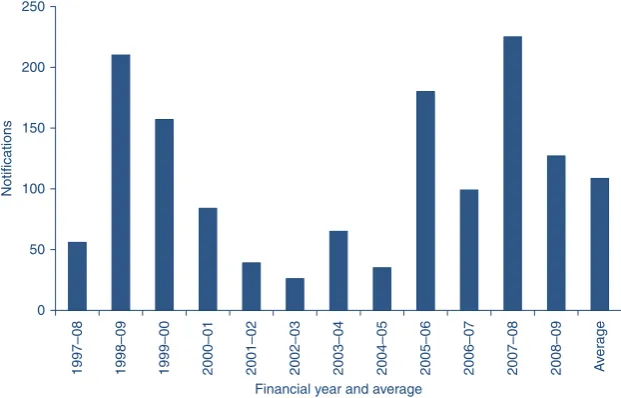
Ross River virus (RRV) is endemic in Australia,1 with epidemics occurring more commonly in rural than urban locations.2,3 Inland New South Wales (NSW) reports some of the highest notification rates in the state.4In the 12 months from 1 July 2007 to 30 June 2008, the Greater Western Area Health Service (GWAHS) experienced its highest number of RRV notifications for the 12-year period between 1 July 1997 and 30 June 2009. Most notifications were received from north-west and central-west local government areas.
Methods
Notification data and variables of sex, age, aboriginality and date of disease onset were retrieved from the NSW Health Notifiable Diseases Database (NDD) for the 12 years between 1997 and 2009. Population data were retrieved for the same period. This information was obtained from a population health database held by the NSW Department of Health (Health Outcomes Informa-tion and Statistical Toolkit). NotificaInforma-tions were examined for financial years rather than calendar years, since RRV activity peaks during summer months.2 Notification and population data were used to calculate age-standardised notification rates (ASNRs).
1997–08 1998–09 1999–00 2000–01 2001–02 2002–03 2003–04 2004–05 2005–06 2006–07 2007–08 2008–09 Av
er
age
0 50 100 150 200 250
Financial year and average
Notifications
Figure 1. Number of Ross River virus notifications in the Greater Western Area Health Service, 1 July 1997–30 June 2009, and the average number of notifications for this period.
Source: Notifiable Diseases Database accessed through Health Outcomes and Information Statistical Toolkit, NSW Department of Health.
10.1071/NB09015 Vol. 21(11–12) 2010 NSW Public Health Bulletin | 271
Results
The average number of RRV notifications for 1997–2009 was 109 (Figure 1), while in 2007–08, 225 notifications were recorded – more than double the average.
Notifications were not evenly distributed across all local government areas for 2007–08 (Table 1).
Bourke had the highest ASNR followed by Bogan and Gilgandra. Walgett, Warren, Narromine and Brewarrina all had ASNRs over 200. Nearly 40% of all notifications occurred in these seven local government areas. Lachlan and Warrumbungle Shire each had an ASNR of 188 with 13 and 19 cases respectively. Dubbo had the highest number of notifications (52) but also the largest popula-tion, resulting in an ASNR of only the tenth highest.
In 2007–08, the majority of notifications (62%) occurred in January, February and March (Figure 2). Cases peaked in February 2008 with 26.7% of the total notifications for the 12-month period. A second peak occurred from September to November 2007 with 48 cases for this period (21% of the total for the year). The winter months (June, July and August) had the lowest number, with 15 notifications or 6.8% of the total.
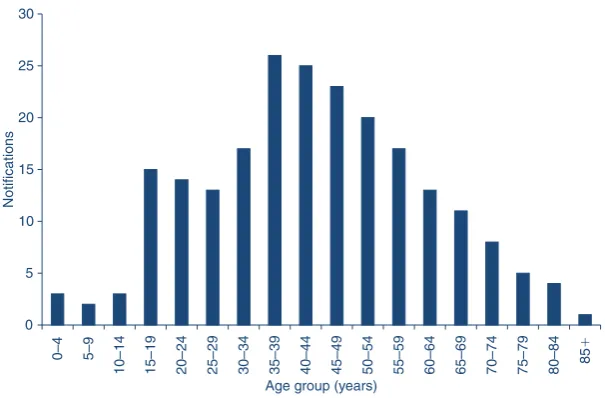
Most notifications (88%) were in people aged 15–69 years (Figure 3). More than half (58%) were aged 30–59 years, with the highest number of cases (26) in the 35–39-year age group. A high number of notifications (15) also fell in the 15–19-year age group. Notifications in young children and teenagers up to 14 years of age and people aged 75 years and over were low – less than 2.5% for each of the six age groups. Infants and children tend to be asymp-tomatic and therefore are generally under-diagnosed for RRV infection.2,3,5The elderly, however, may retain immunity from previous infection, and are unlikely to be reinfected.1,5
Table 1. Age-standardised notification rate and number of Ross River virus notifications in all local government areas of the Greater Western Area Health Service, 2007–08
Local government area
Age-standardised notification rate
Notifications
Balranald 0.0 0
Bathurst Regional 2.6 1
Blayney 0.0 0
Bogan 410.5 12
Bourke 565.5 18
Brewarrina 201.0 4
Broken Hill 35.6 7
Cabonne 0.0 0
Central Darling 101.7 2
Cobar 98.9 5
Coonamble 46.9 2
Cowra 0.0 0
Dubbo 129.3 52
Forbes 83.1 8
Gilgandra 344.2 16
Lachlan 188.8 13
Mid-Western Regional 31.7 7
Narromine 206.5 14
Oberon 0.0 0
Orange 13.3 5
Parkes 47.1 7
Unincorporated Far West
0.0 0
Walgett 237.5 17
Warren 215.4 6
Warrumbungle Shire 188.5 19
Weddin 26.7 1
Wellington 11.6 1
Wentworth 42.4 3
Source: Notifiable Diseases Database accessed through Health Out-comes and Information Statistical Toolkit, NSW Department of Health.
0 10 20 30 40 50 60 70
Jul Aug Sep Oct Nov Dec
Month
Jan Feb Mar Apr May Jun
Notifications
Figure 2. Monthly distribution of Ross River virus notifications in the Greater Western Area Health Service, 1 July 2007–30 June 2008.
Male notifications were 51.1% of the total; males are 50.3% of the population in GWAHS. This was generally consistent with the sex distribution of cases reported elsewhere.3,5,6
Aboriginal status was ‘not stated’ for more than 65% of cases, and for the entire area, only two out of 220 cases were reported as being Aboriginal people. In NSW, Abori-ginal status is not a required field for laboratory requests, nor is it mandatory to identify Aboriginal status for the NDD (Population Health Unit, GWAHS, pers. comm., 7 September 2009).
Limitations of notification data
While the detection of Ross River-specific IgM is suffi-cient for a confirmed case to be recorded on the NDD, the Public Health Laboratory Network regards the detection of Ross River-specific IgM as suggestive evidence only since IgM for the alphaviruses, such as RRV, may persist for months to years.7Furthermore, although the Department of Medical Entomology advises that blood tests be performed at both acute and convalescent phases,2NDD data indicate that many cases are laboratory-tested only once. Thus the detection of single-point Ross River-specific IgM could simply indicate prior infection and therefore not all RRV notifications may have been recent cases of the disease. The high notifications may reflect a true increase in RRV infection or simply an increase in testing. The possible reasons behind the higher than average RRV notifications for GWAHS in 2007–08 are worthy of investigation.
Acknowledgments
Graeme Robson, Population Health, GWAHS, for his assistance in sourcing NDD data; and the Health Outcomes and Information
Statistical Toolkit, Centre for Epidemiology and Research, NSW Department of Health.
References
1. Communicable Diseases Network Australia. Department of Health and Ageing. Ross River Virus Infection. Available from: http://www.health.gov.au/internet/main/publishing.nsf/ Content/health-arbovirus-pdf (Cited 2 February 2009.)
2. Department of Medical Entomology, University of Sydney and Westmead Hospital. Ross River and Barmah Forest Virus. Available from: http://medent.usyd.edu.au/fact/
ross%20river%20&%20barmah%20forest.htm (Cited 9 October 2008.)
3. Russell RC. Ross River virus: ecology and distribution.Annu
Rev Entomol2002; 47: 1–31. doi:10.1146/annurev.ento.47. 091201.145100
4. Doggett S. Population health aspects of mosquito-borne disease
in New South Wales.N S W Public Health Bull2004; 15(11–12):
193–9. doi:10.1071/NB04042
5. Horwood CM, Bi P. The incidence of Ross River virus disease in
South Australia, 1992 to 2003.Commun Dis Intell2005; 29(3):
291–6.
6. Harley D, Sleigh A, Ritchie S. Ross River virus transmission,
infection, and disease: a cross-disciplinary review.Clin
Microbiol Rev2001; 14(4): 909–32. doi:10.1128/CMR.14.4. 909-932.2001
7. Public Health Laboratory Network. 2001. Laboratory case definitions: Alphavirus and flavivirus laboratory case definitions. Department of Health and Ageing, Australian Government. Available from: http://www.health.gov.au/ internet/main/publishing.nsf/Content/cda-phlncd-flavivirus (Cited 8 October 2008.)
0 5 10 15 20 25 30
0–4 5–9
10–14 15–19 20–24 25–29 30–34 35–39 40–44 45–49 50–54 55–59 60–64 65–69 70–74 75–79 80–84 85
⫹
Age group (years)
Notifications
Figure 3. Number of Ross River virus notifications for each age group in the Greater Western Area Health Service, 2007–08.
Source: Notifiable Diseases Database accessed through Health Outcomes and Information Statistical Toolkit, NSW Department of Health.
Ross River virus disease in inland NSW
Communicable Diseases Report, NSW,
September and October 2010
Communicable Diseases Branch
NSW Department of Health
For updated information, including data and facts on specific diseases, visit www.health.nsw.gov.au and click on Public Healthand then Infectious
Diseases. The communicable diseases site is
avail-able at: http://www.health.nsw.gov.au/publichealth/ infectious/index.asp.
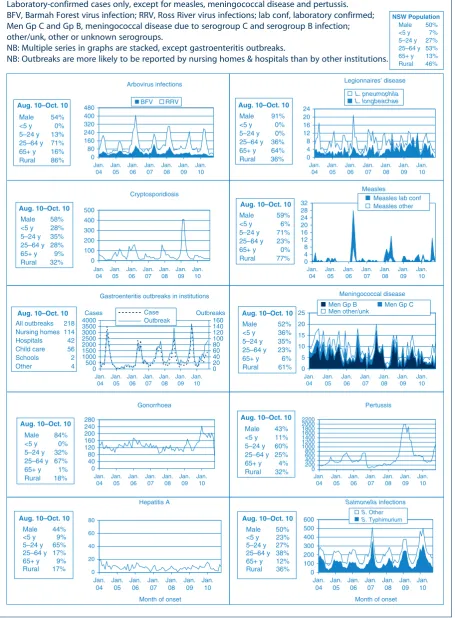
Figure 2 and Tables 1 and 2 show reports of communicable diseases received through to the end of September and October 2010 in New South Wales (NSW).
Enteric infections
Outbreaks of foodborne disease
Eleven outbreaks of suspected foodborne disease were investigated in September and October 2010. In three of these outbreaks, stool specimens were collected from cases and tested. In one of these outbreaks in an aged care facility, stool specimens tested positive for Salmonella Infantis. No clear source of infection was identified although one chicken food sample collected from the facility tested positive for anotherSalmonellaserogroup (S. Sophia). In another outbreak also in an aged care facility, stool specimens tested positive for Clostridium perfringens toxin but no clear source of infection was identified. Stool specimens from the third outbreak were positive forSalmonellaTyphimurium (MLVA: 3-9-7-13-523). While this outbreak was epidemiologically linked to consumption of pork rolls served at a bakery, none of the food samples that were subsequently collected from the bakery tested positive forSalmonellaspp.
In two other outbreaks, food and/or environmental samples (e.g. microbiological swabs of food preparation areas) were taken but no pathogens were identified. In the remaining six outbreaks, none of the cases submitted a stool specimen for testing and a causative pathogen for the outbreak could not be identified. One of these outbreak investigations is ongoing.
Outbreaks of gastroenteritis in institutional settings During September and October, 131 outbreaks of gastro-enteritis in institutions were reported, affecting a total of 2182 people. Sixty-eight outbreaks occurred in aged care facilities, 39 in child care centres, 20 in hospitals, and one each in a military institution, school, pre-school and camp. All of these outbreaks appeared to have been caused by person-to-person spread of a viral illness. In 76 outbreaks (58%) one or more stool specimens were collected from cases; in 39 of these outbreaks (56%) norovirus was detected, and in 15 (20%) rotavirus was detected. Stool specimen test results for several outbreaks are pending. Viral gastroenteritis tends to peak in winter with around 15 out-breaks each week; over the past 5 years in September and October the average number of outbreaks has been 124.
Gastroenteritis in the community
The number of patients presenting with gastrointestinal illness who presented to 56 of the state’s largest emergency departments in NSW remained steady and was just below the usual range for this time of year (Figure 1).
Respiratory and other infections
Influenza
During September and October influenza activity was low in NSW, as measured by the number of patients who presented to 56 of the state’s largest emergency departments with influenza-like illness and the number of patients who tested positive for influenza at diagnostic laboratories.
• There were 344 emergency department presentations of patients with influenza-like illness (1.8 per 1000 presentations) for September and 287 presentations (1.9 per 1000 presentations) for October.
• There were 306 cases of laboratory-confirmed influenza (including 241 of pandemic (H1N1) 2009) reported in September and 160 (including 125 of pandemic (H1N1) 2009) in October.
• A total of 26 patients with laboratory-confirmed influ-enza were admitted to hospital intensive care units; 14 in September and 12 in October.
For a more detailed report on influenza disease activity in NSW see: http://www.health.nsw.gov.au/PublicHealth/ Infectious/influenza_reports.asp.
Vaccine-preventable diseases
Measles
previously reported measles outbreak in the NSW North Coast Area,1 and all had epidemiological links with a secondary case, an inmate at a prison in the North Coast Area.
Serological surveys indicate that measles immunity is high (98%) in people born before 1968 due to exposure to wild measles, but lower (89%) in people born from 1974 to 1980 due to less frequent exposure to wild virus and lower rates of vaccine uptake.2Vaccines which protect against measles are now routinely given to infants at 12 months and at 4 years, and this provides long-lasting immunity in 99% of recipients. These recent outbreaks highlight the importance of completing measles immunisation, particu-larly prior to overseas travel.
Meningococcal disease
Eighteen cases of meningococcal disease were reported in NSW in September and October 2010 (14 cases were reported in the same period in 2009). The ages of the affected people ranged from 0 to 83 years (six cases were children aged less than 5 years). Twelve cases were caused by serogroup B, one case was caused by serogroup C (in an unvaccinated adult), and one case was caused by serogroup W135. For four cases the serogroup was unknown.
To date this year, 63 cases of meningococcal disease have been reported in NSW (including five deaths) compared to 80 cases for the same period in 2009 (including four deaths).
A free vaccine for serogroup C meningococcal disease is available for infants at 12 months of age. Consequently, serogroup C meningococcal disease is now mainly seen in adults and in unimmunised children. In NSW this year, 82% of cases of meningococcal disease (where the sero-group was known) have been caused by serosero-group B, for which there is no vaccine.
Pertussis (whooping cough)
During September and October, 2108 cases of pertussis were reported in NSW. Over 20 000 cases of whooping cough were reported during 2008 and 2009. Case reports declined to a low in April this year (with 314 cases reported), but have since increased, with 1201 cases repo-rted in October. To date, 5423 cases have been reporepo-rted in NSW compared with 11 370 for the same period in 2009.
A free vaccine is available for infants at 2, 4 and 6 months (the first dose can be given as early as 6 weeks of age) with a booster dose at 4 years (which can be given from 3 years and 6 months of age). Immunisation reduces the risk of infection, however the vaccine does not provide lifelong protection and re-infection can occur. Because pertussis immunity wanes over time, many older children and adults are susceptible to infection and can be the source of new infections in infants. For a limited time, free pertussis (dTpa) vaccine is available for all new parents, grand-parents and any other adults who will regularly care for infants less than 12 months of age. Free vaccine is also provided to Year 7 and Year 10 students as part of the NSW School-based Vaccination Program.
Haemophilus influenzaetype b invasive infection
One case of Haemophilus influenzae type b invasive infection (Hib) was reported in a fully vaccinated, non-indigenous 3-year old child in NSW in September. For the same period in 2009, there were no cases of Hib reported in NSW in any age group.
Tuberculosis program
In October 2010, a case of extensively drug-resistant tuberculosis (XDR-TB) was identified in a NSW resident who had been treated for tuberculosis overseas. XDR-TB is a relatively rare event globally and this is only the second case identified in Australia. Tuberculosis can usually be
0
01 Feb 01 Nov
Weekly counts
01 May
Year
01 Aug 01 Nov
500 1000 1500 2000 2500 3000
52 weeks ending
31 Oct 10 31 Oct 07
31 Oct 09 31 Oct 06
31 Oct 08 31 Oct 05
Figure 1. Total weekly counts of emergency department visits for gastrointestinal illness, for the 12 months to 30 October 2010 (thick line), compared with each of the previous 5 years (thin lines) (includes data from 56 of the largest emergency departments in NSW).
Source: Public Health Real-time Emergency Department Surveillance System, NSW Department of Health.
Communicable Diseases Report
![Table 1.Population-adjusted primary dentition caries experience (dmft) statistics of children aged 6]10 years in Lithgow, NSW](https://thumb-us.123doks.com/thumbv2/123dok_us/59848.2007653/3.595.58.552.101.210/population-adjusted-primary-dentition-experience-statistics-children-lithgow.webp)
![Table 2.Population-adjusted permanent dentition caries experience (DMFT) statistics of children aged 6]10 years inLithgow, NSW](https://thumb-us.123doks.com/thumbv2/123dok_us/59848.2007653/4.595.46.282.301.446/population-adjusted-permanent-dentition-experience-statistics-children-inlithgow.webp)