Copyright © Universal Multidisciplinary Research Institute Pvt Ltd
44
South -Asian Journal of Multidisciplinary Studies (SAJMS) ISSN:2349-7858:SJIF:2.246:Volume 3 Issue 41
Evaluation Of Genetic Diversity In Five Cultivars Of Pigeon Pea Using
Cytological Characters And Protein Profiling
S.A.Shah, G.N.Sheikh, R.Kudesia, M.K, Shrivastava, Z.A.Reshi
Institute of Basic Sciences, Department of Botany, Bundelkhand University, Jhansi (U.P.)-284128, India. Department of Botany, University of Kashmir, 190006
Abstract
Cytological characters and protein profile of 5 cultivars of pigeon pea (AMAR, AZAD, MAL-13, and NDA-1and Pusa-9) of family Fabaceae were investigated through poly acrylamide gel electrophoresis and using cytological characters viz. mitotic index and pollen viability. The present protein profile revealed that experimental accession Amar (A1) is very close to accession Pusa-9(A5) and accessions MAL-13 and NDA-1 are closer at molecular level as compared to other accessions. Similarity index was more i.e., 34.61% in Amar (A1) and Pusa-9 (A5) as compared to other accessions i.e., Amar and NDA-1 where similarity index was only 18.51%. Present investigation revealed that mitotic index was highest in MAL-13 i.e., 18.25% meaning that accession has highest power of division. A dendrogram constructed based on UPGMA clustering method revealed two major clusters, cluster-1 and cluster-11 comprising of two accessions each. The accession Azad (A2) occupies a distinct place as revealed in dendrogram. Jaccards similarity coefficient ranged from 0.23810 - 0.40000.
Keywords: Genetic diversity; mitotic index; pigeon pea; SDS-PAGE; UPGMA.
Introduction.
Pigeon pea is widely grown in semi-arid tropics, particularly in the Indian subcontinent where it accounts for over 70% of the world’s production and coverage (FAO, 2007). The International crop Research Institute for the semi-Arid Tropics (ICRISAT) maintains a large ex-situ collection of over 13,000 acceccions of Cajanus cajan from around 75 countries (http://singer.cgiar.org). It is likely that pigeon pea evolved by interspecific hybridization of Cajanus cajanifolia and Cajanus scarabaeoides (Nadimplli et al., 1992). Pigeonpea (Cajanus cajan L. Millspaugh) is a major grain legume of the tropical and subtropical regions. It is a diploid species (2n = 2x = 22) comprising a genome of 833.1 Mbp arranged into 11 linkage groups (Varshney et al. 2012). India is the centre of origin and largest producer of pigeonpea in the world sharing approximately 70% of the production and covering 74% of the area (Bohra et al. 2012). It plays an important role in food security, balanced diet and subsistence agriculture because of its diverse usages in food, fodder, fuel, soil conservation, integrated farming systems and symbiotic nitrogen fixation (Reddy et al. 2005). Further, pigeon pea offers a rich source of variability in the form of wild relatives, which could be utilized for disease resistance, good agronomic traits, enhancing nutritional quality, identification and diversification of cytoplasmic base of cytoplasmic male sterility (CMS) system etc. Pigeonpea suffers from a number of abiotic (e.g. drought, salinity and water-logging) and biotic (e.g. diseases like Fusarium
wilt, sterility mosaic and pod borer insects) stresses. Among biotic stresses, Fusarium wilt (FW) caused by
Copyright © Universal Multidisciplinary Research Institute Pvt Ltd
45
South -Asian Journal of Multidisciplinary Studies (SAJMS) ISSN:2349-7858:SJIF:2.246:Volume 3 Issue 4been focused on the use of electrophoretic methods for reliable discrimination and identification of plant varieties (Sammour, 1985; Sammour et al., 1994; Przybylska J, and Zimniak-Przybylska Z. 1995). Electrophoresis adds information to taxonomy and should not be dissociated from morphological, anatomical and cytological observations (Boulter et al., 1966; Ghafoor et al., 2002). Seed protein profiles and molecular markers obtained by electrophoresis have been successfully used to study taxonomical and evolutionary relationships of several crop plants (Gepts and Bliss, 1988; Gepts et al., 1988; Sammour, 1989; Rao et al., 1992Discovery of molecular markers served several functions in pigeonpea including, genetic diversity analysis using restriction fragment length polymorphism (RFLP) (Nadimpalli et al. 1994; Sivaramakrishnan et al. 2002), amplified fragment length polymorphism (AFLP) (Panguluri et al. 2006; Wasike et al. 2005), random amplification of polymorphic DNA (RAPD) (Yadav et al. 2012),
2. Methods
Materials for biochemical and cytological studies were collected from Indian Institute of Pulse Research (IIPR) Kanpur (U.P.) India
Table-1 The experimental accessions are
S.NO Accession Name Sample Name Area of Collection Date of Collection
1 AZAD A1 IIPR 11-04-2011
2 AMAR A2 IIPR 11-04-2011
3 MAL-13 A3 IIPR 11-04-2011
4 NDA-1 A4 IIPR 11-04-2011
5 PUSA-9 A5 IIPR 11-04-2011
Mitotic index was determined from the root tips of experimental species, root tips were harvested and fixed in 3:1 ratio of alcohol and glacial acetic acid after 6 hours of fixation the root tips were preserved in 70% alcohol.
Formulae used:
Mitotic Index= No. of dividing cells
__________________________x100 Total no. of cells
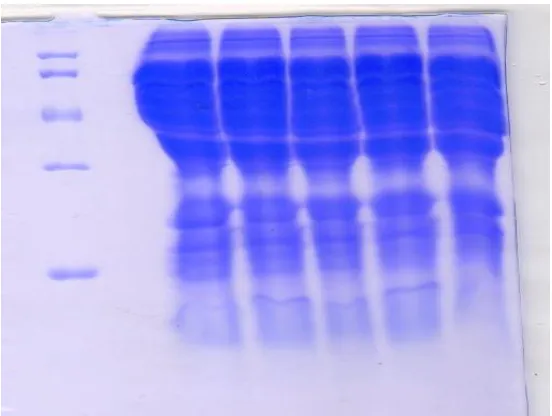
Total seed proteins were also extracted from 1g of seed flour using 400 μl of extraction buffer that contained 25mM tris HCl pH- 8.3, 10% SDS. 5M urea and 10% mercapto-ethanol. Seed flour was thoroughly mixed with buffer by vortexing. The extracted protein was separated by centrifuging the sample at the rate of 1500 rpm for 10 minutes electrophoresis was carried out in discontinuous SDS-PAGE using 7% acrylamide gel. Electrophoresis was run at 50v. The gels were stained in the staining solution containing 40ml methanol, coomassie blue [1%] 1gm and glacial acetic acid (10 ml) was made up to 100 ml by adding distilled water. Destaining was done in a solution containing 30ml methanol, 6ml glacial acetic acid, 74 ml of distilled water until the background color disappeared, and protein bands were clearly visible.
2.1 Data analysis
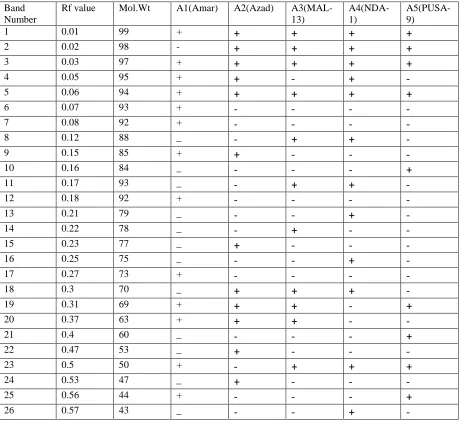
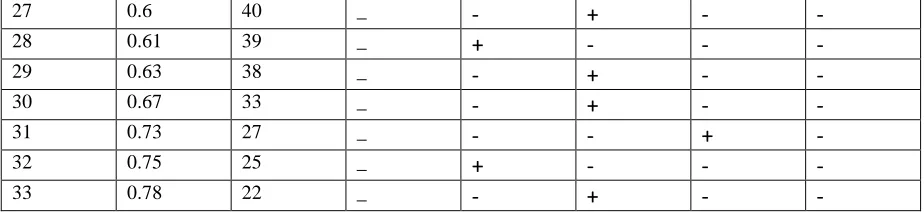
The results obtained from cytological characters were analysed. RF value and the molecular weight of each protein band was determined [Table 3].Protein bands were scored depending on their presence [1] or absence [0]. Similarity coefficient was determined and hierarchical clustering was constructed by unweighted pair group method with arithmetic average [UPGMA].
2.3 Mitotic study
The mitotic index in different investigated genera is given in Table 2, determined by the formula as described in Methods.
2.4 Protein profiling
Copyright © Universal Multidisciplinary Research Institute Pvt Ltd
46
South -Asian Journal of Multidisciplinary Studies (SAJMS) ISSN:2349-7858:SJIF:2.246:Volume 3 Issue 4Table 2: The mitotic index in different investigated genera.
S.NO Accession Name Mitotic Index
1 Amar 7.32%
2 Azad 14.98%
3 MAL-13 18.25%
4 NDA-1 10.79%
5 Pusa-9 15.11%
Table -3
Showing the presence and absence of bands in different accessions of pigeon pen
Band Number
Rf value Mol.Wt A1(Amar) A2(Azad)
A3(MAL-13)
A4(NDA-1)
A5(PUSA-9)
1 0.01 99 +
+
+
+
+
2 0.02 98 -
+
+
+
+
3 0.03 97 +
+
+
+
+
4 0.05 95 +
+
-
+
-
5 0.06 94 +
+
+
+
+
6 0.07 93 +
-
-
-
-
7 0.08 92 +
-
-
-
-
8 0.12 88 _
-
+
+
-
9 0.15 85 +
+
-
-
-
10 0.16 84 _
-
-
-
+
11 0.17 93 _
-
+
+
-
12 0.18 92 +
-
-
-
-
13 0.21 79 _
-
-
+
-
14 0.22 78 _
-
+
-
-
15 0.23 77 _
+
-
-
-
16 0.25 75 _
-
-
+
-
17 0.27 73 +
-
-
-
-
18 0.3 70 _
+
+
+
-
19 0.31 69 +
+
+
-
+
20 0.37 63 +
+
+
-
-
21 0.4 60 _
-
-
-
+
22 0.47 53 _
+
-
-
-
23 0.5 50 +
-
+
+
+
24 0.53 47 _
+
-
-
-
25 0.56 44 +
-
-
-
+
Copyright © Universal Multidisciplinary Research Institute Pvt Ltd
47
South -Asian Journal of Multidisciplinary Studies (SAJMS) ISSN:2349-7858:SJIF:2.246:Volume 3 Issue 427 0.6 40 _
-
+
-
-
28 0.61 39 _
+
-
-
-
29 0.63 38 _
-
+
-
-
30 0.67 33 _
-
+
-
-
31 0.73 27 _
-
-
+
-
32 0.75 25 _
+
-
-
-
33 0.78 22 _
-
+
-
-
Table 4 Showing the Similarity Index of different accessions of Pigeon Pea
Amar Azad Mal-13 NDA-1 Pusa-9
Amar 100%
Azad 25% 100%
MAL-13 20.68% 24.13% 100%
NDA-1 18.51% 22.22% 28.57% 100%
Pusa-9 34.61% 30.76% 25.92% 24% 100%
Where similarity Index = Number of common bands
________________________ X Total no. of bands
Table 5:- Jaccard s similarity coefficient
Amar Azad Mal-13 NDA-1 Pusa-9
Amar
Azad 0.35000
MAL-13 0.27273 0.31818
NDA-1 0.23810 0.28571 0.40000
Pusa-9 0.37500 0.27778 0.3333 0.29412
Copyright © Universal Multidisciplinary Research Institute Pvt Ltd
48
South -Asian Journal of Multidisciplinary Studies (SAJMS) ISSN:2349-7858:SJIF:2.246:Volume 3 Issue 4Figure 1:- Dendrogram showing the UPGMA showing genetic relationship among five accessions of cajanus cajan based on Jaccards similarity , estimates of protein profiling.
Copyright © Universal Multidisciplinary Research Institute Pvt Ltd
49
South -Asian Journal of Multidisciplinary Studies (SAJMS) ISSN:2349-7858:SJIF:2.246:Volume 3 Issue 43. Results and Discussion
Great variations were observed in cytological and biochemical characters among five different experimental accessions of Cajanus cajan. To find out genetic diversity among them cytological and biochemical analysis was done during present investigation. The biochemical analysis through protein profiling helped to find out the correlation between five different accessions of cajanus cajan. Cytological study was done to find out mitotic index. The mitotic index [MI] was highest in case of MAL-13 i.e., 18.25% which revealed that this cultivar has highest power of division. The Pusa-9 i.e., 15.11%, Azad 14.98%, NDA-1 10.79% and lowest mitotic Index in Amar i, e., 7.32%. Earlier, cytological and palynological analysis of three species of genus Solanum at Saudi Arabia was done by Al-Wadi et al (2007). Almost similar were observed by Bhat and Kudesia (2011) in five species of Solanaceae. During protein profiling of total proteins of experimental accessions, maximum 15 protein bands generated in case of NDA-1. The protein band for highest molecular weight i.e., 99 KD generated in case of Amar while that of lowest molecular weight i.e., 22 KD was generated in mal-13.The bands observed in different accessions are fourteen in Amar(A1),fourteen in Azad(A2),13 in Mal-13(A5),fifteen in NDA-1(A4) and twelve in Pusa-9(A2).A total of 33 bands were scored out of them 30 were polymorphic with a total of 90.09% polymorphism and three bands were monomorphic with 9.09% monomorphism.Gafoor and Arshad (2008) got 25 bands and among them 20 were polymorphic with a total of 80% polymorphism. Similarly Kakaei and Kehrizi (2011) got 17 bands. Shrivastava and Gupta (2010) almost got same results. This little change is might be due to the crop change. The similarity index [S.I.] calculated after proteins of five selected experimental accessions of cajanus cajan was maximum i.e., 34.61% between Amar and Pusa-9, and next between Azad and Pusa-9 i.e., 30.76%, the lowest similarity index was found between Amar and NDA-1 i.e., 18.51 %Table[4].
4. Conclusion
The presence of genetic diversity is important for improving any crop species. An understanding of the magnitude and patterns of genetic diversity in crop plants has important implications in breeding programmes and for conservation of genetic resources. A large number of cultivars utilizing limited genetic resources are grown and are being released. Often plant breeders limit their efforts to a narrow range of adapted lines for genetic improvement which were more likely to produce economic gains in the short term but may have enhanced vulnerability to insects pests and other biotic stresses. Therefore, it is concluded that except Amar and Pusa-9, all the experimental accessions show low genetic diversity
Abbreviations
SDS= Sodium dodecyl sulphate
UPGMA= Unweighted pair group method using arithmetic average PAGE = Polyacrylamide gel electrophoresis
RAPD= Random amplified polymorphic DNA
Competing Interests
The authors declare that they have no competing interests.
Authors’ Contributions
The work is original and it has been carried out by SAS for M.Phil. degree under supervision of RK at Bundelkhand University,
Jhansi (U. P.), India, and at Indian Biotechnology Research Institute, Agra (U. P.), India.
Acknowledgement
The authors are thankful to IBRC (Indian Biotechnology Research Institute), Agra, India, for providing lab facilities and the help of Dr. S. Chauhan is greatly acknowledged.
References
Al-Wadi MH, 2007. Palynological and cytological characters of three species of genus Solanum from Saudi Arabia. Journal of Biological Sciences, 7(4): 626-631.
Copyright © Universal Multidisciplinary Research Institute Pvt Ltd
50
South -Asian Journal of Multidisciplinary Studies (SAJMS) ISSN:2349-7858:SJIF:2.246:Volume 3 Issue 4using cytological characters and protein profiling. Genetic Engineering and Biotechnological Journal, GEBI-20.
F.A.O. (2007).http://faostat.fao.org
GEPTS P. 1989. Genetic diversity of seed storage proteins in plants. In: Brown AHD, Clegg MT, Kahler AL, and Weir BS [eds.], Plant population genetics, breeding and genetic resources, 64–82. Sinauer Associates Inc., Sunderland, Massachusetts
.
Ghafoor, A. and Arshad, M. 2008. Seed protein profiling of Pisum sativum L. germplasm using sodium dodecyl sulphate polyacrylacrylamide gel electrophoresis (SDSPAGE) for investigation of biodiversity. Pak. J. Bot., 40(6): 2315-2321.
Kakaei, M. and Kahrizi, D. 2011. Study of seed protein pattern of brassica napus varieties, via sodium dedecyl sulphate polyacrylamide gel electrophoreses. International research Journal of Biotechnology, (ISSN: 2141-5153). 2 (1) – 026-028.
Srivastava, S. and Gupta, PS. 2010. SDS and Native page protein profile for identification and characterization of elite sugarcane genotypes. Sugar Tech, 4 (3-4): 143-147.
Bohra A., Saxena R. K., Gnanesh B. N., Saxena K. B., Byregowda M., Rathore A. et al. 2012 An intra-specific consensus genetic map of pigeonpea [Cajanus cajan (L.) Millspaugh] derived from six mapping populations. Theor. Appl. Genet. 125, 1325– 1338.
Gwata E. T., Silim S. N. and Mgonja M. 2006 Impact of a new\ source of resistance to Fusarium wilt in pigeonpea. J. Phytopathol. 154, 62–64.
Kumar S., Gupta S., Chandra S. and Singh B. B. 2004 How wide is the genetic base of pulse crops. In Pulses in new perspective (ed. M. Ali, B. B. Singh, S. Kumar and Vishwadhar), pp. 211– 221. IIPR, Kanpur, India.
Nadimlli Rpa. G., Jarret R. L., Phatak S. C. and Kochart G. 1994 Phylogenetic relationships of the pigeonpea (Cajanus cajan) based on nuclear restriction fragment length polymorphism. Genome 36, 216–223.
Okiror M. A. 2002 Genetics of resistance to Fusarium udum in pigeonpea [Cajanus cajan (L.) Millsp.]. Indian J. Genet. PlantBreed. 62, 218–220.
Panguluri S. K., Janaiah K., Govil J. N., Kumar P. A. and Sharma P. C. 2006 AFLP fingerprinting in pigeonpea (Cajanus cajan (L.) Millsp.) and its wild relatives. Genet. Resour. Crop Evol. 53, 523–
531.
Prasad P., Eswara Reddy N. P., Anandam R. J. and Lakshmikantha R. G. 2003 Isozymes variability among
Fusarium udum resistant cultivars of pigeonpea (Cajanus cajan (L.) (Millsp). ActaPhysiol. Plant 25, 221–228.
Reddy L. J., Upadhyaya H. D., Gowda C. L. L. and Singh S. 2005 Development of a core collection in pigeonpea [Cajanus cajan (l.) Millspaugh] using geographic and qualitative morphological descriptors. Genet. Resour. Crop Evol. 52, 1049–1056.
.
Saxena K. B. and Sharma D. 1990 Pigeonpea: genetics. In: The pigeonpea (ed. Y. L. Nene, S. D. Hall and V. K. Sheila).Wallingford, Oxon, England.
Sivaramakrishnan S., Kannan S. and Reddy L. J. 2002 Diversity in selected wild and cultivated species of pigeonpea using RFLP of mtDNA. Euphytica 125, 21–28. Sneath P. H. A. and Sokal R. R. 1973 Numerical
Copyright © Universal Multidisciplinary Research Institute Pvt Ltd
51
South -Asian Journal of Multidisciplinary Studies (SAJMS) ISSN:2349-7858:SJIF:2.246:Volume 3 Issue 4Varshney R. K., Chen W., Li Y., Bharti A. K., Saxena R. K., Schlueter J. A. et al. 2012 Draft genome sequence of pigeonpea (Cajanus cajan), an orphan legume crop of resource poor farmers. Nat. Biotechnol. 30, 83–89.
Wasike S., Okori P. and Rubaihayo P. R. 2005 Genetic variability and relatedness of the Asian and African pigeonpea as revealed by AFLP. Afr. J. Biotechnol. 4, 1228–1233.
Yadav K., Yadav S. K., Yadav A., Pandey V. P. and Dwivedi U. N. 2012 Genetic diversity of pigeonpea (cajanus cajan (l.) Millsp.) cultivars and its wild relatives using randomly amplified polymorphic DNA (RAPD) markers. Am. J. Plant. Sci. 3, 322–330.
Boutler D, Thurman DA, and Turner BL. 1966. The use of disc electrophoresis of plant proteins in systematics. Taxon 15: 135–143.
Gepts P, and Bliss FA. 1988. Dissemination pathways of common bean (Phaseolus vulgaris, Fabaceae) deduced from phaseolin electrophoretic variability. II. Europe and Africa. Economic Botany 42: 86–104.
Gepts P, Kmiecik K, Pereira P, and Bliss FA. 1988. Dissemination pathways of common been (Phaseolusvulgaris, Fabaceae) deduced from phaseolin electrophoretic variability. 1. The Americas. EconomicBotany 42: 73–85.
Gepts P. 1989. Genetic diversity of seed storage proteins in plants. In: Brown AHD, Clegg MT, Kahler AL, and Weir BS [eds.], Plant population genetics, breeding and genetic resources, 64–82. Sinauer Associates Inc., Sunderland, Massachusetts.
Ghafoor A, Ahmad Z, Qureshi AS, and Bashir M. 2002. Genetic relationship in Vigna mungo (L.) Hepper and V. radiata (L.) R. Wilczek based on morphological traits and SDS-PAGE. Euphytica 123: 367–378.
Murphy RW, Sites JW, Buth DG, and Haufler CH. 1990. Protein 1: isozyme electrophoresis. In: Hillis DH, Moritz C [eds.], Molecular systematics, 45–126..
Przybylska J, and Zimniak-Przybylska Z. 1995. Electrophoretic pattern of seed globulins in the Old World Lupinus species. Genetic Resources and CropEvolution 42: 69–75.
Rao R, DEL Vaglio M, PainoMDU, and Monti L. 1992. Identification of Vigna ssp. Through specific seed storage polypeptides. Euphytica 62: 39–43.
Sammour RH. 1985. The use of protein characters in the taxonomy of pea and beans. Ph.D. Dissertation, Tanta University, Tanta, Eygpt.
Sammour RH. 1989. Electrophoresis of the seed proteins of Vicia faba L. and its immediate progenitors: A reappraisal.Plant Breeding 104: 196–201.
Sammour RH. 1994. Species relationships in Genus Lens as indicated by electrophoresis – A reappraisal. Lens Newsletter 21: 1–4.