ISSN : 2581-7175 ©IJSRED: All Rights are Reserved Page 547
A Study on Competency Mapping at BGR Energy in India
1
Toopalli Sirisha ,
2Dr. Nalla Bala Kalyan
Assistant Professor ,Department of Management Studies , Sri Venkateswara College of Engineering Associate Professor, Department of Management Studies , Sri Venkateswara College of Engineering
---
************************
---Abstract:
An ever changing and highly dynamic environment impacted upon by forces such as liberalization,
world-wide competition marked by new entrants, fast changing technologies, new models of business and converging industries, thrust on operational efficiency and effectiveness ably supported by technological advancements, increased sensitivity to stakeholders and a trend towards rights-based entitlements created an impetus to the organizations to reform and adopt new practices to manage their human resources. In the today’s scenario, “Skill and Competency” are the main drivers of an organization’s efficiency, effectiveness and performance at large. So Firms are becoming increasingly aware of the need to have competent employees for survival and long term sustainability. All types of Organizations irrespective of their size, structure and age are talking about competencies. All organisations are still struggling with defining, designing and deploying Competency Mapping models, frameworks and processes. The aim of the study is to explore the extent of usage and formalization of Competency Mapping in BGR Energy. The current study aims at analysing the competency gaps at BGR Energy.
Keywords:BRG Energy,Competency, Competency Mapping, Competency Gaps, Skill
---
************************
---1. Introduction
Currently, the humans are consider at corporations on the far side vital because the corporations have come back to appreciate that a fighting work, skilled, competent men with the right quantity of motivation would do the wonders that might not even be done by plain miracles. It’s a important to a company to coach and shapeup their men to best suited their role to be compete. Hence, the organizations have begun and area unit continued to impart coaching, and this has successively developed the ability among the people. Within the present of labor, characterized by fast and dramatic modification, the attainment of competency has become associate degree of integral element of individual, both in structure and national methods. Competency mapping is extremely significant and is a necessary exercise. Each well managed firm should have well outlined roles and list of competencies needed to perform at every role effectively. Such list ought to be used for accomplishment of, performance, promotions and coaching wants identification. Competency mapping is regarding characteristic ideal behaviors and private skills that distinguish exceptional and colossal performance from the typical.
2. Statement of the Problem
In the BGR Energy the higher level employees (managerial, supervisory and administration categories), needs and job roles becoming a challenge day by day. With their profile to manage their subordinates / employees and to improve the efficiency levels they have to focus on leadership development and succession planning to achieve the productivity to maintain the required competence levels. The perception includes different aspects like adaptability, initiative, judgement, Problem solving, Planning and Organisation, Leadership Quality, Productivity and Use of Technology. This study aims at studying at what level the employees are adopting to competency levels.
ISSN : 2581-7175 ©IJSRED: All Rights are Reserved 3. Objectives of Study
To analyze the employee’s competency mapping To assess the dimensions of competency mapping by
technology, planning and organization, communication, leadership level .
4. Research Methodology
Research Design Data Source/Collection Research Instrument Research Approach Contact Method Sample Units Sample Size Sample Area
5. Data Analysis and Interpretation:
To identify the competency possessed by the employees through well structured questionnaire. Where first part of the questionnaire contains personal data of the respondent and second part is containing adaptability, communication, planning, productivity, problem solvi
competencies consisting 3 statements each. Which are sc for the current study is 150 employees
technique has been adopted Data has been analyzed using frequencies, percentages, ANOVAs, and
correlation.
5.1 Department Wise Respondents
Department Wise Respondents Department
HR Finance Purchase
Quality IT Design
Total Source: Sample Data
Department Wise Respondents
0 50 100 150 200
©IJSRED: All Rights are Reserved employee’s competency mapping at BGR, Tamilnadu
the dimensions of competency mapping by using factors of adaptability, initiative, use of technology, planning and organization, communication, leadership to find the competency at company
Descriptive Research Primary Data, Secondary Data Questionnaire
Survey
Personal Interview Employees At Bgr Enegry 150
Bgr Enegry Pvt Ltd :
the competency possessed by the employees through well structured questionnaire. Where first part of the questionnaire contains personal data of the respondent and second part is containing adaptability, communication, planning, productivity, problem solving, initiative, use of technology as generic competencies consisting 3 statements each. Which are scaled through 5- Point Likert's Scale,
150 employees BGR Energy. Sampling Technique: Simple Random sampling
Data has been analyzed using frequencies, percentages, ANOVAs, and
Table 1
Department Wise Respondents
Department Frequency Percentage
30 20
Finance 25 19.67
Purchase 20 13.33
Quality 40 26.67
15 10
Design 20 13.33
Total 150 100
Source: Sample Data
Figure 1
Department Wise Respondents
Frequency
Percentage
Page 548 using factors of adaptability, initiative, use of
to find the competency at company
the competency possessed by the employees through well structured questionnaire. Where first part of the questionnaire contains personal data of the respondent and second part is containing ng, initiative, use of technology as generic Point Likert's Scale, the sample size Simple Random sampling Data has been analyzed using frequencies, percentages, ANOVAs, and
Frequency
ISSN : 2581-7175 ©IJSRED: All Rights are Reserved 5.2 Follows Instructions Respondents
Respondents Criteria
Strong Disagree Disagree
Neutral Agree Strong Agree
Total Source: Sample Data
Respondents
Inference: From the table it is inferred that 24% of respondent agree with the performance on this competency follow instruction responds to management direction is better than acceptable standard and 18% of respondents disagree with the performance on thi
management direction is not acceptable standard and a development is need.
5.3 Respondents Undertakes Self Development Activities
Respondents Undertakes Self Development Activities Criteria
Strongly disagree Disagree
Neutral Agree Strongly agree
Total
Source: Sample Data
Respondents
Inference: From the table it is inferred that 27% of respondent agree with the performance in this competency undertakes self development activities is better than acceptable standard and 10% of respondent disagree with the performance in this competency u
acceptable and standard. 0 50 100 150 200
High Moderate
0% 50% 100%
©IJSRED: All Rights are Reserved Respondents to Management Direction
Table 2
Respondents to Management Direction
Frequency Percentage
Strong Disagree 10 6.67
27 18.0
43 28.67
36 24.0
Strong Agree 34 22.66
150 100
Source: Sample Data
Figure 2
Respondents to Management Direction
From the table it is inferred that 24% of respondent agree with the performance on this competency follow instruction responds to management direction is better than acceptable standard and 18% of respondents disagree with the performance on this competency follow instruction responds to management direction is not acceptable standard and a development is need.
Undertakes Self Development Activities Table 3
Undertakes Self Development Activities
Frequency Percentage
25 16.67
15 10.00
50 33.33
40 26.67
20 13.33
150 100
Source: Sample Data
Figure 3
s Undertakes Self Development Activities
From the table it is inferred that 27% of respondent agree with the performance in this competency undertakes self development activities is better than acceptable standard and 10% of respondent disagree with the performance in this competency undertakes self development activities is not up to
Moderate Low Total
Frequency
Percentage
Percentage
Frequency
Page 549 From the table it is inferred that 24% of respondent agree with the performance on this competency follow instruction responds to management direction is better than acceptable standard and s competency follow instruction responds to
From the table it is inferred that 27% of respondent agree with the performance in this competency undertakes self development activities is better than acceptable standard and 10% of respondent ndertakes self development activities is not up to
Frequency
Percentage
Percentage
ISSN : 2581-7175 ©IJSRED: All Rights are Reserved 5.4 Showing Respondents Use Time Efficiently
Showing Respondent Criteria
Strongly disagree Disagree Neutral Agree Strongly agree
Total Source: Sample Data
Respondent
Inference: From the table it is inferred that 29% of responden competency use of time efficiently is better than accept
with the performance in this competency use of time efficiently is not up to acceptable and standard.
5.5 The Respondents to Achieve Established
The Respondents to Achieve Established Goals Criteria
Strongly disagree Disagree
Neutral Agree Strongly agree
Total
Source: Sample Data
Respondents to Achieve Established Goals 0
50 100 150
0 50 100 150 200
High Moderate
©IJSRED: All Rights are Reserved Use Time Efficiently
Table 4
Showing Respondents Use Time Efficiently
Frequency Percentage
10 6.67
20 13.33
50 33.33
43 28.67
27 18.00
150 100
Source: Sample Data
Figure 4
Respondents Use Time Efficiently
From the table it is inferred that 29% of respondent agree with the performance in competency use of time efficiently is better than acceptable standard and 14% of respondent disagree with the performance in this competency use of time efficiently is not up to acceptable and standard.
The Respondents to Achieve Established Goals Table 5
The Respondents to Achieve Established Goals
Frequency Percentage
Strongly disagree 18 12
22 14.67
42 28
38 25.33
Strongly agree 30 20
150 100
Source: Sample Data
Figure 5
Respondents to Achieve Established Goals
Frequency
Percentage
Moderate Low Total
Frequency
Percentage
Page 550 t agree with the performance in this
respondent disagree with the performance in this competency use of time efficiently is not up to acceptable and standard.
Frequency
Percentage
Frequency
ISSN : 2581-7175 ©IJSRED: All Rights are Reserved Inference: From the table it is inferred that 26% of responden competency achieves established goals is
with the performance in this competency achieves established goals is not up to acceptable and standard.
5.6 Showing Respondents on Adapts New Technologies
Respondent Criteria Strongly disagree
Disagree Neutral
Agree Strongly agree
Total
Source: Sample Data
Respondents o
Inference: From the table it is inferred that 24% of respondent agree with the performance in this competency adapts new technologies is better than acceptable standard and 12% of respondent disagree with the performance in this competency adapts new technologies is not up to acceptable and standard.
5.7Showing the Respondents Takes Independent Actions and Calculated Risks
Respondents takes Independent Actions and Calculated Risks Criteria
Strongly disagree Disagree
Neutral Agree Strongly agree
Total Source: Sample Data
Respondents takes Independent Actions and Calculated Risks 0
100 200 300
0 100 200
©IJSRED: All Rights are Reserved
From the table it is inferred that 26% of respondent agree with the performance in competency achieves established goals is better than acceptable standard and 14% of
with the performance in this competency achieves established goals is not up to acceptable and standard.
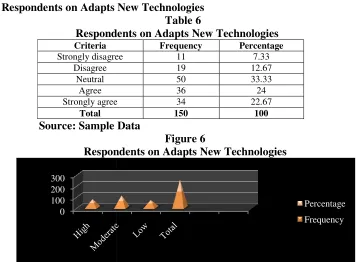
n Adapts New Technologies Table 6
Respondents on Adapts New Technologies
Frequency Percentage
Strongly disagree 11 7.33
19 12.67
50 33.33
36 24
Strongly agree 34 22.67
150 100
Source: Sample Data
Figure 6
Respondents on Adapts New Technologies
From the table it is inferred that 24% of respondent agree with the performance in this competency adapts new technologies is better than acceptable standard and 12% of respondent disagree
competency adapts new technologies is not up to acceptable and standard.
Takes Independent Actions and Calculated Risks Table 7
akes Independent Actions and Calculated Risks
Frequency Percentage
disagree 24 16
27 18
39 26
33 22
Strongly agree 27 18
150 100
Source: Sample Data
Figure 7
akes Independent Actions and Calculated Risks Percentage
Frequency
Frequency
Percentage Frequency
Percentage
Page 551 t agree with the performance in this standard and 14% of respondent disagree with the performance in this competency achieves established goals is not up to acceptable and standard.
From the table it is inferred that 24% of respondent agree with the performance in this competency adapts new technologies is better than acceptable standard and 12% of respondent disagree
competency adapts new technologies is not up to acceptable and standard. Percentage
Frequency
Frequency
ISSN : 2581-7175 ©IJSRED: All Rights are Reserved
Inference : From the table it is inferred that 22% of respondent agree with the performance in this competency calculated risks is better than acceptable standard and 18% of respondent disagree with the performance in this competency calculated risks is not up to acceptable and standard.
5.8 Showing Respondents Managing Conflict
Respondent Criteria High Moderate Low Total
Source: Sample Data
Respondent
Inference: From the table inferred that 30% of highly conflict in managing and 26% of lowly conflict in managing the employee.
5.9 Determining Chi-Square Test for Experience
H0: There is no significant association between experience of respondent and self development activities. H1: There is a significant association between experience of respondent and self development activities.
Chi-Square
Strongly Count
Disagree Excepted count
Count
Disagree Excepted count
Count
Self Neutral Excepted count
development activities
Count
Agree Excepted count
Strongly Count
Agree Excepted count
Count
Total Excepted count
Source: Sample Data 0 50 100 150
High Moderate
©IJSRED: All Rights are Reserved
inferred that 22% of respondent agree with the performance in this competency calculated risks is better than acceptable standard and 18% of respondent disagree with the performance in this competency calculated risks is not up to acceptable and standard.
Managing Conflict
Table 8
Respondents Managing Conflict
Frequency Percentage
45 30
65 43.33
40 26.67
150 100
Source: Sample Data
Figure 8
Respondents Managing Conflict
From the table inferred that 30% of highly conflict in managing and 26% of lowly conflict in
Square Test for Experience of Respondent and Self Development Activities There is no significant association between experience of respondent and self development activities.
significant association between experience of respondent and self development activities. Table 9
Square: Self Development Activities Experience
<5years 5-10years 10-15years
Count 4 10 11
Excepted count 4.5 10.5 10
Count 5 6 4
Excepted count 3.5 6.3 5.2
Count 11 20 19
Excepted count 9.8 18.8 21.4
Count 13 16 11
Excepted count 13.7 15.2 11.1
Count 12 6 2
Excepted count 11.1 6.6 2.3
Count 45 58 47
Excepted count 45 58 47
Moderate Low Total
Frequency
Percentage
Page 552 inferred that 22% of respondent agree with the performance in this competency calculated risks is better than acceptable standard and 18% of respondent disagree with the
From the table inferred that 30% of highly conflict in managing and 26% of lowly conflict in
Self Development Activities There is no significant association between experience of respondent and self development activities.
significant association between experience of respondent and self development activities.
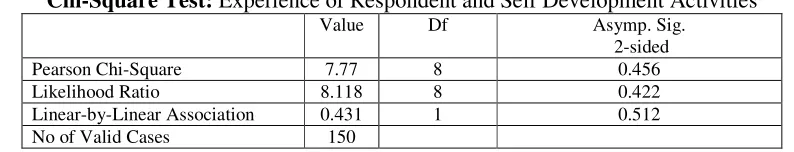
ISSN : 2581-7175 ©IJSRED: All Rights are Reserved Page 553 Table 10
Chi-Square Test: Experience of Respondent and Self Development Activities
Value Df Asymp. Sig.
2-sided
Pearson Chi-Square 7.77 8 0.456
Likelihood Ratio 8.118 8 0.422
Linear-by-Linear Association 0.431 1 0.512
No of Valid Cases 150
Source: Sample Data
Inference: The value of P is found to be 0.456(P>0.05) Hence H0 is accepted. There is no significant association between experience of respondent and self development activities.
5.10 ANOVA Test between the Departments, Motivation and Technical Skills
H0 (Null hypothesis): There is no significance association between the departments, motivation and technical skill.
H1 (Alternative hypothesis): There is significance association between the departments, motivation and technical skill.
Table 11
ANOVA test between the Departments, Motivation and Technical Skills
A B C D E
Departments 30 25 20 40 35
Motivation and politeness 15 25 57 33 20
Keeping technical skill up to date 23 31 36 38 22
Source: Sample Data
Table 12
ANOVA: Single Factor Summary
Count Sum Average Variance
3 68 22.66667 56.33333
3 81 27 12
3 113 37.66667 344.3333
3 111 37 13
3 77 25.66667 66.33333
Source: Sample Data
Table 13
ANOVA:Motivation and Technical Skills
Source of Variation SS Df MS F P-value F crit
Between Groups 568 4 142 1.443089 0.289926 3.47805
Within Groups 984 10 98.4
Total 1552 14
Source: Sample Data
From the table Anova value is 3.478 degree of freedom is 14 Anova Table Value for 95% level of interval is 3.093 Anova Value>Table Value
F = F cal>F tab F=3.478>3.093
Anova value is greater than the Table Value so H1 rejected and H0 Accepted.
Inference: The calculated value of F is greater than the tabulated value. Hence, we reject the alternative hypothesis and conclude that there is no significance difference in departments, motivation and technical skill.
ISSN : 2581-7175 ©IJSRED: All Rights are Reserved Page 554 H1 (Alternative hypothesis): There is significance association between the departments, adapts new technology and update technology.
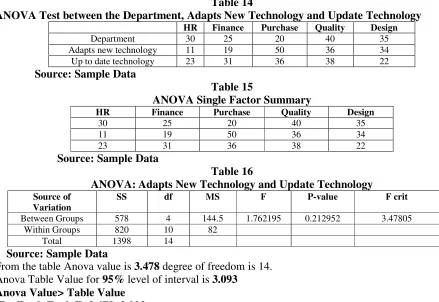
Table 14
ANOVA Test between the Department, Adapts New Technology and Update Technology
HR Finance Purchase Quality Design
Department 30 25 20 40 35
Adapts new technology 11 19 50 36 34
Up to date technology 23 31 36 38 22
Source: Sample Data
Table 15
ANOVA Single Factor Summary
HR Finance Purchase Quality Design
30 25 20 40 35
11 19 50 36 34
23 31 36 38 22
Source: Sample Data
Table 16
ANOVA:Adapts New Technology and Update Technology
Source of Variation
SS df MS F P-value F crit
Between Groups 578 4 144.5 1.762195 0.212952 3.47805
Within Groups 820 10 82
Total 1398 14
Source: Sample Data
From the table Anova value is 3.478 degree of freedom is 14.
Anova Table Value for 95% level of interval is 3.093
Anova Value> Table Value F = F cal>F tab F=3.478>3.093
Anova value is greater than the Table Value so H1 rejected and H0 Accepted.
Inference The calculated value of F is greater than the tabulated value. Hence, we reject the alternative hypothesis and conclude that there is no significance difference in departments, update technology and adapt technology.
5.12 Determining Correlation Between the About Their Motivation and Politeness and Under Takes Self Development Activities
H0 (Null hypothesis): There is no significant association between about their motivation and politeness and under takes self development activities.
H1 (Alternative hypothesis): There is a significant association between about their motivation and politeness and under takes self development activities.
Table 17
Motivation and Politeness and Under Takes Self Development Activities
About their motivation and politeness 15 25 57 33 20
Under takes self development activities 25 15 50 40 20
Source: Sample Data
r =0.852688
ISSN : 2581-7175 ©IJSRED: All Rights are Reserved Page 555 5.13 Determining Regression for Adapts New Technology and Update Technology
H0 (Null hypothesis): There is no significant association between adapts new technology and update new technology.
H1 (Alternative hypothesis): There is significant association between adapts new technology and update new technology.
Table 18
Determining Regression for Adapts New Technology and Update Technology
Adapts new technology 11 19 50 36 34
Update technology 23 31 36 38 22
Source: Sample Data
Table 19 Regression Statistics
Table 20
ANOVA: Adapt New Technology and Update Technology
Df SS MS F Significance F
Regression 1 17.43773 17.43773 0.257741 0.662126
Residual 2 135.3123 67.65614
Total 3 152.75
Source: Sample Data
Regression value is: 0.257741 Value is positive so H1 is accepted.
Interpretation: There is significant between adapt new technology and update technology.
6. Conclusion
From the above analysis it has been suggested that the company should take up various strategies to progress the problem solving skills of employees, and to conduct entertainment programs, learning seminars and e-learning programs to improve and to reduce the stress. To improve competencies of employee’s performance based bonuses, and to revise the performance appraisal system to incorporate the result of skill
analysis and employee job role assessment. , apprenticeship training program can be provided. The analysis
of primary data also reveal that an organization can use outfit for competency mapping, which is extremely useful to grow the employees. The precious resource of the organization is the employee. The performance of the employee is honestly associated with the success or failure of the organization. Therefore, it is essential for the organizations to spend giant amount of money on the development the employees. The success of every organization depends on its employees, so competency mapping plays a vital role for success of organisational and employee.
7. References
1. Bernardin, HJ, Dahmus, SA & Redmon, G (1999). Attitudes of First-Line Supervisors toward
Subordinate Appraisals, Human Resource Management, vol.32 (2/3), pp.315-325.
Regression Statistics
Multiple R 0.337874
R Square 0.114159
Adjusted R Square -0.32876
Standard Error 8.225335
Observations 4
ISSN : 2581-7175 ©IJSRED: All Rights are Reserved Page 556
2. Butler, B (2006). A pilot study of essential competencies as perceived by multi-unit operations and
human resources leaders in the restaurant industry (Master Dissertation). University of Edmond, Oklahoma, pp. 19-35.
3. Chong, E (2011). Managerial Competencies and Career Advancement, a Comparative Study of
Managers in Two Countries, Journal of Business Research.
4. Chouhan, V. S., & Srivastava, S. (2012). Competencies and Competency Models, Development
and Applications.
5. Donna Rodriguez et.al (2002). Developing Competency models to promote integrated Human
resource practices, Human resource management, Volume 41 pp. 309-324.
6. Donna Rodriguez et.al (2002). Developing Competency models to promote integrated Human
resource practices, Human resource management, Volume 41 Pp. 309-324.
7. Ghirmai T. Keleam (2010). “Knowledge-based economy and society has become a vital
commodity, to countries” International NGO Journal Volume 5(7) Pp. 160-166.
8. Grady Winfield Alree (2003). Identify how Career development could benefit the Regional
Fire-Rescue Training Coordinators of North Caroline Community College system. Pp. 1-22.
9. International Journal of Research in Management, Economics and Commerce, 2(11), 575-583
10.Jain, V. K. (2013). Competency Mapping in Indian Industries, a Case Study. International Journal
of Emerging Research in Management &Technology, 2(10). ISSN: 2278–9359
11.Kaur, J., & Kumar, A. (2013). Competency Mapping: A Gap Analysis. International Journal of
Education and Research, 1(1)