© Central Fisheries Research Institute (CFRI) Trabzon, Turkey and Japan International Cooperation Agency (JICA)
Effects of Stocking Density on Growth Performance, Survival and Food
Conversion Ratio of Turbot (
Psetta maxima
) in the Net Cages on the
Southeastern Coast of the Black Sea
Introduction
Turbot is a marine demarsal carnivorous and bottom feeding flatfish species and naturally present from North Africa to the North Atlantic up to Norway including Baltic, Mediterranean and Black Sea (Amaoka et al., 2001; Suzuki et al., 2004). However
little information is available on the Black Sea turbot
Psetta maxima (Scophthalmus maeoticus), which is an
endemic subspecies and a new candidate for aquaculture in Black Sea countries (Moteki et al.,
2001; Sahin, 2001; Yigit et al., 2003; Türker et al.,
2005; Yigit et al., 2006)
Turbot culture has developed rapidly in the last two decades, growing from 4 mt in 1984 to 6748 mt in 2003 in Europe. In China and Chile, turbot production is estimated to be 3000 mt and 350 mt, respectively (FAO, 2004). The main production systems for turbot are land-based recirculation systems for juveniles and on-growing. Tank volumes can differ according to the farm and depend on the holding system in use (ICES, 2006). Capital and operating costs are also high in comparison with cage farming systems. It takes about 36 months for turbot to grow from 2 g to 2 kg if water temperature is maintained between 14 to 18°C (FAO, 2004).
Many different culture systems, including sea cages, recirculation systems, partly recirculated flow-through systems were developed and adapted for turbot production, in order to enhance production efficiency and decrease production cost (Arnaiz, 1994). Site selection for cages is easier than that of
landbased systems although wave action can be a problem for turbot (Person-Le Ruyet, 2002). The cages can be protected from waves but not from the strong currents which disturb the bottom of the cages. In both cases, the turbot are stressed with erratic movements and substantial fin erosion (Arnaiz, 1994).
Onshore flow-through systems are the main culture systems, but trials were also carried out with cage and recirculation systems (Person-Le Ruyet, 2002). Turbot fry with total length of 6 cm to 10 cm and body weight of 10-30 g were cultured for five months in sea cages; at the end of the study period, the average body weight reached about 400 g. That result would provide a scientific basis for the turbot culture in net cages (Yongqiang et al., 1998).
Environmental variables, farming conditions and food availability are the main factors that affect fish growth. There are a few studies that provide information on the growth of turbot in the Black Sea. Person-Le Ruyet et al. (1981) studied the growth of
turbot in the Mediterranean Sea, while Danielsen and Gulbransen (1980) compared growth of turbot with sole in tank conditions in Norway. Øiestad (1999) studied growth in raceways and Suziki et al. (2001)
examined the relationships between growth, length and age of turbot caught from the Black Sea.
In terms of the fish production in cages, stocking density, which is related to the volume of water or surface area per fish is an important factor. Increase in stocking density results in increasing stress, which leads to higher energy requirements, causing a reduction in growth rate and food utilization.
Abstract
Black sea turbot (Psetta maxima) were reared at four different densities in the sea cages to evaluate the effects of stocking density on growth, survival rate and food conversion ratio. Fish (mean weight, 41 g; N: 900) were stocked in four different densities as 30, 60, 90 and 120 fish m-2 with three replicates and initial stock densities of 1.26±0.069, 2.44±0.022, 3.69±0.016 and 4.87±0.081 kg m-2 respectively. The growth trial lasted for 206 days from October 2000 to June 2001. Bulk and individual weights of fish in each cage were recorded monthly. The final mean weights (±s.e.) of the fish stocked at densities of 30, 60, 90 and 120 fish m-2 reached 178.3±6.53, 182.7±6.02, 186.1±8.22 and 164.6±8.12 g. Growth rate was fast up to 90 fish m-2and dropped after these. The corresponding SGR values were 0.70, 0.72, 0.73 and 0.68 % day–1 at temperatures ranging between 8 and 22°C and salinity of 17-18 ppm. The feed conversion ratios were estimated as 1.95, 1.85, 2.09 and 1.88, and cumulative survival rates were calculated as 78.0, 90.0, 75.0 and 65.3% respectively. The results revealed that stocking density had a significant effect on growth and survival rates of turbot. Fish held at the highest density exhibited lowest growth rate and survival rates.
Key words: Turbot, stocking density, net cage, Black Sea.
Nilgün Aksungur1,*, Muharrem Aksungur1, Bilal Akbulut1, İlyas Kutlu1
1 Central Fisheries Research Institute, Kaşüstü, Yomra, 61029 Trabzon, Turkey.
* Corresponding Author: Tel.: +90. 462 341 10 53; Fax: +90. 462 341 10 56; E-mail: [email protected]
Contrarily, in case of low stocking densities fish may not form shoals and feel comfortable. Consequently, identifying the optimum stocking density for a species is a critical factor not only for designing an efficient culture system (Leatherland and Cho, 1985), but also for optimum husbandry practices. Controlling the fish size and production are the two important tasks to meet the market demands, but increase in stocking density to produce more fish which increases fish intensification may not be the best way of dealing with problem of space shortage.
In many cultured fish species, growth is inversely related to stocking density and this is mainly attributed to social interactions (Holm et al., 1990;
Haylor, 1991; Bjørnsson, 1994; Huang and Chiu, 1997; Irwin et al., 1999; Ma et al., 2006). Social
interactions through competition for food and/or space can negatively affect fish growth. On the other hand, the price of fish is determined by the market demand of supply (size and production), that in turn depends on their growth. Papst et al. (1992) suggested
that in intensive aquaculture the stocking density is an important indicator that determines the economic viability of the production system.
The present study focuses on growth of turbot reared in net cages in ambient temperatures of the coastal waters of the Black Sea, Turkey. The objective of the study was to evaluate the effects of different stocking densities on growth performance, survival rate and feed utilization of turbot.
Material and Methods
The study was conducted at the Central Fisheries Research Institute, Trabzon, Turkey. Fish were obtained from Turbot Hatchery prompted by Japan International Cooperation Agency (JICA) and transferred to net cages located at Yomra Fishing Harbour. Net cage was designed enabling turbot resting on the bottom. The basic floating part of the cage was 1x1 m in dimensions and bottom of the net with 16 mm in mesh size was stretched with a chrome pipe frame 1x1 m in dimensions. Top of the cage was covered with a black brand to protect fish from intense light.
Juvenile turbot (41 g; N = 900) were reared in four different (30, 60, 90 and 120 fish m-2) stocking
density groups of 1.26±0.069, 2.44±0.022, 3.69±0.016 and 4.87±0.081 kg m-2 respectively, with
three replicates. The experiment lasted for 206 days from October, 2000 to June, 2001.
The fish were fed twice a day on a commercial pelleted fish feed (crude protein 47%, lipid 13%, crude cellulose 3%, ash 13% and water 11%) ad libitium. Fish were randomly sampled and measured
every month, from about 210 days up to 410 days of age after hatching. They were measured (to the nearest mm total length) and weighed (to the nearest 0.01 g.) after gently blotting with a towel. Water
temperature was also recorded three times a day and cage net was changed monthly. Environmental parameters including, pH, oxygen saturation (%) and salinity (‰) were measured once per week.
Specific growth rate (SGR) and food conversion ratio (FCR) were calculated as follows:
SGR = 100[ln(Wt)-ln(W0)/t]
FCR = (Σƒk)/(Wt-W0)+m;
where, t: feeding days, W0: initial live weight of
fish (g), Wt: final live weight (g) and Σƒk: weight of
feed supplied to the group during that period (g), m: weight of dead fish (g). Data were represented as arithmetic means of individual weight (±SE). Daily mortalities were noted and survival rates were calculated as mean and cumulative values.
The differences including stock density, SGR, FCR and survival rates among groups were analyzed with one-way analyses of variance (ANOVA) and Duncan’s multiple range tests with STATISTICA computer program (p≤0.05).
Results
The study was carried out from October, 2000 to June, 2001 under pilot scale cage culture conditions. Water quality parameters (temperature, pH, salinity and dissolved oxygen) are given in Figure 1. The salinity was quite stable around 17 and 18 ppm. Water temperature ranged between 8-22°C and the lowest temperatures occurred in January, February and March. The highest growth occurred in October and November, and also April and May, when the water temperature increased from 10 to 22°C. In contrast, the lowest growth occurred in January, February and March when the temperature decreased below 10°C.
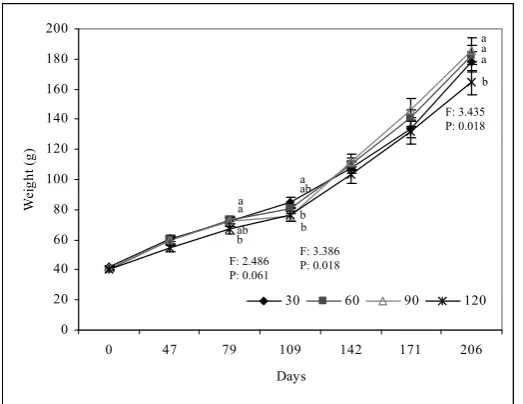
Initial and final body weights and lengths, specific growth rates, food conversion ratios, and survival rates are presented in (Table 1; Figures 2 and 3). The final weights of the fish stocked at a density of 30, 60 and 90 fish m-2 reached mean weights (±s.e.)
of 178.3±6.53, 182.7±6.02 and 186.1±8.22 g, respectively, while those stocked at 120 fish m-2 had a
mean weight of 164.6±8.12 g. Final stock densities reached 4.38±0.065, 10.24±0.129, 13.68±0.121 and 15.41±0.188 kg m-2, respectively and growth
increased up to stocking density of 90 fish m-2 and
dropped at the density of 120 fish m-2. There were no
significant differences in weight between experimental groups at the beginning of the study and no significant differences were found between replicates of the groups over the course of the experiment. Hence data from replicates were pooled for each treatment prior to analysis. Statistically significant differences were found between the first 3 and the last group (120 fish m-2) in terms of final body
0 5 10 15 20 25
Nov Dec Jan Feb Mar Apr May Jun Months
T
em
per
at
ur
e(
ºC
)-Sa
lin
ite
(%
o)
-1 1 3 5 7 9 11
pH
-O
2
T emp (ºC) ‰S pH O2 (mg/L)
Figure 1. Changes in water temperature, salinity, pH and oxygen concentration recorded during the trial with turbot.
Table 1. Number of fish (N), initial and final body weights, specific growth rate (SGR), food conversion ratio (FCR), and survival of Black Sea turbot reared at different stocking densities
Groups
N 30 60 90 120
Initial Body Weight (g) 41.9±1.41 a (30.3-59.3)
40.7±1.26 a (29.1-56.67)
41.0±1.54 a (25.6-69.0)
40.6±1.33 a (25.3-67.2 Initial Stock Density (kg m-2) 1.26±0.069 a 2.44±0.022 b 3.69±0.016 c 4.87±0.081d Final Body Weight (g) 178.3±6.53 a
(111.0-270.7) 182.7±6.02 a
(130.0-255.7) 186.1±8.22 a
(102.7-303.7) 164.6±8.12 b (79.2-268.5)
SGR (%) 0.68±0.021 a 0.74±0.026 a 0.76±0.037 a 0.71±0.046 a
FCR 1.95±0.022 a 1.85±0.006 a 2.09±0.262 a 1.88±0.117 a
Final Stock Density (kg m-2) 4.38±0.065 a 10.24±0.129 b 13.68±0.121 c 15.41±0.188 d
Cumulative Survival Rate 78.0 a 90.0 a 75.0 b 65.3 b
Mean Survival Rate 95.6 a 98.5 a 94.4ba 89.4 b
Significant difference at 0.05 level.
0 20 40 60 80 100 120 140 160 180 200
0 47 79 109 142 171 206
Days
We
ig
ht
(
g)
30 60 90 120
Figure 2. Mean weight ±S.E.(g) of juvenile turbot held at four different stocking densities.
Different superscripts indicate statistically significant differences between means at P<0.05. Means were tested by ANOVA and ranked by Duncan’s multiple range test.
a a
ab b
a ab
b b
a a b a
F: 2.486 P: 0.061
F: 3.386 P: 0.018
0,0 0,2 0,4 0,6 0,8 1,0 1,2 1,4
0-47 47-79 79-109 109-142 142-171 171-206 0-206
Periods
Sp
es
if
ic
G
row
th
R
ate
(%
da
y
-1 )
30 60 90 120
Figure 3. Specific growth rate of turbot held at four different stocking density.
75 80 85 90 95 100 105
0 47 79 109 142 171 206
Days
Su
rv
iv
al
R
ate
(
%
)
30 60 90 120
Figure 4. Survival rate of turbot held at four different stocking densities.
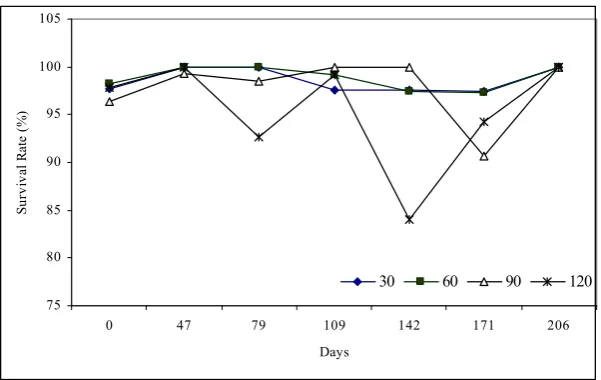
The feed conversion ratios were estimated as 1.95, 1.85, 2.09 and 1.88 respectively (Table 1). Mean survival rates in the groups were calculated as 95,6, 98,5, 94,4 and 89,4% respectively, while cumulative survival rates were 78.0, 90.0, 75.0 and 65.3% (Figure 4). Statistically significant differences (P<0.05) were not found between SGR and FCR values, but survival rates. Cumulative and mean survival rates of the last group (120 fish m-2) were significantly (P<0.05)
lower than those of other three groups.
Discussion
The optimum temperature for culturing turbot is about 16-18°C and growth rate is highly temperature-dependent (Person-Le Ruyet, 2002) and also the food demand of turbot increases with temperatures (Mallekh et al., 1998; Øiestad, 1999). For Norwegian
turbot, the optimal temperature ranges for growth were previously reported between 16 and 19°C for
individuals between 25 and 75 g (Imsland et al.,
1996) and between 16 and 20°C for French turbot between 35 and 140 g (Burel et al., 1996). Person-Le
Ruyet et al. (1991) recommended that turbot juveniles
of 40-60 g should be fed at 1.5-2.0 percent of body weight at 16- 18°C. Turbot can growth between 10 and 35 ppm and optimal salinity is 19-20 ppm for turbot.
In our study specific growth rates in groups ranged from 0.68 to 0.76 while water temperature was ranging between 8-22°C. Specific growth rates dropped below 1.0 when the temperature declined below 15°C. The current study shows that growth declined at temperatures below 15°C, which is in agreement with previous investigations (Person-Le Ruyet et al., 1991; Imsland et al., 1996; Burel et al.,
1996; Mallekh et al., 1998). The mean specific
growth rate of Atlantic turbot of 50-183 g has been reported as 0.9-1.6% (Nijhof, 1994) and 3.19, 3.30, 3.45, 3.34 and 3.09 (Ma et al., 2006), which is higher
a
b
b a
F: 9.476 P: 0.005 a
a
b a
than those obtained in the present study.
Turbot of around 100 g tolerate densities of up to 25 kg/m2, in a depth of less than 20 cm of water.
This density is achieved with the fish stacked in two or three layers. Mean densities maintained in rearing operations are around 30-40 kg/m2 (water depth about
1 m) and sometimes there is a supply of oxygen as a back-up to increase the security of the system (Anonymous, 2005). Irwin et al. (1999) studied the
effect of stocking density (0.7, 1.1, 1.5 and 1.8 kg m -2) on the growth of turbot, for 45 days, and found that
stocking density inversely affects growth rate and mean weight.
Initial biomass stocking densities used in this experiment ranged between 1.3 and 4.9 kg m-2,
similar to stocking densities used in several previous growth trials (Iglesias et al., 1987; Fernandez-Pato et al., 1990; Ma et al., 2006). In these trials, initial
stocking densities varied between 1.0 and 5.0 kg m-3.
Turbot can be reared at very high stocking densities, and in commercial operations stocking densities generally range from 25 to 30 kg m-3 (Iglesias
et al.,
1987) with a maximum reported sustainable density of 75 kg m-3 for large fish (Imsland
et al., 2003). The
ability of turbot to withstand conditions of very high stocking density may be related to their benthic habit, low levels of spontaneous activity and low oxygen requirements (Person-Le Ruyet et al., 1991).
However, such rearing conditions do not take into account behavioural interactions between individuals, which may unfavourably affect biomass gain.
In this study the turbot reared at the highest final stocking density of 15.4 kg m-2 showed significantly
slower growth rate than those held at lower stocking densities (Table 1), and significant differences in live weights were evident after 79 days. This supports the view that increasing stocking densities have a negative impact on growth rates of turbot stocks as observed by Irwin et al. (1999), particularly among
fish of smaller sizes. The percent cover of the tank bottom by fish in the highest density treatment group (149.3%) was more than twice that of the lowest density group (67.4%) where growth rates were significantly higher.
Studies on the effects of stocking density on the growth of fish show inverse relations for a range of species (Bjørnsson, 1994; Øiestad, 1999; Irwin et al.,
1999; Imsland et al., 2003). In some species,
however, a positive effect of density on growth is reported (Papst et al., 1992). Stocking density and
growth rates are often reported to be related, however, the relationships between the two may not be uniformly positively or negatively linear for a given species. Bjørnsson (1994) reported that stocking density affects the growth of halibut only above a certain threshold level corresponding to approximately 100% coverage of the tank bottom.
The feed conversion ratios were estimated between 1.85 and 2.09, respectively (Table 1). Devesa (1994) stated that the food conversion ratio ranges
from 0.9 to 1.9 for turbot fed on dry pellets. In present experiment, the food conversion ratios were significantly higher than the values reported by Devesa (1994) and parallel with values indicated by Sahin (2001). High FCR values can be attributed various factors including feed quality and feeding, temperature variations, rearing units and size of fish.
The mean survival rates of around 89.4%-98.5% in the present study were similar to those observed in earlier studies on juvenile turbot (Heap and Thorpe, 1987; Person-Le Ruyet et al., 1991;. Sunde et al.,
1998). The group with 60 fish showed the highest survival rate (Table 1; Figure 4). The survival rate declined significantly in last stocking density (P<0.05) probably due to high stocking rate and increasing temperature. Significant increment was also observed in mortality of the third group (90 fish m-2) between 171 and 206 days, although survival rate
of that group was very high until 171st day
In conclusion, the results of the present study demonstrate that increasing rearing density in juvenile turbot result in heterogeneous growth rates and the depression of growth of some individuals. In addition survival rates and feed conversion ratios deteriorate with increasing water temperature.
References
Anonymous, 2005. Larval Base Rearing Essay. Mini-essay about rearing of turbot, Scophthalmus maximus and common sole, Solea solea. http://filaman.ifm-geomar.de/LarvalBase/Reproduction/RearingEssay.cf m?eid=1
Arnaiz, R. 1994. Diversification in the turbot industry. In: P. Lavens and R.A.M. Remmerswaal (Eds.). Turbot Culture Problems and Prospects. Spec. Publ. 22, European Aquaculture Society. Gent, Belgium: 166-181.
Amaoka, K., Yoseda, K., Şahin, T., Üstündag, C. and Çiftçi, Y. 2001. Flatfishes (Order Pleuronectiformes) found in Black Sea and its adjacent waters. Special publication No.1, Central Fisheries Research Institute, Ministry of Agriculture and Rural Affairs, Trabzon, 27 pp.
Bjørnsson, B. 1994. Effects of stocking density on growth rate of Halibut Hippoglossus hippoglossus L. reared in large circular tanks for three years. Aquaculture, 123: 259–270.
Chen, J., Xu, H., Chen, Z. and Wang Yu, T. 2005. Marine Fish Cage Culture in China. (April 2006) http://library.enaca.org/NACA-Publications/
MaricultureWorkshop/MaricultureWS2006_China.pdf Danielssen, D.S. and Gulbrandsen, K.E. 1989. Growth of turbot (Scophtalmus maximus L.) and sole (Solea solea L.) based on dry pellets. In: N. De Pauw et al., (Eds.), Aquaculture: a biotechnology in progress. 631-637.
Devesa, S. 1994. Nutrition and feeding of cultured turbot (Scophthalmus maximus L.) In: P. Lavens and R.A.M. Remmerswaal (Eds.), Turbot Culture Problems and Prospects. Spec. Publ. 22, European Aquaculture Society, Gent: 81-92.
static?dom=culturespecies &xml=Psetta_maxima.xml Fernandez-Pato, C.A., Martinez-Tapia, C., Chereguini, O.
and Sola, E. 1990. Growth of turbot (Scophtalmus maximus L. from 1 to 3,000 g in the north of Spain. ICES C.M. F: 29, 14 pp.
Haylor, G.S. 1991. Controlled hatchery production of Clarias gariepinus (Burchell 1922): growth and survival of fry at high stocking density. Aquacult. Fish. Manag., 22: 405-422.
Heap, S.P. and Thorpe, J.P. 1987. A preliminary study of comparative growth rates in 0–group malpigmented and normally pigmented turbot, Scophthalmus maximus (L.), and turbot–brill hybrids, S. maximus ´ S. rhombus (L.), at two temperatures. Aquaculture, 60: 251–264.
Holm, J.C., Refstie, T. and Bo, S. 1990. The effect of fish density and feeding regimes on individual growth rate and mortain rainbow trout (Oncorhynchus mykiss). Aquaculture, 89: 3-4.
Huang, W.B. and Chiu, T.S. 1997. Effects of stocking density on survival, growth, size variation, and production of Tilapia fry. Aquaculture Res., 28: 165-173.
ICES. 2006. Report of the Working Group on Environmental Interactions of Mariculture, (WGEIM), ICES CM 2006/MCC: 03. 24-28 April 2006, Narragansett, Rhode Island, USA, 195 pp. Iglesias, J., Olmedo, M., Otero, J.J., Peleteiro, J.B. and
Solorzano, M.R. 1987. Growth, under laboratory conditions, of turbot, Scophthalmus maximus, from the Ria de Vigo,. Mar. Biol., 96: 11-17,
Imsland, A.K., Sunde, L.M., Folkvord, A. and Stefansson, S.O. 1996. The interaction of temperature and fish size on growth of juvenile turbot. J. Fish Biol., 49: 926-940.
Imsland, A.K., Foss, A., Conceicao, L.E.C., Dinis, M.T., Delbare, D., Schram, E., Kamstra, A., Rema, P. and White, P. 2003. A review of the culture potential of Solea solea and S. senegalensis. Reviews in Fish Biology and Fisheries, 13: 379–407.
Irwin, S., Halloran, J.O. and FitzGerald, R.O. 1999. Stocking density, growth and growth variation in juvenile turbot (Scophthalmus maximus). Aquaculture, 178: 77-88.
Leatherland, J.F. and Cho, C.Y. 1985. Effect of rearing density on thyroid and interrenal gland activity and plasma and hepatic metabolite levels in rainbow trout, Salmo gairdneri Richardson. Journal of Fish Biology, 27: 583-592.
Ma, A., Chen, C., Lei, J., Chen, S., Zhuang, Z. and Wang, Y. 2006. Turbot Scophthalmus maximus: stocking density on growth, pigmentation and feed conversion. (Abstract) Chinese J. of Oceanology and Limnology, 24(3): 307-312
Mallekh, R., Lagardere, J.P., Begout Anras, M.L. and Lafaye, J.Y. 1998. Variability in appetite of turbot, Scophthalmus maximus under intensive rearing conditions; the rol of environmental factors. Aquaculture, 165: 123-138.
Martines-Tapia, C. and Fernandez-Pato, C.A. 1991. Influence of stock density on turbot (Scophthalmus maximus. L.) growth. ICES CM199 / F:20.
Moteki, M., Yoseda, K., Sahin, T., Ustundag, C. and Kohno, H. 2001. Transition from endogenous to exogenous nutritional sources in larval Black Sea turbot Psetta maxima. Fish. Sci., 67: 571-578. Nijhof, M. 1994. Research on nutrition and growth in the
culture of post larval turbot (Scophthalmus maximus L.). In: P. Lavens, and R.A.M. Remmerswaal (Eds.), Turbot Culture Problems and Prospects, Spec. Publ. 22, European Aquaculture Society, Gent: 137-165 Person-Le Ruyet, J., L’elchat, D. and Nodelec, G. 1981.
Research on rearing turbot (Scophtalmus maximus L.), Result and Perspectives, J. World Marine Soc., 2: 143-153.
Person-Le Ruyet, J., Baudin-Laurencin, F., Devauchelle, N., Métailler, R., Nicolas, J.L., Robin, J. and Guillaume, J. 1991. Culture of Turbot (Scophthalmus maximus). In: J.P. McVey (Ed.), CRC Handbook of Mariculture Volume II Finfish Aquaculture, Boston: 21-41. Person-Le Ruyet, J. 2002. Turbot (Scophthalmus maximus)
Grow-out in Europe: Practices, Results and Prospects. Turkish J. of Fisheries and Aquatic Scien., 2: 29-39. Purdom, C.E., Jones, A. and Lincoln, R.F. 1972. Cultivation
trials with turbot (Scophthalmus maximus). Aquaculture, 1: 213–230.
Øiestad, V. 1999. Shallow raceways as a compact resource-maximizing farming procedure for marine fish species. Aquaculture, 30: 831 - 840.
Sahin, T. 2001. Larval rearing of the Black Sea turbot, Scophthalmus maximus (Linnaeus, 1758), under laboratory conditions. Turk. J. Zool., 25: 447-452. Sunde, L.M., Imsland, A.K, Folkvord, A. and Stefansson,
S.O. 1998. Effects of size grading on growth and survival of juvenile turbot at two temperatures. Aquaculture International, 6: 19–32.
Suziki, N., Kondo, M., Güneş, E., Özongun, M. and Ohno, A. 2001. Age and growth of turbot Psetta maxima in the Black Sea, Turkey. Turkish J. of Fisheries and Aquatic Sciences, 1(1): 43-53.
Suzuki, N., Nishida, M., Yoseda, K., Üstündağ, C., Sahin, T. and Amaoka, K. 2004. Phylogeographic relationships within the Mediterranean turbot inferred by mitochondrial DNA haplotype variation. J. of Fish Biology, 65: 580–585.
Türker, A., Yigit, M., Ergün, S., Karaali, B. and Erteken, A. 2005. Potential of Poultry By-Product Meal as a Substitute for Fishmeal in Diets for Black Sea Turbot Scophthalmus maeoticus: Growth and Nutrient Utilization in Winter, Israeli J. Aquaculture, 57(1): 49-61.
Yongqiang, F., Youzhu, W., Yao, Y. and Lan, C. 1998. Introductive domestication and culture of turbot in Xiamen. (Abstract). J. of Oceanography in Taiwan Strait/Taiwan Haixia. Xiamen., 20(3): 356-362. Yigit, M., Koshio, S., Aral, O., Karaali, B. and Karayücel,
S. 2003. Ammonia Nitrogen Excretion Rate - An Index for Evaluating Protein Quality of Three Feed Fishes for the Black Sea Turbot, Israeli J. Aquaculture, 55(1): 69-76.