DOI: 10.7324/JAPS.2018.8913 ISSN 2231-3354
© 2018 Elvi Rahmayuni et al. This is an open access article distributed under the terms of the Creative Commons Attribution License -NonCommercial- ShareAlikeUnported License (http://creativecommons.org/licenses/by-nc-sa/3.0/).
*Corresponding Author
Harmita Harmita, Faculty of Pharmacy, Universitas Indonesia, Kampus UI Depok, West Java 16412, Indonesia. E-mail: igakadeharmita @ gmail.com
Development and Validation Method for Simultaneous Analysis of
Retinoic Acid, Hydroquinone and Corticosteroid in Cream Formula
by High-Performance Liquid Chromatography
Faculty of Pharmacy, Universitas Indonesia, Kampus UI Depok, West Java 16412, Indonesia.
ARTICLE INFO ABSTRACT
Article history: Received on: 08/05/2018 Accepted on: 21/08/2018 Available online: 30/09/2018
A simple, precise and rapid reverse phase HPLC-PDA method has been developed and validated for the simultaneous analysis of hydroquinone (HYQ), dexamethasone (DEX), triamcinolone acetonide (TSA), hydrocortisone acetate (HYA), betamethasone valerate (BEV) and retinoic acid (REA) in the cream dosage form. The mixture of HYQ, DEX, TSA, HYA, BEV and REA was separated on Waters X Bridge C18 5 μm column (4.6 mm × 250 mm). All separations were performed with a 2998 Photodiode Array (PDA) detector on 210-400 nm wavelength, 400C at column temperature and flow rate at 1.2 ml/min. The mobile phase was acetonitrile (ACN): 0.1% formic acid with gradient system. The retention times of HYQ, DEX, TSA, HYA, BEV, and REA were found to be 3.69; 9.13; 9.47; 9.96; 14.92 and 21.20. The method showed good linearity with correlation coefficient 0.9990; 0.9991; 0.9984; 0.9991; 0.9997 and 0.9991 over the range of 25-150 µg/ml for HYQ, DEX, TSA, HYA, BEV and REA, respectively. The method was mean recoveries in the range of 99.05 to 100.96% for all analytes. The developed method can be used in the routine analysis of HYQ, DEX, TSA, HYA, BEV and REA in the cream formula, as well as for qualitative interest in cosmetic preparations or for quantitative interest in drug preparations.
Key words:
Cream, Hydroquinone, Retinoic acid,
Corticosteroid, Validation, HPLC.
INTRODUCTION
Hydroquinone (1,4-dihydroxybenzene) is the first line agent in medical therapy of hyperpigmentation. It decreases melanocyte pigment production by inhibiting the conversion of DOPA to melanin through inhibition of the enzyme tyrosinase. Other mechanisms include inhibition of DNA and RNA synthesis, degradation of melanosomes, and destruction of melanocytes. Adverse effects may include dermatitis and ochronosis (Laurence
et al., 2011; Charlene, 2014).
Retinoic acid is the organic acid derives from vitamin A and it is also known as all-trans retinoic acid. It is a drug commonly used to treat acne vulgaris. Acne vulgaris is a common dermatologic problem which could be treated with systemic or topical drugs. More importantly, the combination therapy of
topical retinoic acid is more beneficial for the treatment of mild to moderate stages of acne vulgaris (Laurence et al., 2011; Deswal
et al., 2017).
Corticosteroids are highly effective drugs which are used to treat inflammatory skin conditions such as eczema and psoriasis. Side effects of corticosteroids for long-term use including pustular psoriasis, permanent skin atrophy and systemic effects such as hypertension, contact dermatitis, and diabetes. Depigmentation is a side effect of topical steroids, corticosteroids might be used as whitening agents in the topical medical preparations illegally sold as cosmetics. Their absorption through the skin can cause adrenal suppression or even Cushing’s syndrome. Local side effects of topical corticosteroidsinclude spread and worsening of untreated infection; irreversiblethinning of the skin, dermatitis, acne, and hypertrichosis (Laurence et al., 2011; Desmedt et al., 2014).
(ACM 001, 2005), simultaneous analysis of hydrocortisone acetate, dexamethasone, betamethasone, betamethasone 17 valerate and triamcinolone acetonide (ACM MAL 07, 2005), simultaneous analysis of hydroquinone and retinoic acid (Aung Myo Htet et al., 2016), simultaneous analysis of hydroquinone, retinoic acid and mometasone furoate (Sheliya et al., 2014) and simultaneous analysis of hydroquinone, ethers hydroquinone and corticosteroids (Gimeno et al., 2016). From the literature survey, there is no analysis method developed for the simultaneous analysis of HYQ, DEX, TSA, HYA, BEV, and REA in cream. Based on fact that these six components are required to be tested in cream cosmetic preparations, especially in facial skin lightening creams, this method also can later be used for the determination levels in preparation of drug creams. Thus, this study aimed to develop fast, simple, inexpensive, sensitive and validated a new high-performance liquid chromatography (HPLC) method for determination of HYQ, DEX, TSA, HYA, BEV and REA simultaneously in cream. The proposed method was validated with validation parameters, which are specificity, linearity, limit
of detection (LOD) and limit of quantification (LOQ), precision, accuracy and in accordance with USP guidelines (USP 40, 2016), and later used to analyze cream whether as cosmetic preparation or medicinal preparation.
EXPERIMENTAL
Materials
The reference standard of HYQ, DEX, TSA, HYA, BEV, and REA were kindly gifted by Indonesia National Agency of Drug and Food Control. The chemical structures in Figure 1. Commercial HYQ, TSA, HYA, BEV and REA topical cream were purchased from local market in Indonesia, methanol grade for liquid chromatography (Merck), acetonitrile grade for liquid chromatography (Merck). Formic acid 98-100% pro analysis (Merck), double distilled water used in the experiment was WIDA WI UNICAP 1000 ml (Widatra Bhakti, Indonesia). Cream base oil-in-water purchased from PT. Ikapharmindo Putramas Jakarta, Indonesia.
Fig. 1: Chemical structures of (a) Retinoic acid, (b) Hydroquinone, (c) Dexamethasone, (d) Betamethasone valerate, (e) Triamcinolone acetonide, (f) Hydrocortisone acetate.
Instrumentation and chromatographic conditions
All separations were performed on the HPLC Waters Alliance e2695 with Waters 2998 photo array (PDA) detector. The data were acquired and analyzed using Empower 3 software. Chromatographic separation was carried out on Waters X Bridge C18 5 μm column (4.6 mm × 250 mm). The component of the mobile phase used for gradient elution was ACN: 0.1% formic acid solution. Before use, the mobile phase was filtered through 0.45 μm membrane filter and degassed by ultrasonication. The flow rate was maintained at 1.2 mL/ min with a column temperature of 40°C. The injection volume was 20 μL, and detection was performed at 210-400 nm using a PDA detector.
Preparation of standard stock solutions
The standard stock solutions of HYQ, DEX, TSA, HYA, BEV, and REA were prepared by accurately weighing 25 mg of each into a 50 ml volumetric flask. The drugs were dissolved in
methanol and the solution was diluted to volume. Further dilutions were made from this stock solution become 25, 50, 75, 100, 125 and 150 µg/ml.
Preparation of spike stock solutions
An aliquot (500 mg) of the matrices (cream base oil in water) were weighed into 15 ml tubes and spiked with 5 ml standard stock solution and get 6 concentration of spike solution 25, 50, 75, 100, 125, 150 µg/ml respectively.
Method validation Specificity
Linearity and range
Determining linearity, calibration curves were plotted over a concentration range of 25-150 μg/mL for HYQ, DEX, TSA, HYA, BEV and REA respectively. A 20 μL of sample solution was injected into the chromatographic system. Chromatograms were recorded. All measurements were repeated three times for each concentration and calibration curve was constructed by plotting the peak areas of analyte versus the corresponding drug concentration. Vxo ≤ 5.0 and R-value (≥ 0.999) confirmed the good linearity of the method.
Limits of detection and quantification
Using a sample from linearity parameter, the limit of detection (LOD) and limit of quantification (LOQ) were calculated with the formula. The value was calculated from the standard deviation (SD) of response and the slope of the curve (S) by means of the equations: LOD = 3.3 (SD/S) and LOQ = 10 (SD/S), where SD: standard deviation of the detector response; S: slope of the calibration curve.
Precision
The precision of the proposed method was assessed by preparing three different sample solutions at low, medium, and high concentrations, which were freshly prepared and analyzed. The precision % relative standard deviation (% RSD) was assessed by analyzing standard drug solutions within the calibration range. The precision of the method was expressed as RSD % and Horwitz value.
Accuracy
Accuracy was calculated as the difference between theoretical added amount and the practically achieved amount. To check the degree of accuracy of the method, recovery studies were performed in triplicate by standard addition method at
50%, 100%, and 150%. The known amount of standard HYQ, DEX, TSA, HYA, BEV, and REA were added to pre-analyzed samples and were subjected to the proposed method (Petrova et al., 2013).
Analysis of marketed formulation
The validated method, used for testing cream samples on the market. The sample used in this test is a drug cream, which is; HYQ 2 %, DEX not tested, TSA 0.1 %, HYA 1%, BEV 0.1%, and REA 0.1%. A portion of the cream was weighed about 500 mg into the appropriate tube for getting 100 µg/ml concentration. The sample extracted with methanol with the aid of ultrasonication for 15 minutes, then filtered using 0.45 µm PTFE filter.
RESULT AND DISCUSSION
Optimization of procedures
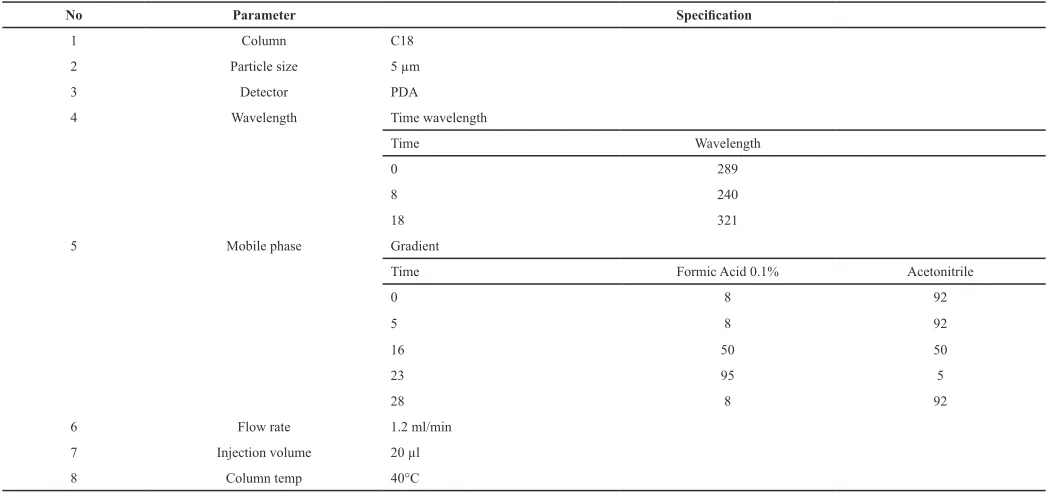
The HPLC procedure was optimized for simultaneous determination of HYQ, DEX, TSA, HYA, BEV and REA. Good resolution of both components was obtained with the gradient system 0.1% formic acid in water as solvent A and Acetonitrile as solvent B. The gradient was, in 0 min 8% A, 5 min 8% A, 16 min 50% A, 23 min 95% A, 28 min 8% A, and then return to initial condition. The flow rate of 1.2 mL/minutes was optimum, with oven temperature 40°C. Using PDA detector the chromatograms was read with Waters Empower 3 Chromatography software by using time wavelength procedure. HYQ were read at 289 nm, corticosteroid DEX, TSA, HYA and BEV were read at 240 nm, and REA was read at 321 nm. The six component already read on their optimum wavelength (Table 1). The system suitability parameters for HPLC chromatogram are as follows (Table 2). The average retention times for HYQ, DEX, TSA, HYA, BEV and REA was found to be 3.693; 9.130; 9.470; 9.964; 14.919 and 21.202 respectively (Figure 2).
Table 1: The Final optimized condition for the analysis.
No Parameter Specification
1 Column C18
2 Particle size 5 µm
3 Detector PDA
4 Wavelength Time wavelength
Time Wavelength
0 289
8 240
18 321
5 Mobile phase Gradient
Time Formic Acid 0.1% Acetonitrile
0 8 92
5 8 92
16 50 50
23 95 5
28 8 92
6 Flow rate 1.2 ml/min
7 Injection volume 20 µl
Table 2: System suitability parameters.
System Suitability Parameters HQ DM TA HA BV RA Limits
Retention time 3.697 9.130 9.47 9.964 14.919 21.202
-Resolution - 25.3039 3.2606 4.2133 23.3667 29.7337 >2
Tailing 0.807 1.248 1.352 1.222 1.273 1.229 <2
Plate Count 1950 132392 112438 99335 37808 5286214 >1000
Fig. 2: Chromatogram of hydroquinone, dexamethasone, triamcinolone acetonide, hydrocortisone acetate, betametasone valerate and retinoic acid (reference standard).
Specificity
This HPLC method was specified, determined by complete separation of HYQ, DEX, TSA, HYA, BEV and REA without any interference of excipients peak with analyte peaks (Figure 2, Figure 3). The resolution (R), tailing factor (TF) and Plate Count (PC) parameters of each peak meet the requirement. It was less than 2 for TF, more than 2 for R and more than 1000 for PC (Table 2). Beside that the purity plot shows that the six component was pure (Figure 4).
Fig. 3: Chromatogram of hydroquinone, dexamethasone, triamcinolone acetonide, hydrocortisone acetate, betametasone valerate and retinoic acid reference standard in cream bases oil in water.
Linearity and range
From the calculation were got that Vxo of each component ≤ 5.0, and R value ≥ 0.999 confirmed the good linearity of the method (Table 3). Linear regression data for the calibration plots revealed good linear relationships between response and concentration. The linear regression equations were Y = 17766.04X + 19823.77 (r = 0.9990) for HYQ, Y = 26943.51X + 98029.48 (r = 0.9991) for DEX, Y = 23602.22X + 256560.22 (r
= 0.9984) for TSA, Y = 28540.38X + 39937.17 (r = 0.9991) for HYA, Y = 21217.47X + 290070.95 (r = 0.9997) for BEV, and Y = 41552.68X + 298920.30 (r = 0.9991) for REA (Table 5).
Table 3: Specificity, Range, LOD and LOQ parameters.
No Parameter HQ DM TA HA BV RA Limits
1 Specificity No interference of excipients peak with analyte peaks
2 Range
- Linearity
range 25-150 µg/ml - Target
concentration 100 µg/ml
- Vxo 1.670 1.545 2.051 1.576 0.935 1.526 ≤ 5.0 - R 1.000 1.000 0.999 1.000 1.000 1.000 ≥ 0.999
3 LOD 2.123 1.964 2.607 2.003 1.188 1.940
-4 LOQ 7.077 6.545 8.689 6.676 3.960 6.465
-Table 4: Regression.
Agents Regression Equation R2
HYQ y = 17918.84x + 19823.77 0.9990
DEX y = 26835.74x + 98029.49 0.9991
TSA y = 23408.69x + 25656.23 0.9984
HCA y = 28243.56x - 39937.17 0.9991
BMV y = 21340.53x + 290070.95 0.9997
REA y = 41785.38x - 298920.31 0.9991
Limits of detection and quantitation
The LOD and the LOQ for this simultaneous analysis were found to be 2.14 μg/mL and 7.14 μg/mL for HYQ, 1.96 μg/mL and 6.52 μg/mL for DEX, 2.59 μg/mL and 8.62 μg/mL for TSA, 1.98 μg/mL and 6.61 μg/mL for HYA, 1.19 μg/mL and 3.98 μg/mL for BEV, and 1.95 μg/mL and 6.50 μg/mL for REA, respectively (Table 3).
Precision
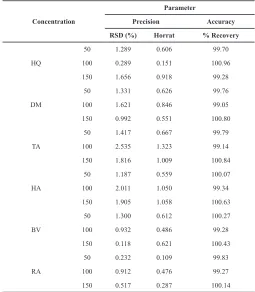
The repeatability of the method was carried out and the high values of the mean assay and low values of % RSD and the Horrat value for HYQ, DEX, TSA, HYA, BEV and REA revealed the proposed method is precise. The results showed in (Table 5). Accuracy
Fig. 4: The purity plots of hydroquinone, dexamethasone, triamcinolone acetonide, hydrocortisone acetate, betametasone valerate and retinoic acid.
Analysis of marketed formulation
In this market sample analysis, DEX sample was not tested. Analysis was done to commercial HYQ (2%), TSA (0.1%), HYA (0.1%), BEV (0.1%), and REA (0.1%) cream. Sharp and well-defined peaks for HYQ, TSA, HYA, BEV, and REA were
obtained respectively when scanned with PDA detector at 210-400 nm. The result of the measurement is presented in Table 6.
CONCLUSION
developed and validated for the simultaneous analysis of HYQ, DEX, TSA, HYA, BEV and REA in the cream topical formulation. The validation results revealed that the methods are precise, linear and accurate, which proves the reliability of the proposed method. The method could be successfully applied for routine analysis and quality control of pharmaceutical dosage forms.
Table 5: Precision and accuracy parameters.
Concentration
Parameter
Precision Accuracy RSD (%) Horrat % Recovery
HQ
50 1.289 0.606 99.70
100 0.289 0.151 100.96
150 1.656 0.918 99.28
DM
50 1.331 0.626 99.76
100 1.621 0.846 99.05
150 0.992 0.551 100.80
TA
50 1.417 0.667 99.79
100 2.535 1.323 99.14
150 1.816 1.009 100.84
HA
50 1.187 0.559 100.07
100 2.011 1.050 99.34
150 1.905 1.058 100.63
BV
50 1.300 0.612 100.27
100 0.932 0.486 99.28
150 0.118 0.621 100.43
RA
50 0.232 0.109 99.83
100 0.912 0.476 99.27
150 0.517 0.287 100.14
Table 6: Result from the assay of marketed formulation.
Sample Component % Mean Amount SD % RSD
1 Hydroquinone 99.86 0.8600 0.8612
2 Triamcinolone acetonide 100.13 0.3022 0.3018
3 Hydrocortisone acetate 97.02 0.1760 0.1814
4 Betamethasone valerate 102.50 0.7606 0.7420
5 Retinoic acid 104.87 0.9222 0.8795
CONFLICT OF INTEREST
The authors declare no conflicts of interest.
ACKNOWLEDGMENT
The authors are grateful to the Indonesia National Agency of Drug and Food Control (BPOM RI) for supporting all this research cost. The authors are also thankful to the Faculty of Pharmacy Indonesia University, for encouraging and motivating for this research work.
REFERENCES
Asean Cosmetic Method. Identification and Determination of Hydroquinone in Cosmetic Products by TLC and HPLC. 2005. ACM INO 03.
Asean Cosmetic Method. Identification of hydrocortisone Acetate, dexamethasone, betamethasone, betamethasone 17 valerate and triamcinolone acetonide in cosmetic products by TLC and HPLC. 2005. ACM MAL 07.
Asean Cosmetic Method. Identification of Retinoic acid (Retinoic Acid) in Cosmetic Products by TLC and HPLC. 2005. ACM 001.
Aung Myo Htet, EI Ei Thin, Mi Mi Saw, Soe Win. Chemical analysis of hydroquinone and retinoic acid contents in facial whitening creams. Asian Journal Of Pharmaceutical Sciences II. 2016. pp. 89-90.
Charlene DeHaven. Hydroquinone. www.innovativeskincare. 2014.
Desmedt B, Van Hoeck E, Rogiers V, Courselle P, De Beer JO, De Paepe K, Deconinck E. Characterisation of suspected illegal skin whitening cosmetics. J Pharm Biomed Anal, 2014; 90:85-91.
Deswal A, Dhanda H. Pharmacology, and impact of retinoic acid on the treatment of premalignant squamous lesions of the oral cavity. The Pharma Innovation Journal, 2017; 6(7):20-26.
Gimeno P, Maggio AF, Bancilhon M, Lassu N, Gornes H, Brenier C, Lempereur L. HPLC-UV Method for the identification and screening of Hydroquinone, ethers of hydroquinone and corticosteroids possibly used as skin-whitening agents in Illicit Cosmetic Products. Journal of Chromatographic Science, 2016; 54(3):343-352.
Laurence Brunton, Bruce Chabner, Bjorn Knollman. Goodman & Gilman’s the pharmacological basis of therapeutics (12th ed.). New York: McGraw-Hill Companies Inc. 2011.
Petkova N., P. Brabant, An. Masson, P. Denev. 2013. HPLC analysis of mono- and disaccharides in food products, Scientific works of UFT, Volume LX, “Food Science, engineering and technologies”, 18-19 October 2013, Plovdiv, 761-765.
Sheliya K., Shah K., Kapupura P. Development and validation of analytical method for simultaneous estimation of mometasone furoate, hydroquinone and retinoic acid in the topical formulation by RP-HPLC. Journal of Chemical and Pharmaceutical Research, 2014; 6(4):934-940.
United States Pharmacopoeia(40nd ed.). Rockville: The United States Pharmacopeial Convention. 2016.
How to cite this article: