Copyright © 2013 IJECCE, All right reserved
Pixel Feature Classification Based Blood Vessel
Segmentation in Retinal Image
Niteen Kumbhare, Prof. Trushna Deotale
Abstract –Automated detection of blood vessel is alwaysbeen the area of interest for various eye related disease diagnosis. Diabeic Retinopathy is the most common cause of blindness. This paper presents a new optimized method for blood vessel detection in digital retinal images. This method uses a neural network (NN) scheme for pixel classification and computes a 2-D vector composed of gray-level features for pixel representation. Based on the feature vector pixels are classified as vessel and nonvessel. This algorithm is tested on publically available Drive database where vasculature structures are marked by expert. The average accuracy of 0.9361 is achieved which is far superior as compared to the accuracy obtained using rule based method.
Keywords–Diabetic Retinopathy, Microaneurysms, Neural Network, Vessels Segmentation, Vasculature Structure.
I. I
NTRODUCTIONDiabetic Retinopathy (DR) is the most common diabetic eye disease and is the leading cause of blindness in a persons with diabetes within the age group 20 to 74 years in developed countries [1]. It is caused by the changes in the blood vessel of retina. It is provoked by diabetes-mellitus complications and, although diabetes affection does not necessarily involve vision impairment, about 2% of the patients affected by this disorder are blind and 10% undergo vision degradation after 15 years of diabetes [2], [3] as a consequence of DR complications. The estimated prevalence of diabetes for all age groups worldwide was 2.8% in 2000 and 4.4% in 2030, meaning that the total number of diabetes patients is forecasted to rise from 171 million in 2000 to 366 million in 2030 [4]. DR also becomes a great economic problem for Administrations since, only in U.S. cost of ophthalmic chronic complications caused by diabetes exceeded 1 billion dollars in 2007 [5].
Although the diabetic retinopathy is not curable and also DR patients perceive no symptoms until visual loss develops, usually in the later disease stages, when the treatment is less effective. But if the treatment is received in time patients can be prevented to become affected from this condition or atleast the progression of DR can be slowed down. Thus, mass screening of the patients suffering from the diabeties is highly desired, but manual grading is slow and resource demanding. Therefore more effort is being taken to design authentic computer - aided screening system based on color fund us images. The promising result reported by Antal et al.[6] indicate that the automatic DR screening systems are getting closer to be used in clinical practices. These types of automated systems have the potential to reduce the workload for screening ophthalmologists while maintaining a high sensitivity (i.e., above 90%) for the detection of patients
with DR. Furthermore, itwould also result in economic benefits for public Health Systems, since cost-effective treatments associated to early illness detection lead to remarkable cost savings [7].
A key feature in acknowledging DR is to detect microaneurysms (MAs) in the color fundus of the eye. The two crucial thing of handling MAs are, first, they are normally the earliest signs of DR, hence their timely and precise detection is essential. On the other hand, the grading performance of computer-aided DR screening systems highly depends on MA detection. Knowledge on blood vessel location can be used to reduce the number of false positives in microaneurysms and hemorrhage detection [8].
In this paper, a new methodology for blood vessel detection presented by Marin et al. [9] is optimized for the MA detection. It is based on pixel classification using a 2-D feature vector extracted from preprocessed retinal images and given as input to a neural network. Classification results (real values between 0 and 1) are thresholded to classify each pixel into two classes: vessel and nonvessel. Finally, a postprocessing fills pixel gaps in detected blood vessels and removes falsely-detected isolated vessel pixels.
Despite its simplicity, the high accuracy achieved by this method in blood vessel detection is comparable to that reported by the most accurate methods in literature. Moreover, it offers a better behavior against images of different conditions. This fact is especially relevant if we keep in mind that the main aim of implementing a vessel segmentation algorithm is its integration in systems for automated detection of eye diseases. This kind of systems should require no user interaction and, therefore, be field of retinal imaging, this involves a huge challenge, since large variability is observed in the image acquisition process and a natural variation is reported in the appearance of the retina.
Copyright © 2013 IJECCE, All right reserved The rest of the paper is organized as follows. Next
section reviews methods of vessel segmentation solutions. Section III describes the material used in this study. Section IV explains and illustrates the proposed method for retinal vessel segmentation, while Section V presents its results and compares them to those obtained with other existing
methods. Finally, the author’s conclusions and discussion
conclude this paper.
II. S
TATE OFA
RTMany methods for retinal vessel segmentation have been reported. These can be divided into two groups: rule-based methods and supervised methods. In the first group, we highlight methods using vessel tracking, mathematical morphology, matched filtering, model-based locally adaptive thresholding or deformable models. On the other hand, supervised methods are those based on pixel classification (implementing some kind of classifier). Regarding rule-based methods, vessel tracking methods attempt to obtain the vasculature structure by following vessel central lines. On the other hand, supervised methods are based on pixel classification, which consists on classifying each pixel into two classes, vessel and non-vessel. Classifiers are trained by supervised learning with data from manually-labeled images.
III. M
ATERIALSFundus photography is the creation of a photograph of the interior surface of the eye, including the retina, optic disc, macula, and posterior pole. The fundus image of the retina is basically acquired with the digital fundus camera, which is a specialized camera that images the retina via the pupil of the eye. The fundus camera has the illumination system. Modern systems image at high-resolution and in color with Nikon or Canon digital SLR camera backends. The field of view (FOV) of the retina that is imaged can usually be adjusted from 25◦ to 60◦ (as determined from the pupil) in two or three small steps. The smaller FOV has better detail but this is at the expense of a reduced view of the retina [10].
There are various publicly databases which are available online for the study or research purpose such as Messidor database, STARE, DRIVE, DIARETDB1, Goldman Standard database and private database from hospital. The databases available are for the study and research purpose. In this databases various images along with annotation file is provided in which pathological result for each image such as retinopathy grade and features which are present such as microaneurysm, exudates, hemorrhages, neovascularization is mentioned.
IV. P
ROPOSEDV
ESSELS
EGMENTATIONM
ETHODThis paper proposes an optimized blood vessel segmentation based on neural network scheme for pixel classification. The necessary feature vector is computed
from preprocessed retinal images in the neighborhood of the pixel under consideration. The following process stages may be identified:
Digital fundus image preprocessing for gray-level homogenization and blood vessel enhancement
Feature extraction for pixel numerical representation
Application of a classifier to label the pixel as Vessel or Non Vessel
Post processing for filling pixel gaps and removing falsely detected isolated blood vessel
Input images are monochrome and obtained by extracting the green band from original RGB retinal images. The color image is basically consist of red, blue and green channel. When monochromatic film was commonplace a bluegreen filter was sometimes placed in the optical path of the fundus camera as the greatest contrast in retinal images occurs in the green wavelengths of light. Because retinal images are almost always saturated in the red channel and have very low contrast in the blue channel. Thus, blood vessels are best represented and reach higher contrast in the green channel [10]. Detection of Retinal vessel the detection of retinal vessel is important, since the severity of the disease and effect of the treatment can be determined by vessel detection. There are lot of methods has been published for the blood vessel detection like 2D matched filter based approach. The matched filter method is found to be more efficient than Sobel operator and morphological operator.
Diego Marin et al. [9] proposed a novel method for the segmentation of blood vessel in retinal image using gray level and moment invariant – based features. In that he uses neural network for the pixel classification and determines seven dimensional vectors composed of gray level and moment invariant based – features. It has been observed that the sensitivity of the matched filter can be optimized using genetic algorithm [7]. A 2-D Gabor wavelet based approach with supervised classification was used for the retinal segmentation. Based on the pixels feature vector the method classifies every pixel as blood vessel or non vessel and produces the required segmentations [11]. A Bayesian classifier with class-conditional probability density functions described as Gaussian mixtures were used which yielded a fast classification. A neural network based approach using Principle Component Analysis was used in [11].
Copyright © 2013 IJECCE, All right reserved energy and density which are the parameters to find out
abnormal blood vessel.
A. Preprocessing
As the photographer does not have complete control over
the patient’s eye or patients often do not or cannot hold
their eye still during the imaging process hence retinal images are often unevenly illuminated with parts of the retinal image brighter or darker than the rest of the image, or, in worst cases, washed out with a substantial or complete loss of contrast. In addition to uneven illumination retina varies in intensity due to its own natural appearance. Chaudhari et al. [14] was first to attempt for detection of vessel in retinal images. Due to poor contrast, noise and uneven illumination preprocessing is required. It consist of vessel central light reflex removal, background homogenization and vessel enhancement.
1. Vessel Central Light Reflex Removal
Since the blood vessel appear darker than the background and they have lower reflectance as compared to other retinal surface. Some blood vessel contain light reflection which reduce central length of blood vessel. To remove this morphological opening with 3 pixel diameter disc is performed. The disc size is kept as small as possible to reduce the risk of merging of close vessel.
2. Background Homogenization
Since due to uneven illumination the background has significant lighting variation. Usually background pixel have higher gray-level values compared to blood vessel but intensity values of some background pixels is comparable to that of brighter vessel pixels. The feature vector which are used to represent a pixel in classification stage is formed by gray-level values, this effect significantly reduces the performance of vessel segmentation.
Therefore to remove these lighting variation firstly 3 × 3 mean filter is applied to remove salt and pepper noise. Here mean filter is preferred over median filter because mean filter is faster than the median filter. Further noise smoothing is achieved by convolving with Gaussian kernel of dimension 9 × 9, mean = 0 and variance = 1.82. Secondly the background image is produced by applying mean filter of 69 × 69. When this filter is applied the pixel near field of vision are strongly biased by external dark region. To remove this out of field of vision gray levels are replaced by the average gray levels in the remaining pixels in the square and difference between Igand IBGis calculated for every pixel such as :
D(x,y) = Ig(x,y) - IBG(x,y) (1)
After that shade corrected image Isc is obtained by subtraction of background image from original image and ransforming the linear RD values into the integers to cover complete range of possible gray levels. This method tends to reduce background intensity variation and enhance the contrast.
In addition to background intensity variation there is still variation in intensities of image due to uneven illumination, therefore homogeneous image is obtained as follows: gout = 0 ; for g < 0
= 255 ; for g > 255 (2) = g ; otherwise Where,
g = gin+ 128–gin-max
gin= gray level variable of shade corrected image (Isc) gout= gray level variable of homogeneous image (Ih) gin-max= gray level containing highest no. of pixel in Isc
Fig.(b) Example of Preprocessing Methods Because of this the pixels with gray level intensity gin-max, earlier corresponds to background are now set to 128 for 8 bit image. Therefore background pixel in images with different illumination condition will standardize their intensity around this value.
3. Vessel Enhancement
The final preprocessing step consists of generating a new vessel-enhanced image (Ive), which proves more suitable for further extraction of gray level based features. Vessel enhancement is performed by estimating the complementary image of the homogeneous image Ih, Ihc, and subsequently applying the morphological Top-Hat transformation as :
Ive= Ihc-γ (Ihc) (3)
Where γ is morphological opening with disc of eight pixel in radius to remove bright retinal structure such as optic disc, exudates and cotton wool spots, enhancing darker regions such as blood vessel, hemorrhages, microaneurysms and fovea.
B. Feature Extraction
The feature extraction stage is done for pixel characterization by means of a feature vector, a pixel representation in terms measurable quantity which may be easily used in the classification stage to decide whether pixels belong to a real blood vessel or not. In this paper, the following sets of features only two gray level features are being selected:
Original gray level intensity values of the vessel enhanced image
Mean of 3×3 square matrix of each pixel of vessel enhanced image
C. Classification
In the feature extraction stage, each pixel from a fundus imageis characterized by a vector in a 2-D feature space such as:
Copyright © 2013 IJECCE, All right reserved linearally separable because of the presence of vasculature
structures. Some of nonlinear classifier can be found in the existing literature on Bayesian classifier [15], Neural network [16], Support Vector Machine [17], and kNN method [18]. In the proposed method feed forward back propagation neural network is selected. There are two stages of neural network, one is design stage and other is application stage. In design stage configuration and training of neural network is performed. In application stage trained neural network is used to classify every pixel as Vessel or Nonvessel to obtain binary vessel image.
1. Neural Network Design
A multilayer feed forward back propagation neural network, consisting of two neurons (dimension of feature vector) in input layer, two hidden layers of six and three neurons each and an output layer, is adopted in this work. The output layer contains a single neuron and is attached, as the remainder units, to a nonlinear logistic sigmoid activation function, so its output ranges between 0 and 1.The training set STcomposed of the set of N candidates for which the feature vector and classification results are already determined. The number of the candidates in the training set are determined by indexing the pixel with value 1 ie vessel pixel and after that equal number of the nonvessel pixel that is pixel with value 0 are selected. In our approach to determine the vessel segmentation on DRIVE database the approximate no. of vessel pixel are found to be 24000.
2. Neural Network Application
At this stage the trained neural network is applied to unseen images to generate a binary image in which blood vessel are identified from the retinal background. In this case, the input unit of neural network receive the set of features provided by training set. Since a logistic sigmoidal activation function was selected for the single neuron of the output layer, the NN decision determines a classification value between 0 and 1. Thus, a vessel probability map indicating the probability for the pixel to be part of a vessel is produced. The bright pixels in this image indicate higher probability of being vessel pixel. In order to obtain a vessel binary segmentation, a thresholding scheme on the probability map is used to decide whether a particular pixel is part of a vessel or not. In our approach the threshold is set to 80 over the range of 0 to 255 ie pixel having values greater than or equal to 80 will be classified as vessel else nonvessel.
Fig.c. Final Vessel Segmented Image
D. Postprocessing
Classifier performance is enhanced by the inclusion of a two step postprocessing stage: the first step is aimed at
filling pixel gaps in detected blood vessels, for this an inpaint-nan operation is performed. While the second step is aimed at removing falsely detected isolated vessel pixels. An iterative filling operation is performed by considering that pixels with at least six neighbors classified as vessel points must also be vessel pixels. Besides small isolated regions are misclassified as blood vessel are also observed. To remove these imperfections the pixel area in each connected region is measured and each region connected to an area below 24 is reclassified as nonvessel. An example of final vessel segmented image is shown in Fig.c.
V. R
ESULTIn a manner to evaluate the performance of algorithm on fundus image, the blood vessel segmentation result are compared to the corresponding manual creation of vessel mask in which Vessel pixels are assigned to 1 and Nonvessel pixels are set to 0. The Table below shows the vessel classification approach:
Table I: Vessel Classification
Vessel Present Vessel absent
Vessel Detected
True Positive (TP)
False Positive (FP) Vessel Not
Detected
False Positive (FP)
True Negative (TN) In this paper, the algorithm is evaluated in term of sensitivity (Se), specificity (Sp), positive predictive value (Ppv), negative predictive value (Npv) and accuracy (Acc). These terms can be obtained as:
) 9 (
) 8 (
) 7 (
) 6 (
) 5 (
FP TN FN TP
TN TP Acc
FN TP
TN Npv
FP TP
TP Ppv
FN TP
TP Sp
FN TP
TP Se
Se and Sp is the measure of well classified vessel and nonvessel pixel. Ppv is the ratio of pixels classified as vessel pixel that are correctly classified. Npv is the ratio of pixels classified as background pixel that are correctly classified. Acc is a global measure providing the ratio of total well-classified pixels.
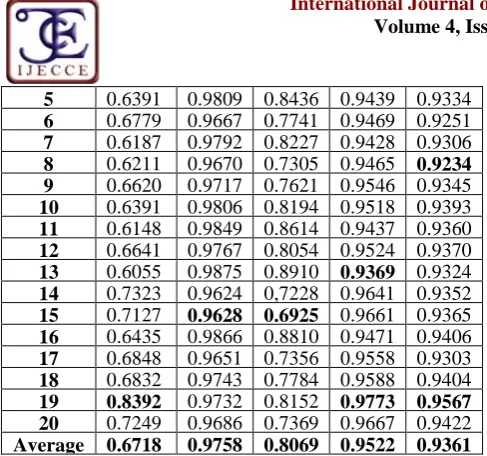
This method is evaluated on the Drive database images and the results are listed in Table. II. and in Table. III performance result comparison of the methodology introduced in this paper with other existing methods in literature is shown.
Table II: Result of algorithm tested on Drive database
Image Se Sp Ppv Npv Acc
1 0.7463 0.9741 0.8149 0.9618 0.9439 2 0.6753 0.9888 0.9148 0.9447 0.9413 3 0.6712 0.9716 0.8042 0.9445 0.9271
Copyright © 2013 IJECCE, All right reserved 5 0.6391 0.9809 0.8436 0.9439 0.9334
6 0.6779 0.9667 0.7741 0.9469 0.9251 7 0.6187 0.9792 0.8227 0.9428 0.9306 8 0.6211 0.9670 0.7305 0.9465 0.9234 9 0.6620 0.9717 0.7621 0.9546 0.9345 10 0.6391 0.9806 0.8194 0.9518 0.9393 11 0.6148 0.9849 0.8614 0.9437 0.9360 12 0.6641 0.9767 0.8054 0.9524 0.9370 13 0.6055 0.9875 0.8910 0.9369 0.9324 14 0.7323 0.9624 0,7228 0.9641 0.9352 15 0.7127 0.9628 0.6925 0.9661 0.9365 16 0.6435 0.9866 0.8810 0.9471 0.9406 17 0.6848 0.9651 0.7356 0.9558 0.9303 18 0.6832 0.9743 0.7784 0.9588 0.9404
19 0.8392 0.9732 0.8152 0.9773 0.9567
20 0.7249 0.9686 0.7369 0.9667 0.9422
Average 0.6718 0.9758 0.8069 0.9522 0.9361
Table III: Performance Result compared to Other Methods in term of Average Accuracy on Drive database
Method Type Method Drive
Supervised
Niemeijer et al. [15] 0.9417 Ricci and Perfetti [19] 0.9595 Soares et al. [17] 0.9466 Staal et al. [18] 0.9441 Marin et al. [9] 0.9452 Kumbhare et al. [this
work ]
0.9361
Rule Based
Chaudhuri et al. [14] 0.8773 Jiang and Mojon [16] 0.8911 Martinez-Perez et al.
[20]
0.9344 Cinsdikici et al. [21] 0.9293 In Table III the results shown are obtained upon testing 20 images provided in the Drive database. In order to compare our approach to other methods vessel segmentation method the average accuracy is chosen to as parameter of performance measure. Though the performance of our method stands last in the list but we have considered only two feature of the pixel. Considering the fact that Marin et al. [9] obtained his performance by taking seven features, five of them are gray level features and rest of the two are moment invariant. But the methodology of this paper tend to outperform rule base methods used by Chaudhuri et al. [14], Jiang and Mojon [16] , Martinez-Perez et al. [20] and Cinsdikici et al. [21].
VI. D
ISCUSSION ANDC
ONCLUSIONThe blood vessel segmentation methods are classified as rule based and supervised method. This work comes under second category where the number of feature used for the pixel representation are optimized. This method uses the neural network scheme for training and testing the images. Since we have used only two feature and moment in variant features are not included while pixel classification still we have succeed to obtain promising result.
The experiments aimed at evaluating the efficiency of the applied descriptors prove this method is capable of producing promising result. Table II and III shows its
accuracy performance when feature vector are composed of only two features. This accuracy performance tend to outperform the rule based methods as identified from Table III.
The proposed method uses the multilayer perceptron feed forward back propagation neural network for the pixel classification. This classifier was selected after the performance accuracy assessment by means of kNN and SVM. This method also perform well when testing is done
on “unseen” images unlike Ricci and perfetti’s approach
[19] which performs well when training and testing is done on the same database but performance gets worse when testing unknown images. This might be because they avoid image processing to preserve the vessel structure at the most. Since we have evaluated our algorithm on Drive database which is approximately 540 × 540 pixel and parameter were set according to that, to evaluate our algorithm on different database we will have to do parameter optimization. To make the method applicable for preprocessing images of any resolution its implementation include either resizing or resampling the image to fulfill the mentioned size, condition or setting all the parameters according to new retina size.
In addition to this the method simplicity should also be appreciated since its pixel classification procedure include only two features compared to that of Marin et al. [9] which utilizes seven features thus needing shorter computation time. Since our implementation is experimental there is lot of possibility of improvement. Its simplicity, flexibility, robustness and fast implementation make this blood vessel segmentation method suitable to be incorporate in screening system for early Diabetic Retinopathy detection. Ultimately these automated methods will help in screening of diabetic patients without the help of Ophthalmologist.
This blood vessel segmentation method can be used in future for the diagnosis of eye related disorder such as diabetic retinopathy. To detect various symptoms of DR such as microaneurysms, hemorrhages, exudates and neovascularization. Specifically this method will be useful to determine the new blood vessel grows on optic disk and fundus area which is the signs of proliferative diabetic retinopathy called as neovascularization.
R
EFERENCES[1] H. R. Taylor and J. E. Keeffe, “World blindness: A 21st century
perspective,” Br. J. Ophthalmol., vol. 85, pp. 261–266, 2001.
[2] R. Klein, S. M. Meuer, S. E. Moss, and B. E. Klein,“Retinal
microaneurysm counts and 10-year progression of diabetic
retinopathy,” Arch.Ophthalmol., vol. 113, pp. 1386–1391, 1995.
[3] P. Massin, A. Erginay, and A. Gaudric, Rétinopathie Diabétique.
[4] S. Wild, G. Roglic, A. Green, R. Sicree, and H. King, “Global
prevalence of diabetes: Estimates for the year 2000 and
projections for 2030,” Diabetes Care, vol. 27, pp. 1047–1053, 2004. GeoffDoughorty, “Medical Image Processing”, Chapter
11, Image Analysis of Retinal Images, Michael J. Cree and Herbert F. Jelinek.
[5] “Economic costs of diabetes in the U.S. in 2007,” in Diabetes
Care.: American Diabetes Association, 2008, vol. 31, pp. 596–
615. A. Hoover, Kouznetsoza, V., Goldbaum, M. (2000)
“Locating blood vessels in retinal images by piecewise threshold
probing of a matched filter response.” IEEE Transactions on
Copyright © 2013 IJECCE, All right reserved
[6] Balint Antal, Andras Hajdu, “An Ensemble-Based System for
Microaneurysm Detection and Diabetic Retinopathy Grading”,
IEEE Transactions on Biomedical Engineering, Vol. 59, No. 6, JUNE 2012.
[7] American Academy of Ophthalmology Retina Panel, Preferred Practice Pattern Guidelines. Diabetic Retinopathy. San Francisco, CA, Am.Acad. Ophthalmo., 2008 [Online].
[8] T. Spencer, J. A. Olson, K. C. McHardy, P. F. Sharp, and J. V. Forrester, “An image-processing strategy for the segmentation and quantification of microaneurysms in fluorescein angiograms
of the ocular fundus,” Comput.Biomed. Res., vol. 29, no. 4.
[9] Diego Marín, Arturo Aquino*, Manuel Emilio Gegúndez-Arias, and José Manuel Bravo, " A New Supervised Method for Blood Vessel Segmentation in Retinal Images by Using Gray-Level and Moment Invariants-Based Features", IEEE Transactions on Medical Imaging, Vol. 30, No. 1, JANUARY 2011.
[10] J. Kanski, clinical optholmology a systematic approach, (6thEd.)
(Elsevier, 2009)
[11] T. Spencer, J. A. Olson, K. C. McHardy, P. F. Sharp, and J. V. Forrester, “An image-processing strategy for the segmentation and quantification of microaneurysms in fluorescein angiograms
of the ocular fundus,” Comput. Biomed. Res., vol.29, no. 4,pp.
284–302, 1996.
[12] Akram et al. ,“Automated Segmentation of Blood Vessels for Detection of Proliferative Diabetic Retinopathy” Proceedings of
the IEEE-EMBS International Conference on Biomedical and Health Informatics (BHI 2012) Hong Kong and Shenzhen, China, 2-7 Jan 2012.
[13] Kevin Noronha et al., “Fundus Image Analysis for the Detection
of Diabetic Eye Diseases-A Review” 2012 International
Conference on Biomedical Engineering (ICoBE),27-28 February 2012, Penang.
[14] S. Chaudhuri, S. Chatterjee, N. Katz, M. Nelson, and M. Goldbaum,“Detection of blood vessels in retinal images using
two-dimensional matched filters,” IEEE Trans. Med. Imag., vol.
8, no. 3, pp. 263–269, Sep. 1989.
[15] M. Niemeijer, J. Staal, B. v. Ginneken, M. Loog, and M. D. Abramoff, J. Fitzpatrick and M. Sonka, Eds., “Comparative
study of retinal vessel segmentation methods on a new publicly
available database,” in SPIE Med. Imag., 2004, vol. 5370, pp.
648–656.
[16] X. Jiang and D. Mojon, “Adaptive local thresholding by
verification based multithreshold probing with application to
vessel detection in retinal images,” IEEE Trans. Pattern Anal.
Mach. Intell., vol. 25, no. 1,pp. 131–137, Jan. 2003.
[17] J. V. B. Soares, J. J. G. Leandro, R. M. Cesar, Jr., H. F. Jelinek,
and M. J. Cree, “Retinal vessel segmentation using the 2D Gabor
wavelet and supervised classification,” IEEE Trans. Med. Imag.,
vol. 25, no. 9, pp. 1214–1222, Sep. 2006.
[18] J. Staal, M. D. Abràmoff, M. Niemeijer, M. A. Viergever, and B.
V. Ginneken, “Ridge based vessel segmentation in color images
of the retina,” IEEE Trans. Med. Imag., vol. 23, no. 4, pp. 501–
509, Apr. 2004.
[19] E. Ricci and R. Perfetti, “Retinal blood vessel segmentation
using line operators and support vector classification,” IEEE
Trans. Med. Imag., vol. 26, no. 10, pp. 1357–1365, Oct. 2007. [20] M. E. Martinez-Perez, A. D. Hughes, S. A. Thom, A. A.
Bharath, and K. H. Parker, “Segmentation of blood vessels from
red-free and fluorescein retinal images,” Med. Imag. Anal., vol.
11, pp. 47–61, 2007.
[21] M. G. Cinsdikici and D. Aydin, “Detection of blood vessels in Ophthalmoscope images using MF/ant (matched filter/ant
colony) algorithm,”Comput. Methods Programs Biomed., vol.
96, pp. 85–95, 2009.