ISSN: 2333-6412 (Print), 2333-6420 (Online) Copyright © The Author(s). All Rights Reserved. Published by American Research Institute for Policy Development DOI: 10.15640/rcbr.v5n1a1 URL: https://doi.org/10.15640/rcbr.v5n1a1
Valuing Value Plays with Bloomberg
Christopher Brady
1, Wayland T. Coppedge
2& Reinhold P. Lamb
3Abstract
Value analysts attempt to identify particularly undervalued securities in an attempt to produce positive returns and even positive alpha. This paper traces the process of that pursuit from company selection through valuation. The resource showcased throughout is the tool used by professional portfolio managers and security analysts – Bloomberg. Each iteration along the process is demonstrated through Bloomberg functions and screenshots, providing a step by step map for identifying potential value plays.
Keywords: value stock, Bloomberg, stock valuation, equity analysis
1.Introduction
Made famous by the likes of Ben Graham and Warren Buffet, the art of value investing has existed for decades. Value investing is an investment strategy that focuses on selecting stocks that trade for less than their intrinsic or theoretical value. Eighty years after Graham first published Security Analysis(Graham and Dodd, 1934), value investing is as prominent as it’s ever been as investors continue to find methods of generating excess returns. While some may argue that markets may be overvalued at times, a true value analyst is always probing for undervalued companies.
This paper is not intended to introduce new value investing concepts but serves as a concise guide for amateur and professional value investors alike on how to identify and value an underpriced company. A demonstration of the step-by-step analytical process, from finding a worthy value company to making the investment recommendation, is sequentially presented. Eli Lilly (LLY), a major pharmaceutical company, is used as an example throughout to show how to apply these value concepts in a real environment that utilizes Bloomberg Professional Software during each step of the analysis. The corresponding Bloomberg function for each step is provided throughout the process.
2. Finding a Potential Investment
2.1 Developing Screens
There are over five thousand stocks listed on just the major United States exchanges alone and thousands more across the globe. Finding a company to start analyzing can be a daunting task for even the most experienced equity analyst. The best way to narrow down the universe of companies is by developing a screening process. Analysts have different variables for which they screen – any ten value analysts would likely have completely different screens. This just shows that value investing is as much of an art as it is a science. The most important part of coming up with the screen is to have a specific reason for each item in the screen.
1 Research Analyst, Alfred I. duPont Testamentary Trust, 510 Alfred duPont Place, Jacksonville, FL 32202, USA.
2 Department of Economics, Coggin College of Business, University of North Florida, 1 UNF Drive, Jacksonville, FL 32224,
USA.
3
For example, the screens in this paper are Return on Equity greater than 15%, Profit Margin 20% greater than the industry average, Debt-to-Equity 20% less than the industry average, Earnings per Share positive in the last annual period and last 4 quarters, positive Free Cash Flows, and positive Economic Value Added. This collection of variables is key to finding value companies, although the condition of each parameter is subjective.
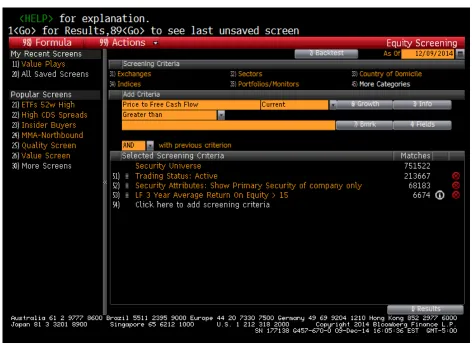
Figure 1: EQS <GO>
Figure above shows the Equity Screener page in Bloomberg (EQS <GO>), which allows analysts to search through the universe of securities using whatever screens are chosen. A list of companies that meet all of the inputted screens will appear for a more thorough analysis. No set of screens will ever produce just one company for an analyst to continue further analysis, so it is important that analysts have a way of sorting through and weighing the screened securities that appear. For example, the screen above with the stated variables and parameter values resulted in almost 200 global equities satisfying the criteria.
2.2 Picking the “Right” Company
Figure 2: DES <GO>
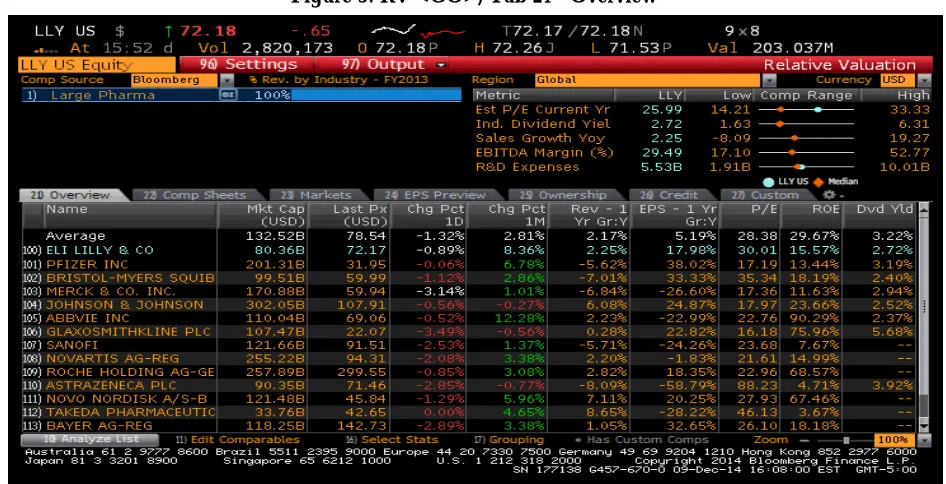
The Relative Value functions in Figure 3 permits for the analysis of a company in comparison to other peer companies. The two tabs recommended for a quick analysis are 21) Overview and 22) Comp Sheets. These screens are customizable, but come preset with ratios such as Price-to-Earnings and Enterprise Value to EBITDA to compare a company’s relative value to its peers.
Figure 3: RV <GO>, Tab 21 - Overview
2.3 Getting Down and Dirty
At this point a short list of candidates to start to emerge. Next comes the hardest part in the value analysis: picking one company with which to move forward. The remaining steps will take many hours to complete and there is a good chance that on one of the last steps the company is judged a bust and will not be selected for investment.
While there are some great lessons learned from those experiences, we’d rather not waste time with a bad company. The goal now is to find the best company in this short list and to continue with the remaining steps to find a great investment.
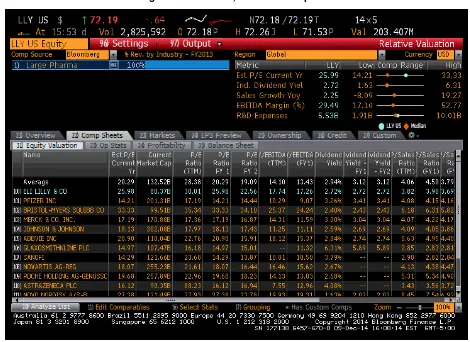
Figure 4: RV <GO>, Tab 22 – Comp Sheets
So how is the “right” company uncovered? The best course of action here is to get down and dirty and read the most recent annual report or 10K, and the investor presentation for each company. These reports are easiest to obtain from the company’s investor relations website. The process may involve a day to read through all of the reports, but it is much better to spend a day doing this than a week evaluating a bad company. When reading through the annual reports and presentations, make sure to write down points that stand out, both good and bad. Look out for transparency, or a lack thereof, in the financial statements and honest remarks from management even in bad periods. Confidence in management is weighted greatly by value analysts. After reading through the reports, it should become clear which company to proceed analyzing more fully. Even if more than one company is attractive, start with the top choice and work down the list –multiple investment ideas may have been uncovered through this one screen.
The combination of decreasing revenues and decreasing stock price might be disturbing for many investors; however, the expired patent produces a reasonable explanation for the drop in revenue. Consequently, LLY might be a worthy value play: a financially strong company experiencing something negative recently that changed investor’s opinions disproportionately.
3. Evaluating the Sector/Industry
At this point, the hardest part of the analysis - picking a company for deeper analysis – has been completed. Even the greatest of companies can result in poor investment performance if they are in a poor industry. For example, if Congress passes legislation making tobacco illegal it would be a bad idea to invest in a tobacco manufacturer.
A basic overview of the sector is good for the analysis, followed by a detailed understanding of the key factors in the company’s industry. This can all be found in Bloomberg through the Bloomberg Intelligence function - BI <GO>, which allows for the analysis of the key factors driving the industry of the company.
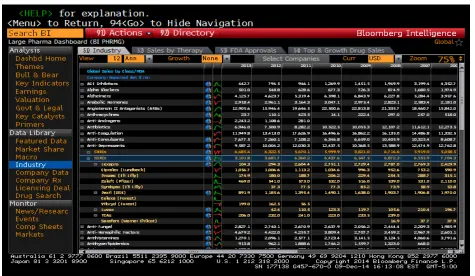
Figure 5 shows the Bloomberg Intelligence screen for the “Large Pharma” industry under the healthcare sector. The main screen provides the most recent news for the industry, along with key indicators and main competitors. The menu on the left provides analysts with a variety of places to conduct industry analysis. There are many opportunities to research an industry here, but one example is using the Industry menu item under Data Library. For the Pharmaceutical industry, this screen allows for the analysis of various types of drugs, such as antidepressants, and to see how much revenue comes from each major drug and company in the industry. This is important to see if a company has an advantage in a certain part of the market or if they are continually growing their market share. Analyzing the industry doesn’t just mean looking at the industry as a whole – it also includes analyzing the company’s position in the industry.
Figure 5: BI <GO>
This industry analysis allows us to learn a few key things in our analysis of Eli Lilly. First, LLY was not the only company to recently lose patent protection. Over the past two to three years, many patents expired in the pharmaceutical industry. This has caused a surge in generic drug companies who copy the once protected drugs. We can then start to analyze the position of Eli Lilly’s various drugs in comparison to competing drugs for the same diseases. This gives a good idea of where Eli Lilly’s positioning is in the market and if the loss of a major patent was detrimental to the business going forward.
4. Generating a Business Overview
Most finance websites, and even Bloomberg through DES <GO>, have a generic business description that explains what the company does. While this serves as a great precursor to a report, the buy side report will require a more involved analysis. It is crucial to not only know what a company does, but to understand it. Typically, a company’s annual report will include detailed information on what the company does, how the company is structured, why it is good at these things, and what risks are involved in the business. Understanding these factors is crucial to molding the company analysis.
Figure 6: BI <GO>, Data Library – Industry Tab
After understanding the business, the next objective is determining an appropriate way to organize the business description. One popular model is to begin with a simple paragraph similar to the typical business description, followed by a detailed analysis of each segment. These segment sections include an overview of the segment, why the company is (or is not) successful in this segment, and any potential risks involved with this segment. If there are any overarching risks that span across multiple segments, include them after the segment sections.
Eli Lilly has two main segments: Human Pharmaceutical Products and Animal Health Products. This is a fairly simple structure that makes this section of the analysis simpler. Unfortunately, not all companies are this easy to decompose. For example, Sasol Ltd., a major energy company in South Africa, has three “clusters” that each have multiple segments under them. Structures like this can lengthen the business analysis process. While this may not seem like a crucial step, it is imperative for the value analyst in order to truly understand the business prior to making financial projections.
4.2The Situation
Losing a patent on a top drug is damaging in an intangible asset intensive industry such as pharmaceuticals. LLY lost patent protection near the end of 2013 on Cymbalta, the number one anti-depressant drug at the time. This created a lot of doubt in the minds of shareholders, creating a possible value proposition. Our hypothesis was that LLY was undervalued due to its perceived inability to generate revenue and produce new drugs as a result of losing patents on Cymbalta and other drugs. This is just one example of a possible value stock’s story. The key is being able to identify and define the story – if that is not clearly and convincingly articulated, then the entire value proposition needs to be reevaluated.
4.3 Management Overview
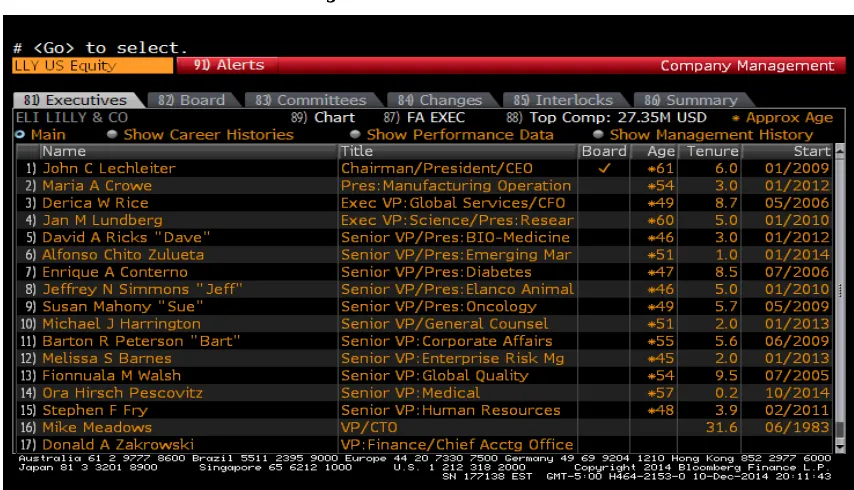
It is possible to have a great business, in a great industry, with what appears to be great financial performance, but it is still a poor investment. How is this possible? Management. Who is running the company is just as important as what the company does. While you most likely will not have the opportunity to meet management, there are other methods for evaluating management. Bloomberg provides an overview of management at MGMT<GO>, featured in Figure 7, which gives analysts an idea of who is running the company, their background, and how much money they are paid. A possible sign of ineffective leadership is if management’s salary is significantly higher than peers in bad years.
Figure 7: MGMT <GO>
It is also possible to evaluate management using quantitative methods. While there are multiple ways to do this, perhaps the most effective is by evaluating management’s Economic Valued Added (EVA), calculated by taking the Return on Invested Capital (ROIC) and subtracting the Weighted Average Cost of Capital (WACC). A high EVA Spread, found at WACC <GO>, shows that management is tackling projects that create excess value for shareholders. Additionally, research has shown that companies who generate higher EVA also have higher market capitalization growth, which is a result of higher returns to shareholders (Abate, Grant, & Stewart III, 2004). Figure 8 presents this important function.
There are a few things that stand out about Eli Lilly’s management team. The first is the tenure of the company’s executives. Management has been with the company long enough to understand how best to run the company. This is clearly shown from the fact that Eli Lilly’s CEO, John Lechleiter, took on his role during the global financial crisis. The second sign that Eli Lilly has good management comes from the company’s historical EVA Spread. EVA is a crucial indicator for judging management because it shows if management is using shareholder funds for projects that create excess value. As shown in the graph at the bottom left corner in Figure 8, Eli Lilly has had a positive EVA Spread in every year since Mr. Lechleiter took over as CEO in 2009, with the exception of the year he started – a sign that all of the projects he has pursued have created positive shareholder value. That Eli Lilly made it through the initial screen is a sign of good management. Very few companies are able to obtain consistently high ROE, high Profit Margins, low Debt levels, positive Earnings, and positive Free Cash Flow without good management leading the way.
4.4 Moat Analysis
Just as kings built moats surrounding their castles to fend off enemies, companies do the same. An economic moat is a theoretical moat that protects a company’s earnings from competitors, meaning they have a competitive advantage over peers. The main ways of obtaining an economic moat are cost advantage, size advantage, high switching costs, and intangible assets. While all are different, each of these moat sources provides a company with safeguards.
In order to evaluate how the company achieves a competitive advantage and how long this advantage will last can only come from the fullest understanding of the business. It appears that Eli Lilly has a narrow moat due to its intangible assets. It has a significant number of revenue generating drugs that aren’t going to disappear soon. While losing patents has hurt LLY’s moat, it has not destroyed it. Additionally, management has prepared for the loss of patents and has an above average number of drugs in the pipeline to ensure Eli Lilly has a sustainable economic moat moving forward.
5. Financial Analysis
5.1 Key Metrics & Ratio Analysis
After analyzing every qualitative factor of the company, it is time to look at the numbers. The quantitative analysis should begin with a few basic key metrics that are readily available, such as current stock price, 52 week price range, dividends, average volume, and market capitalization. These metrics can be included at the beginning either of the financial analysis or on the front page of the report as quick facts. Most of these metrics are found on the DES<GO> screen and the rest are found at FA <GO> Tab 17.
Figure 9: FA <GO>, Tab 17, Stock Value
Most of these ratios are found on the FA <GO> Tab 5 screen in Figure 10. It is important that you not only show the company’s financial ratios, but compare them to the industry averages as well because a Current Ratio of 1.5 can have very different financial interpretations across industries.
Figure 10: FA <GO>, Tab 5, Ratios
5.2 Projecting Financial Statements
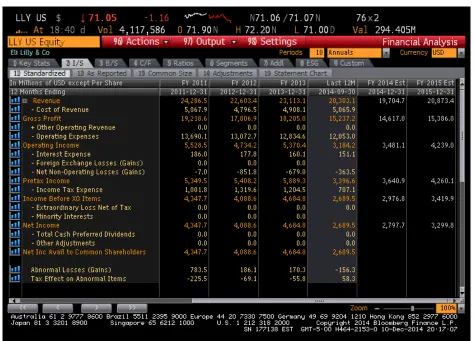
As the analysis continues, each section builds on each other. Realistically projecting a company’s financial statements is impossible without a great understanding of the business and the company’s financial situation. The best place to start when projecting company financials is on FA <GO>. This screen shows the company’s historical financial performance and the Bloomberg consensus estimates for future performance.
Figure 11: FA <GO>, Tab 2 – Income Statement
It is best to start with projecting how much money the company will make over the next 5 years. Typical projections use a 5 year forecast period, but sometimes models project 10 years. After this, you get to a point where it becomes ridiculous to project how a company will perform because it is so far out into the uncertain future. For the most accurate revenue projections, it is best to project revenue by decomposing it into business segment. While it may not make a huge difference on the final conclusions, it is much easier to justify the revenue assumptions if they are broken down it into smaller pieces of the business.
Revenue can be either forecast using a top down or bottom up approach. A top down approach involves analyzing the market as a whole, determining the total sales in the specific market, and then showing the company’s market share. To project revenue using this approach, forecast the total sales and the company’s market share over the next 5 year period and then multiply these two numbers together each year, giving you a revenue projection. A bottom up approach ignores the macro environment in calculations and projections are based on expectations of certain products the company is selling.
If something on the financial statements varies greatly from year to year, it may be due to a one-time write off or other abnormal item. It is imperative that these items are removed from the historical financials to ensure for the best possible projections.
There are four main assumptions for Balance Sheet projections: accounts receivable, accounts payable, PP&E, and debt. AR and AP are projected similarly by analyzing their historical percent of sales or number of days outstanding. The best way to project property, plant, & equipment is by projecting capital expenditures and developing a depreciation waterfall schedule based on the various useful lives. These assumptions are typically provided by management in the annual report. Debt projections are a function of cash, which comes from the statement of cash flows. If the company is expected to be strapped for cash at some point, then short term borrowings should also be projected. The majority of the statement of cash flow is linked from other statements. There are many great books that explain the detailed accounting involved with linking the financial statements.
One crucial aspect of financial statement projections is realizing that we live in an imperfect world that is subject to black swan events. This means that even though the analyst feels solid about the valuation, a bear case and a bull case should be incorporated into the model. These varying cases can be implemented two ways: by creating three sets of financial statements or by simply increasing/decreasing the discount rate in the valuation. Evidence indicates that it is more accurate to use more conservative financial statements as opposed to increasing the discount rate unless the bear case is caused by a permanent change (Ruback, 2011). Allowing for the ability to toggle through projections of what should happen followed by what could happen in a best and worst case scenario gives the value analyst a better understanding of the company’s financial situation.
6. Valuation Methodology
6.1 Computing the Required Rate of Return
Estimating the value of a company requires the determination of an appropriate required rate of return or discount rate (r) for the company. There are two main approaches for computing r: the buildup method and the weighted average cost of capital method. The buildup method involves applying additional required return percentage points based on various risks such as company specific risk, market risk, country risk, etc.
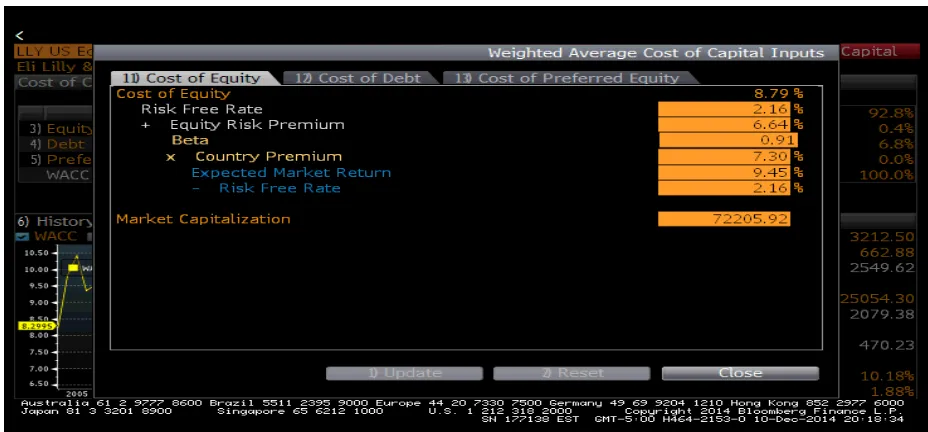
A more commonly used approach is calculating the Weighted Average Cost of Capital. This is a standard equation that calculates the weighted average between cost of equity and cost of debt. Bloomberg provides an easy way to calculate this number using WACC <GO>. This functionality allows for the changing of all the assumptions in the model. To calculate the WACC for Eli Lilly, a good starting point is the interest rate LLY must pay to issue debt. The Capital Asset Pricing Model (CAPM) is used to calculate the cost of equity. To calculate beta, which is used in the CAPM calculation, daily returns for LLY are regressed against the returns for the S&P 500 Index. Figure 12 provides the Bloomberg-generated WACC.
One of the main assumptions in this model is the Beta value used to calculate the cost of equity. Bloomberg provides a default Beta value based on their own parameters. It is best practice to calculate one’s own Beta through BETA <GO>. This menu allows for the selection of index, the frequency of returns, and the length of returns – all of which can have a significant impact on your Beta calculation and ultimately the WACC estimate.
6.2Discounted Cash Flow Analysis
Figure 12: WACC <GO>
One of the most important and overlooked parts of the DCF valuation is the terminal free cash flow value. This is calculated using the perpetuity formula by taking the cash flow in year five, multiplying it by the long-term growth rate, and then dividing this cash flow by the required rate of return minus the long-term growth rate. The value is highly sensitive to the value of the long-term growth rate chosen by the analyst. A generalized Rule of Thumb is that anything over 3% is considered unrealistic, because in the long term the U.S. economy tends to grow at about 3% each year. By using a long term growth rate greater than 3% implies that this company will always grow at a faster rate than the United States economy. This may be true temporarily but it is very difficult for an already large company to grow at such a rate on a sustained basis.
Figure 13: WACC <GO>, Cost of Equity Tab
6.3 Multiples-based analysis
The underlying idea is that a company should be valued in line with companies that are very similar. This method is less common in value investing because it does not look at the value of the specific company but at the value of other companies. Regardless, this is still a suitable method to value a company. RV <GO> provides a list of comparable companies. Figure 15 presents relative performance metrics across the peer group of companies. The most difficult part of valuing a company with this method is determining what a comparable company is. Once again, this is part art and part science. As long as a convincing justification for selection is given, the analyst has a basis for comparison. For example, Eli Lilly’s comparables could be major pharmaceutical companies with a market capitalization over a certain amount.
Figure 14: BETA <GO>
6.4Margin of safety
No matter how great a valuation model is, it will never be perfect. It is impossible to 100% accurately forecast a company’s performance years into the future because the future is uncertain. As a result, it is good to include what is called a margin of safety in our valuation analysis. A margin of safety is an adjustment to the calculated value that says that if the company is not trading X percent below the calculated (or intrinsic) value, then it is considered overvalued and should not be purchased. For example, using a 20% margin of safety on the Eli Lilly valuation, the purchase trigger will occur at a price below $68.65 ($85.81*.8) or less.
There are many ways of determining a margin of safety. Some analysts are extremely conservative in their financial projections and as a result will use a higher margin of safety around 20-30%. Other analysts will use a margin of safety that is more aggressive of 5%-15%. Additionally, some have developed models that determine the margin of safety an investor should demand (Yee, 2008). As the margin of safety gets higher you are more likely to invest in fewer companies, but more highly undervalued companies. Whatever margin of safety is assigned, it is crucial that one be included in the analysis because it recognizes that the calculated value is inexact and contains much uncertainty.
7. Making the Investment Recommendation
Even the best of investments may get thrown out if the pitch is not perfect. Every company is different so there is no specific model that guarantees success. The best thing is for the investment recommendation to showcase highlights from each section of the analysis and then really focus on the most important section to this pitch. In some cases, this is the leading company in a booming industry. Other times the valuation will be so much higher than the market value that even with no growth the company is undervalued. What matters is that the focus is on what is important to this investment and what drew the analyst to the company.
The last part of your pitch needs to be a bear case scenario. This requires going back through every part of the analysis and challenging every assumption made. Ask “if this doesn’t happen, is it still a good investment?” and discuss these potential pitfalls in the pitch. While they may not be likely, it is better to be upfront about a potential problem than wait until a problem occurs and then confess that it was a possibility.
References
Abate, J. A., J.L. Grant, and G. Stewart, III, (2004). The EVA Style of Investing. Journal of Portfolio Management, 30(4), 61-72.
Graham, B., and D. Dodd, (1934). Security Analysis. McGraw-Hill.
Ruback, R. S. (2011). Downsides and DCF: Valuing Biased Cash Flow Forecasts. Journal of Applied Corporate Finance, 23(2), 8-17.