www.sciencepolicyjournal.org JSPG., Vol. 12, Issue 1, February 2018
Compensating
Environmental
Policies’
Victims: Recommendations Based on Case
Studies and Theory
Michael A. Donatti
Formerly University of Bristol, School of Geographical Sciences (Completion: September 2017) Corresponding author: [email protected]
Keywords: compensation; environmental policy; case studies; sustainability; economics; typology; energy transition; carbon pricing
Executive Summary: Even where environmental policies benefit society at-‐large, their
costs may not be evenly spread. Specific polluters might suddenly need to pay for their pollution, or new restrictions might hurt livelihoods by cutting off an income-‐generating activity. The policies then affect firms’ competitiveness, sometimes creating distributional effects along socioeconomic or other lines. Compensating environmental policy victims reduces political pushback, contributes to fairness, and increases economic efficiency; and historically, many instances of environmental policies have included compensation. However, not much literature explicitly addresses this topic, and best practices for various types of environmental policy are unclear.
This study reviews relevant literature and cases of compensation for environmental policies. Based on both, it provides typologies for classifying environmental policies and compensation; it also develops criteria along economic, environmental, social, implementation, and cost lines to serve as a checklist for good compensation of unequal costs.
The ten cases from across four continents vary by type and by their performance. They include restrictions on resource use, like Canada’s 1992 cod fishing moratorium; subsidies for clean technology, like California’s 1998 scrappage program; and carbon pricing systems, like New Zealand’s 2008 Emissions Trading Scheme.
A final, comprehensive typological theory recommends compensatory mechanisms based on environmental policy design and uneven costs. The recommendations vary by type of compensation need, but they share some traits: fewer, targeted compensatory mechanisms prove more cost-‐effective and visible than more, broader ones; exemptions dampen policy incentives, hurting environmental performance; targeted payments or flexible subsidies, financed with related policy revenue, work well. Compensation should be transitional or reasonable, not providing a permanent means of avoiding policy requirements. The potential unequal costs of these requirements are lessened in an existing context of environmental goals and compensation.
The findings of this study apply to diverse cost imbalances that arise from environmental policies. Good compensation limits policy unfairness and perception of policy unfairness, leading to policy outcomes that are more environmentally effective, economically efficient, and conducive to social equity.
www.sciencepolicyjournal.org JSPG., Vol. 12, Issue 1, February 2018
I. Introduction
i.i Compensating environmental policies’ victims Environmental policies respond to the harm an activity generates for natural systems, wildlife, public wellbeing, or related domains. These policies aim to be “welfare-‐improving,” creating total benefits that exceed total costs.1 However, while their net effect is positive, environmental policies rarely carry even costs. By the Polluter Pays Principle (PPP), those who perpetrate the impacting activity will be more liable for these costs, even if the activity is good and useful for society despite its environmental harm.2 The policy then affects firms’ competitiveness,3 targeting a sector that pollutes with new or greater abatement costs and possibly taxes or permitting costs. These sectors might, when possible, also pass costs on to consumers. Ensuing distributional effects often follow socioeconomic lines, hurting the poor more and thereby making some environmental policies regressive.4
This paper will call those whom policies disproportionately affect environmental policy victims. It focuses on compensating these victims, whether they be industries, individuals, or segments of society, for what befalls them beyond their control, as Martini5 writes. Types of compensation vary widely. They include lump-‐sum payments,6 subsidies,7 adjustment periods,8 and tax-‐rate changes.9 On the extreme, Bugge even defines the “beneficiary-‐pays-‐ principle” (BPP), wherein the beneficiaries of an environmental policy pay for its costs.10 The line between polluter and beneficiary of reduced pollution can be hazy,11 complicating the application of the PPP and BPP and helping the argument for compensation in any case.
1 Johnstone and Serret, 2006, p.6 2 Bugge, 2009
3 OECD, 2008
4 Johnstone and Serret, 2006 5 Martini, 2007
6 Johnstone and Serret, 2006 7 Martini, 2007
8 OECD, 2006
9 Bovenberg et al., 2008 10 Bugge, 2009, p.415 11 Ibid
i.ii Motivations for compensation
When Hochschild explored views on environmental regulation in Louisiana, many residents she met expressed in some form that “environmental regulations kill jobs.”12 This sentiment exists elsewhere, too. If an environmental policy affects or appears to affect economic prosperity, it can develop this reputation—a reputation as unfair or bad for the economy—and face political pushback. The motivations for compensation thus include lessening this political pushback, contributing to fairness, increasing a policy’s economic efficiency, and sometimes even fulfilling legal requirements.
Political acceptance of a policy can depend on addressing substantial distributional effects.13 Fankhauser et al.14 found that democracies pass fewer climate change laws before elections, likely because of the potential pushback. Industry groups wield much political power,15 and compensation lessens the political pushback from losing groups,16 be they of firms or individuals. Compensation also contributes to fairness, which is important for public satisfaction with a policy and its establishing government. Martini defines fairness as distributing a “pool of benefits” according to merit and responsibility.17 Compensation increases the economic efficiency of environmental policies,18 which can otherwise slow economic growth by adding deadweight costs to businesses and individuals. Finally, compensation is sometimes legally mandated. For example, Bell et al.19 mention Bamford v. Turnley, an 1862 UK court case that inscribed into precedent the need for public policy winners to compensate those most burdened by it.
12 Hochschild, 2016, p.77
13 Johnstone and Serret, 2006 14 Fankhauser et al., 2015 15 Bovenberg et al., 2008 16 Martini, 2007
www.sciencepolicyjournal.org JSPG., Vol. 12, Issue 1, February 2018
i.iii Structure and purpose of this study Given the multiple reasons to motivate environmental policy victims, this study
answers three research questions regarding the practice:
1. What are the criteria for deeming instances of compensation successful? 2. How have key instances of compensation
fared by these criteria?
3. What recommendations follow for future environmental policies with a need for compensation?
The introduction closes with a brief discussion of the methodology. Section two provides a literature review and some background research, proposing typologies for categorizing environmental policies and compensation. It also addresses question one, listing criteria for analyzing compensation for environmental policies. Section three gives case study results, specifically answering research question two based on the given criteria. Section 3.5 addresses research question three, outlining some best practices in compensation design. It also recommends specific compensatory mechanisms for given types of environmental policy and compensation need. Discussion and Conclusion sections close the report. By researching this topic theoretically and empirically, the study aims to make designing future compensation easier, more efficient, and more effective.
i.iv Methodology
Extensive background research allowed for the development of preliminary typologies and criteria for understanding the success of the compensation of policy victims. Selecting and understanding cases depended on these frameworks, and the cases ultimately fed back into the frameworks. The studied cases consist of implementations of environmental policies with compensatory measures for those the policies negatively impact. All but two of the selected ten are over nine years old to ensure a broad window of motivation, design, implementation, and outcomes. The study follows what Gerring calls a “comparative-‐ historical” research design, which includes several cases, cross-‐case and within-‐case
variation, and temporal variation.1 The within-‐ case analysis is an effort at process-‐tracing, exploring what in the setup of a policy and its compensation leads to a given outcome.
The background research and case studies fuel recommendations for compensation design based on case type, through a typological theory that hypothesizes how independent variables impact case outcomes. In other words, cases fall into categories in the environmental policy and compensation typologies. Given some of these categorizations, the report recommends compensatory mechanisms; it also recommends some general design principles for all compensation in environmental policies.
The search for cases focused on countries that are members of the Organisation for Economic Co-‐Operation and Development (OECD). OECD countries do not provide the only examples of compensation, but the limitation implies that cases would be in jurisdictions with strong economic and democratic development. The OECD also publishes extensively on good policy practices, compensation, and environmental regulation in its member countries; and it developed the PPP in the 1970s.2 Within the limitation, cases vary geographically and by type, most importantly by policy instrument and compensatory mechanism employed. The final ten cases exhibit six of eight instruments and eleven of twelve mechanisms, and they come from eight national governments and two sub-‐ national governments across four continents.
II. Literature review and background on compensation for environmental policies
ii.i Review of literature on compensation for environmental policies
Although some amount of compensation for victims of an environmental policy is common, literature on the topic is limited. Endres3 discusses compensation for victims of environmental damage. This type of compensation appears also in literature on
1 Gerring, 2007, p.28 2 Bell et al., 2013
www.sciencepolicyjournal.org JSPG., Vol. 12, Issue 1, February 2018
environmental law;1 victims of environmental damage or degradation can demand compensation from polluters under tort law. Compensating victims of environmental damage is vital and often prompts strong environmental regulations. This paper, however, reviews compensation for those individuals/entities hurt by the introduction of a new environmental policy.
Several OECD publications specifically discuss the latter topic: compensating those individuals/entities hurt by policy change.2 These articles give some guidelines for effective compensation design, which section 2.6 details. Other articles express the need for this type of
compensation without detailing
implementation. Johnstone and Serret,3 for example, argue that environmental policies should mitigate potential regressive impacts. They also argue, along with Bell et al.4 that those who gain from policy should compensate those who lose from it.
Compensation for environmental policy appears in Bovenberg et al.,5 who study the cost implications of compensation requirements. Their conclusions recommend environmental policy design, but not exactly compensation design. Martini6 delves much deeper into analyzing the success of compensation in certain cases of policy reform, but he focuses on agricultural and not environmental policy. This paper will build on the literature to provide a much more thorough survey of compensation for victims of environmental policies, drawing conclusions about effective compensation design that account for nuances in type of environmental policies and what issue they attempt to address. The rest of section two cites the sources in the literature review and others to build the background for case study and ensuing recommendations.
ii.ii Basic background on environmental policies
1 Bell et al., 2013, as an example 2 OECD 1997; 2006; and 2008 3 Johnstone and Serret, 2006 4 Bell et al., 2013
5 Bovenberg et al., 2007 6 Martini, 2007
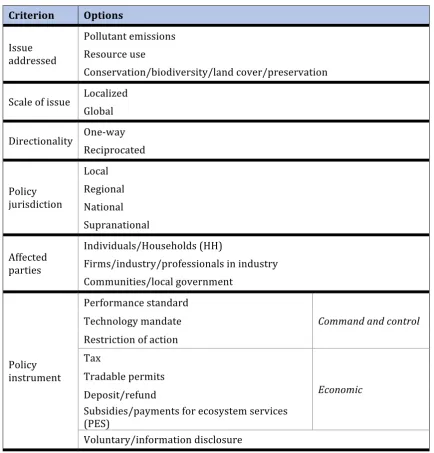
Environmental policies cover issues ranging from pollutant emissions to use of resources and conservation. These issues can be locally constrained, such as in the case of an overfished lake, or global, such as in the case of climate change. With reciprocated externalities, two or more parties can pollute, and both feel the effects. In other instances, one might have the capacity to pollute the other’s environment, and not vice-‐versa. Environmental policies to deal with these issues descend from all levels of government, and they take many forms. “Command-‐and-‐control” (C&C) policies are purely regulatory; they include performance standards, technology mandates,7 and restrictions of action. Alternatively, economic instruments indirectly address environmental externalities by shifting financial incentives; they include taxes, tradable permits, deposit/refund systems, and subsidies8. Emitters’ interest lobbies tend to favor instruments that keep their own costs down, like subsidies and trading systems with grandfathered permits9: ones given freely at first to existing polluters. Most policies, whether command-‐and-‐control or economic, involve some level of information disclosure or voluntary involvement. Politicians appreciate the latter because it shows some action to address externalities without hurting interest groups.10 Table 1 summarizes a typology for environmental policies.
ii.iii The unequal costs of environmental policies Martini11 writes that policies can vastly shift the status quo. The shift leaves behind people or companies with stranded costs or assets that were viable under a previous regulatory regime. Besides money lost, complying with new policies requires new investments. Performance standards and technology mandates have associated abatement costs. Economic instruments can impose both abatement costs and tax or permit costs.12 These new costs often create competitiveness concerns for Energy-‐
7 Bovenberg et al., 2008
8 Bovenberg et al., 2008; Endres, 2011; OECD, 1997 9 Michaelowa, 1998
10 Ibid
11 Martini, 2007
12 Bovenberg et al., 2008; Bugge, 2009; Johnstone and
www.sciencepolicyjournal.org JSPG., Vol. 12, Issue 1, February 2018
Intensive and Trade-‐Exposed (EITE) sectors that compete across borders with companies unaffected by the new policy.1
The new costs might also trickle down to consumers, creating distributional impacts if a policy or tax affects the prices of energy, fuel, or anything price-‐inelastic for low-‐income households.2 These concerns exist because low-‐ income households tend to spend a greater share of their income on energy and fuel. Leading up to British Columbia’s carbon tax, for example, the lowest household income decile in the province dedicated over 10% of income to energy costs; the top 6 deciles dedicated around 4% or less.3
The new costs or restrictions on industry might even lead to plant closures or downsizing. Fallout, then includes people out of work, whom the government can help. In certain cases, environmental policies can hurt individuals directly, with no company in the middle. A restriction might impede someone’s livelihood by prohibiting an income-‐generating activity. Efficiency standards might create abatement costs for households.4 The disparate costs of an environmental policy should in theory affect all polluters. However, the PPP is rarely implemented in full; exemptions or insufficient policies result in only some polluters bearing the cost for all pollution.5 Especially in these cases, but also in any case, compensation should support those bearing the unequal costs.
ii.iv Types of compensation for environmental policies
To develop a list of compensatory mechanisms commonly accompanying environmental policies, some parameters prove helpful. These mechanisms address three basic categories of unequal costs: distributional impacts, affecting groups differently based on socioeconomics, geography, or otherwise;6 particular industries targeted; or opportunity cost of an entity facing new restrictions. Compensation can go directly
1 OECD, 2008
2 Johnstone and Serret, 2006 3 Murray and Rivers, 2015 4 OECD, 1997
5 Bell et al., 2013 6 Bovenberg et al., 2008
to individuals or households, firms or a particular industry, or communities or local governments. Depending on the policy, the bearer of the unequal cost might continue the affected work, in which case compensation lessens the economic impacts of a transition. If the bearer of the cost has to stop an action altogether, compensation shields against ensuing fallout. Compensation timing and duration vary, as does whether the compensation is included in the environmental policy itself. Research following these parameters unearthed the compensatory mechanisms in table 2. These mechanisms include lump-‐sum payments,7 subsidies,8 exemptions, gradual implementation9 and early announcement,10 and reduced income taxes or environmental tax rates dependent on consumption levels.11
ii.v Judging environmental policies through the lens of compensation
Objectively reviewing the success of compensation requires a review of the associated environmental policy. Policies that do not effectively or cost-‐efficiently12 address a stated externality create additional challenges for compensation. An environmental policy must create clear incentives, whether legal or economic, to reduce a harmful behavior. The incentives are ideally true to the PPP in the widest sense, because an extensive application of the principle demonstrates fairness and reduces the likelihood that any one group will feel attacked by the policy. Endres13 argues that economic instruments exhibit the PPP most strongly because of the requirement to truly pay for pollution. However, C&C instruments can achieve wide coverage of relevant entities. They offer certain environmental outcomes, just perhaps without the economic efficiency of economic instruments.14 The latter are growing more popular because of wider political
7 OECD, 2006
8 Martini, 2007
9 Bell et al., 2013; OECD, 2006 10 OECD, 2008
11 Johnstone and Serret, 2006 12 Bell et al., 2013
www.sciencepolicyjournal.org JSPG., Vol. 12, Issue 1, February 2018
acceptability.1 Their economic efficiency stems from achieving targets at lowest marginal costs.2 Considering the need for compensation calls economic instruments’ superiority into question, however. Under economic instruments, compensation must sometimes account for both increased abatement costs and tax/permit costs.3
As for other instruments, the OECD4 warns that subsidies can perpetuate practices that are less harmful than the status quo, but still harmful. Johnstone and Serret5 argue that a wider environmental tax is usually less regressive: the more goods affected, the wider the spread of impacts on different income groups. By that logic also, the policy should only become more extensive over time. Its acceptance depends heavily on a public that is, if not concerned, at least well-‐informed of the environmental issues6 and the policy’s objectives. New environmental policies face less pushback if they exist in a greater policy context,7 like new emissions rules following a few years after comprehensive climate change legislation. They also face less pushback with greater public participation.8 Whatever the instrument, policymakers should optimize the policy to reduce administrative costs for themselves and abatement costs for the covered entities, because those directly impact compensation requirements.
ii.vi Judging compensation for environmental policies
Compensation must target and effectively address the unequal costs of an environmental policy. Compensating once costs are clear is good, but potentially politically difficult.9 Usually, environmental policy design aims to intelligently predict these costs beforehand through counterfactual studies. The impact is most often economic, so compensation should support steady financial opportunities. It should
1 Bell et al., 2013
2 Bovenberg et al., 2008; Endres, 2011 3 Bovenberg et al., 2008
4 OECD, 2008
5 Johnstone and Serret, 2006
6 Bell et al., 2013; OECD, 2008; OECD, 2006 7 OECD, 2008
8 OECD, 2008; OECD, 2006 9 Martini, 2007
do so without changing the policy instrument,10 targeting payments or other benefits directly to policy victims.11 Otherwise, it risks blocking the intended policy incentives to reduce harmful behavior;12 with economic instruments, for example, compensation should not block intended market signals. Ideally, it can even help incentivize the reduction of harmful behavior while compensating those affected.13 Subsidies and payments for ecosystem services often do just that. Compensation that remains highly visible over time increases favorability of the policy in the long run.14
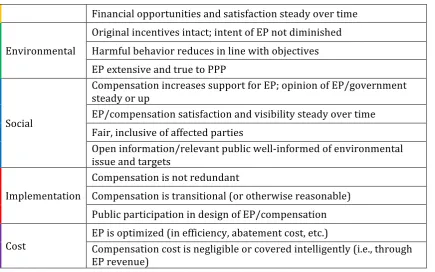
Compensation should fairly cover all those who lose economically, especially when nothing else covers them adequately. Good compensation achieves its aims without adding exorbitant costs to government budgets15 or becoming a crutch for policy victims.16 Instead, it should help the economy shift as needed and then phase out. “Permanent” forms of compensation might only be reasonable if a policy intends a permanent shift, such as from distortionary taxes to economy-‐wide carbon taxes. “Grandfathering” permits in trading systems, as in freely allocating permits to existing industry, risks blocking market entry for new players.17 Giving existing industries outright exemptions18 also lessens environmental effectiveness by removing intended incentives entirely. Any preferences in policy for pre-‐existing sources of environmental harm should be on a limited time horizon19, just enough to allow affected entities to adjust and no more. Table 3 gives criteria for judging success of compensation for environmental policies, based on this section and the previous.
III. Cases, results, and ensuing recommendations for compensation
10 Johnstone and Serret, 2006; OECD, 2006 11 OECD, 2008
12 Martini, 2007; OECD, 2008 13 OECD, 2006
14 Ibid
www.sciencepolicyjournal.org JSPG., Vol. 12, Issue 1, February 2018
iii.i Case backgrounds
Table 4 categorizes the ten studied cases by the most important variables from the typologies for environmental policies and compensation. Figure 1 shows the prevalence of compensatory mechanisms by policy instrument among cases. As it shows, no case uses deposit/refund or
subsidies/PES as instrument. As
voluntary/information disclosure factors into many case designs and by definition does not oblige action, it also does not appear as a distinct mechanism in the figure. Backgrounds for each case, including environmental policy design, need for compensation, and compensation design, follow.
iii.i.i British Columbia’s carbon tax
The British Columbia (BC) carbon tax came into force on July 1, 2008, covering almost 75% of provincial greenhouse gas (GHG) emissions. The price per ton of CO2-‐equivalent (tCO2-‐e) increased gradually from C$10 in 2008 to C$30 in 2012, where it has stayed.1 To address distributional impacts, the BC government sends payments to low-‐income households through the Low Income Action Tax Credit. It also cut income taxes by 5% for the bottom two brackets (with incomes of up to C$75,000 per year). It created additional tax credits for rural households, which spend more on fuel and thus are more impacted.2 To lessen industry impact, the government lowered the corporate tax rate from 12% to 10% (although now it is up to 11%).3 About 36% of the 28.3 billion USD carbon revenue worldwide is recycled to individuals and corporations in a similar way. BC stands on one extreme, having recycled 102% of its carbon revenue in 2013/14.4 It also built in exemptions for exported fuels, fuel for travel to/from the province, non-‐fossil fuel emissions, and fugitive methane from natural gas production. Since 2012/13, agriculture has received an exemption, and some revenue has gone to promoting unrelated sectors like film5 and “digital media”.6
1 Murray and Rivers, 2015 2 Ibid
3 Porter, 2016
4 Carl and Fedor, 2016 5 Murray and Rivers, 2015 6 Ibid, p.71
iii.i.ii Japan’s climate change mitigation tax Japan, where 90% of GHG emissions are energy related, implemented its Tax for Climate Change Mitigation on October 1, 2012.7 It applies to coal, oil, and natural gas at the most upstream point.8 The effective price per ton CO2 increased gradually to its steady value since 2016, JPY 289 (2.89 USD, about 12% the BC tax rate).9 The government aimed to spread the burden of the tax “wide and thin”10 by making it a surcharge of about 1-‐3% on existing fuel taxes.11 This amount is quite low,12 but that does lessen compensation needs.
The tax maintains exemptions for oil for petrochemical products, imported specific coal, specific coal for electrical generation, and some other products to protect EITE industries and appease competitiveness concerns.13 It retains a coverage of about 80% of energy emissions.14 Utilities, which can pass the cost on to consumers and are thus not exempt, expected a cost increase of about 1 billion USD per year.15 No compensation lowers the small ensuing burden, predicted at JPY 1200 (USD 12) per year, on household consumers.16 Unlike in BC, this tax recycles no revenue to taxpayers, purportedly using it instead for green spending.17
iii.i.iii Norwegian environmental aviation fuel tax
The Norwegian government implemented environmental fuel taxes for aviation in 2008. It aimed to stimulate reductions in the sector’s emissions, which in 2005 comprised between 1.7 and 3.5% of Norway’s total emissions.18 A
7 Environmental Taxation Team, 2012 8 Kuramochi, 2014
9 IEA, 2016
10 Environmental Taxation Team, 2012, p.6 11 Lee et al., 2012
12 Wakiyama and Zusman, 2016
13 Environmental Taxation Team, 2012; Kuramochi,
2014
14 Kuramochi, 2014 15 Maeda, 2012
16 Environmental Taxation Team, 2012; Kuramochi,
2014
17 Carl and Fedor, 2016; Environmental Taxation
Team, 2012
www.sciencepolicyjournal.org JSPG., Vol. 12, Issue 1, February 2018
2015 government paper lists a CO2 tax of NOK 1.08 (0.13 USD) per liter of jet fuel and a NOx tax of NOK 21.17 (2.67 USD) per kg.1 The aviation tax addresses concerns about international competition by exempting international flights altogether. The exemption thus acts as a border tax adjustment. This exemption simultaneously addresses international agreements and industry concerns.2 Since 2012, flights within the EU have been subject to the EU ETS,3 removing some of the exemption’s relief.
iii.i.iv New Zealand’s emissions trading scheme New Zealand (NZ) in 2008 implemented tradable permits to lower GHG emissions. The ETS first only covered forestry (and still might be the only carbon pricing system covering that sector). However, by May 2017, the ETS covered 51% of national emissions, having added electrical generation, waste, and a few other sectors. Its permit (New Zealand Unit, or NZU) price stood at NZ$18.05 as of August 2017.4 The government alleviates business concerns in various ways. Exemptions are most prominent. Despite accounting for almost half of national emissions, agriculture is indefinitely exempt because of concerns about a lack of abatement technologies.5 The ETS also exempts the smallest actors in most sectors.
Since 2009, the ETS has also allowed 2-‐for-‐1 compliance (2 tCO2e per NZU) and had a price ceiling of NZ$25 per two tCO2e. It is currently phasing these out.6 Until June 2015, ETS actors could use Kyoto units (stemming from the international Kyoto Protocol) for flexibility. This allowance kept NZU prices quite low (such as NZ$3 in early 2013)7 and exported most emissions reductions. Simultaneously, several sectors receive free allocations of permits to reduce ETS impact. Owners of fishing quotas in 2010 received one-‐off allocations; pre-‐1990 forest owners receive allocations as
1 The Norwegian Tax Administration, 2015 2 Avinor, 2008
3 Climate Action, 2017
4 Afriat et al., 2015; International Carbon Action
Partnership, 2017
5 Afriat et al., 2015
6 Afriat et al., 2015; International Carbon Action
Partnership, 2017
7 Leining and Kerr, 2016
compensation for mandatory involvement in the ETS;8 and EITE entities receive up to 90% of their allocations for free.9 Post-‐1989 forest holders can opt in or out of the ETS altogether at will.10 NZ has substantially limited ETS scope by building in all these allowances. Exactly where C&T revenue went prior is unclear, but since 2012 the system has generated no revenue11 to recycle to affected parties.
iii.i.v The Netherlands tradable pig production permits
The 1998 Pig Production Act in the Netherlands created a system of pig production rights (PPR) to replace earlier manure production rights. PPR acted as a cap and trade on pig numbers, with 1995-‐6 numbers as the base. It called for a 10% reduction in 1998 and a further 15% reduction by 2002/3.12 Nitrogen and phosphate in pig manure eutrophicate water, harming ecosystems and diminishing recreational potential. Pig production had grown in numbers and intensity in the 1990s through technological improvements and cheaper feed,13 and the country was failing to comply with the EU’s 1991 Nitrate Directive.
The PPR system would force farmers out of the market; 3500 had exited by October 2000, and the OECD14 predicted another 10% leaving by 2002. The system also created trade concerns, although the OECD15 has found that varying manure compliance costs do not impact trade competitiveness. When hearing a challenge to the extent of pig reductions, the national high court ruled that public interest in reducing emissions supersedes pig farmer interests. Still, policymakers rightfully created compensation. It included extra PPR to farmers with existing investments in upgraded facilities (for which no farmer applied)16 and 2 billion guilders (~1.04 billion USD) to purchasing unused rights, providing job search help, screening businesses,
8 “About allocations,” 2016 9 Afriat et al., 2015
10 “About allocations,” 2016 11 Carl and Fedor, 2016 12 OECD, 2000
www.sciencepolicyjournal.org JSPG., Vol. 12, Issue 1, February 2018
and demolishing unneeded animal housing. Farmers wanting to exit the market could rely on the government buying at least 40% (in 1998) or 60% (after 1998) of their allocated PPRs at market value.1
iii.i.vi Canadian cod fishing moratorium
On July 2, 1992, the Canadian government suddenly halted all cod fishing in Newfoundland and Labrador. The 5-‐century-‐old industry had decimated stocks in recent decades. Cod comprised 48% of caught fish in the region in 1990, amounting to C$134 million. So, when cod fishing stopped, 30,000 people—12 % of the province’s labor force—lost their livelihoods.2 The Northern Cod Adjustment and Rehabilitation Program (NCARP) compensated about 28,000 of them between 1992 and 1994. NCARP included weekly payments above or beyond unemployment insurance earnings from 1989-‐91, requiring participation in basic education or professional skills courses. It alternatively offered early retirement for anyone 55-‐64 years-‐old; for anyone younger willing to leave the industry permanently, it offered a single payment of 8-‐times the value of average cod landings in the 3 best years from 1987-‐91.3 The moratorium did not end as expected in 1994 (and it continues in 2017 according to Bailey4), so the similar Atlantic Groundfish Strategy Program (TAGS) replaced NCARP in 1994. The intended 5-‐year, C$1.9 billion initiative5 exhausted its funding by May 1998.6 A separate C$15 million Vessel Support Program funded ongoing ship maintenance, and many moratorium victims received partial debt forgiveness and fee waivers.7
iii.i.vii Mexico’s Monarch Butterfly Biosphere Reserve
Mexico created the Monarch Butterfly Biosphere Reserve (MBBR) in October 1986 to preserve monarch wintering territory, expanding it in
1 OECD, 2000
2 Higgins, 2008
3 “Northern Cod Moratorium…,” 1993 4 Bailey, 2017
5 Industry Canada, 1996 6 Higgins, 2008
7 “Northern Cod Moratorium…,” 1993
2000.8 In the MBBR’s core of 13,551 hectares,9 logging is illegal. However, the area still exhibits an estimated annual forest degradation rate of nearly 3%.10 About 56.5 million monarch butterflies migrated through North America in 2014-‐15, wintering in and around the MBBR. That showed an increase of over 20 million from 2013, but still less than 6% of the 1990s population.11 Combatting forest degradation in Mexico forms part of the solution, and the MBBR does so through legislation. However, to improve compliance and compensate property owners in the core, the Monarch Butterfly Conservation Fund (MBCF) has existed since the 2000 expansion. The MBCF, managed in part by WWF Mexico, has 6.5 million USD. 5 million come from a private foundation, 1 million from the Mexican government, and 0.25 million from the two relevant state governments. The fund paid 18 USD/m3 of forfeited timber annually until 2010 to those with logging rights pre-‐2000; it also pays 12 USD per hectare of conserved forest (8 USD per hectare for those receiving the other payment). 31 of 38 eligible properties agreed to participate, 17 with pre-‐2000 logging rights.12
iii.i.viii Latvia’s designation of protected territories
In 1997, Latvia passed its law “On Specially Protected Nature Territories.”13 National or local governments establish these territories, often based on public proposals. Land owners in these territories become responsible for following all applicable regulations. This legislation and another (“On the Rights of Landowners to Compensation for Restrictions on Economic Activities in Specially Protected Nature Territories and Microreserves”) ensure compensation for these landowners.14 The establishing government funds any required preservation and maintenance, but landowners can also receive monetary reimbursement or even a land swap under certain designations. A government-‐hired forestry expert determines
8 gob.mx, 2016
9 The Associated Press, 2016
10 Baylis, 2015; Honey-‐Rosés et al., 2009 11 Baylis, 2015
www.sciencepolicyjournal.org JSPG., Vol. 12, Issue 1, February 2018
the land’s value. Land exchanges refer to the Latvian Property Evaluation; the value of the replacement must be within 20% of the original’s to avoid any extra payments. As of June 1, 2014, 2,140 microreserves and 682 specially protected nature territories exist, with the latter covering 11.5% of the country’s territory.1 European “Natura 2000” protected nature sites also fall subject to these laws. As of December 2013, Latvia has 347 “Natura 2000” sites.2 Europe sometimes sends payments to landowners in these cases.3
iii.i.ix Californian diesel standards and Carl Moyer scrappage scheme
California’s Diesel Risk Reduction Plan (DRRP) stemmed from the decision of its Air Resources Board (CARB) in 1998 to classify diesel particulate matter (PM) as a toxic air contaminant. It aimed to reduce PM 75% by 2010 and 85% by 2020 from 2000 levels.4 It created standards for new diesel engines that cut PM emissions 90%. It also created retrofit requirements, like diesel particulate filters, for existing engines.5
To help Californians comply, the Carl Moyer Program offers grants for replacement, retrofit, and repowering of engines (stationary or in vehicles) that do not meet the new standards. Grant funding initially came from the state budget, but since 2004 has come from smog check, tire, and vehicle registration fees. Individual air districts manage applications and distribution.6 The scheme has given about 1 billion USD since 1998, giving over $60 million annually in grants and covering up to 80% of a new vehicle’s cost.7 Posada et al.8 score the Carl Moyer Program at the top of their metrics for scrappage programs. They also mention the Providing Loan Assistance for California’s Equipment initiative that helps beyond the subsidies.
1 “5th National Report to the…,” 2014 2 The Supreme Council…, 2013 3 Latvia Saeima, 2009
4 DieselNet, 2006
5 CARB, 2000; DieselNet, 2006 6 Posada et al., 2015
7 CARB, 2017; Wagner and Rutherford, 2013 8 Posada et al., 2015
iii.i.x United States Clean Power Plan
The United States Environmental Protection Agency (EPA) issued its Clean Power Plan (CPP) in August 2015, following a Supreme Court ruling that CO2 qualifies as a pollutant under the existing Clean Air Act. The new administration has since halted the CPP,9 but the case still provides valuable compensation study. The Plan set state-‐specific standards for energy-‐related emissions reductions and gave states 1-‐3 years to develop reduction plans.10 It created regulatory pressure to reduce dependence on coal, affecting coal workers, of which there were between 55,00011 and 150,00012 in 2016, depending on the estimate. Kentucky alone lost 1500 coal jobs, or 17% of its total, in the first three months of 2016.13
Compensation is patchwork and mostly separate from the Plan. Existing social welfare, like unemployment benefits and the Pension Benefit Guarantee Corporation,14 is one form. The US Labor Department gave 14 million USD to “Hiring Our Miners Everyday” (HOME) for retraining and financial support, and President Obama promised 35 million USD to help workers and their communities. In Kentucky, over 3000 laid-‐off workers enrolled in HOME.15 A current bill in the House of Representatives encourages education programs to retrain “dislocated” energy workers but provides no specific funding.16 Pearce17 estimates that retraining all coal workers for solar would cost between 180 million and 1.8 billion USD; Bastasch18 also predicts that these retrained workers would earn less after a switch. Despite the CPP’s halt, coal-‐fired power plants continue to close.19
iii.ii Success of cases along judgment criteria
9 Trump, 2017
10 Hogan, 2015
11 U.S. Bureau of Labor Statistics, 2017 12 Pearce, 2016
13 Bastasch, 2016 14 Semuels, 2017 15 Bastasch, 2016 16 115th Congress, 2017 17 Pearce, 2016
18 Bastasch, 2016
www.sciencepolicyjournal.org JSPG., Vol. 12, Issue 1, February 2018
This section shows how to apply the criteria from Table 3 to the cases, giving examples of good and bad case performance for each criterion. For brevity’s sake, this report does not include analysis of each case by each criterion. However, the complete analysis feeds into the case success scores (in section 3.3) and ensuing policy recommendations.
iii.ii.i Unequal cost is addressed
This criterion asks whether compensation addresses the policy’s predicted unequal costs. The US CPP did not. For coal workers expected to lose their livelihoods, it offered no comprehensive, targeted relief. The US Congress considered allocating money to rescuing miners’ pensions,1 but never has. As section 4.2.10 describes, no efforts at retraining have received enough funding to be effective. The plan also included no compensation for coal companies themselves, leaving itself very open to political pushback.
The case of cod fishing in Canada fully addresses unequal costs, providing some level of compensation for the 30,000 people who lost livelihoods.2
iii.ii.ii Financial opportunities and satisfaction steady over time
Compensation weakens if its effect declines over time. In the case of cod fishing, although it addressed the need for compensation, that compensation has not withstood time. The moratorium continues today despite being intended for only two years,3 and compensation ended in 1998.4 Province population declined 13% between 1992 and 2007.5 The province’s shellfish industry, which grew to replace cod, now faces similar threats of stock depletion.6
In California, the Carl Moyer program has worked well since its inception in 1998. It updates periodically to keep up with changing diesel regulations.7 In addition, applicants only
1 Cama, 2016; Semuels, 2017 2 Higgins, 2008
3 Bailey, 2017 4 Higgins, 2008 5 CBC News, 2017 6 Higgins, 2008 7 CARB, 2017
upgrade a technology to meet standards once, so satisfaction has no reason to decline afterwards.
iii.ii.iii Original incentives intact; intent of policy not diminished
Compensatory mechanisms should not block policy incentives. Norway enacted its aviation fuel tax in 2008, but it exempted international flights altogether for concerns about competitiveness. Emissions data from Statistics Norway indicate that overall air transport emissions in the country have still increased 90% between 2008 and 2015. The fuel tax changed little because it removed incentives for a large segment of polluters.
In Latvia, on the other hand, a designation of protected territory is firm. Compensation for landowners, whether through monetary payments or land exchanges, does not interfere.
iii.ii.iv Harmful behavior reduces in line with objectives
This criterion asks whether an environmental policy has its intended effect. The effect depends both on good policy design and on compensation that does not interfere. In Norway, as the above section discusses, air transport emissions overall have risen. Avinor8 predicted that overall emissions in 2020 would be at 2008 levels because of reduced domestic flights, but this target now seems unfeasible.
Compensation in the Netherlands for the implementation of PPRs worked with the policy; the government paid farmers for their PPRs if they exited the market.9 The number of pigs fell from 14.4 to 11.2 million from 1995 to 2003.10 In 2009, it was around 12.1 million (the system’s cap stands around 12 million).11
iii.ii.v Policy is extensive and true to polluter pays principle
An environmental policy addresses environmental externalities, and it should cover as many producers of that externality as possible. By definition, policies that use
8 Avinor, 2008
www.sciencepolicyjournal.org JSPG., Vol. 12, Issue 1, February 2018
substantial exemptions as compensation do not meet this criterion. Exemptions compose much of the compensation for Norway’s aviation fuel tax, Japan’s carbon tax, and New Zealand’s ETS.
Canada’s cod fishing moratorium did extensively honor the PPP. Cod stocks were very rapidly depleting, so the moratorium halted all fishing of cod.
iii.ii.vi Compensation increases support for policy; opinion of policy/government is steady
Decreasing political pushback acts as one motivation for compensation, so compensation should increase a policy’s public support. Compensation for the US CPP did not achieve increased support. Anti-‐CPP sentiment has flourished. 27 states and several business groups challenged the plan in courts, leading to its initial pause by the Supreme Court in February 2016.1
The BC case fared better by this criterion. The province already showed the strongest concern for climate change among Canadian provinces,2 and compensation visibility has always been high. A clear compensatory mechanism led to majority support for the tax from the beginning.3
iii.ii.vii Policy/compensation satisfaction and visibility are steady over time
High visibility over time helps maintain policy satisfaction. The Canadian government miscalculated its cod fishing moratorium, so a policy intended for two years has lasted nearly 25. Compensation funds ran out in May 1998,4 but economic stagnation has lingered.
In contrast, BC’s compensation visibility has remained high. The Ministry of Finance must annually file a report detailing its use of carbon tax revenue. This action appeases sceptics of the government’s promise to keep the tax revenue
1 Hurley and Volcovici, 2016 2 The Environics Institute, 2015 3 Murray and Rivers, 2015 4 Higgins, 2008
neutral.5 It also accounts for the OECD’s warning about compensation being quickly forgotten.6 A Green Fiscal Commission 2009 study indicated that public support for environmental taxes grew substantially with proven, not just promised, revenue recycling. Accordingly, opposition to the BC tax from both the public and businesses has decreased over time; among the public opposition fell from 47% to 32% between 2009 and 2015.7
iii.ii.viii Compensation is fair and inclusive of affected parties
Compensation should fairly target all bearers of unequal costs. Japan’s carbon tax and New Zealand’s ETS both use exemptions to compensate EITE industries. However, neither accounts for potential distributional impacts from carbon pricing. In both cases the impact is likely low (Kuramochi8 writes of an increased household tax burden in Japan of around 12 USD per year), but addressing this impact is still good practice.
The MBCF is inclusive of all 38 affected landowners in the MBBR; 31 decided to participate and receive payments for lost forestry income.9
iii.ii.ix Transparency: the relevant public is well-‐ informed of the issue and targets
In all studied cases, no environmental policy seems to have entirely taken by surprise its affected public. In Japan and New Zealand, for example, carbon pricing systems emerged within a framework of existing climate change policies and international commitments. The New Zealand ETS was a 2008 amendment to the 2002 Climate Change Act, which the government passed to address Kyoto commitments.10
iii.ii.x Compensation is not redundant (covered sufficiently by another source)
All studied cases exhibit a need for their compensatory mechanisms unmet by existing frameworks. The Latvian legislation additionally
5 Murray and Rivers, 2015 6 OECD, 2006