Organized by C.O.E.T, Akola. Available Online at www.ijpret.com7
INTERNATIONAL JOURNAL OF PURE AND
APPLIED RESEARCH IN ENGINEERING AND
TECHNOLOGY
A PATH FOR HORIZING YOUR INNOVATIVE WORK
WIND ENERGY CONVERSION SYSTEM: AN EVALUATION
S. R. KALBANDE1, V. P. KHAMBALKAR2 1. Department of Un-conventional Energy Sources & Electrical Engineering.
2. Dr Panjabrao Deshmukh Agricultural University, Akola - 444 104, (MS), India.
Accepted Date: 12/03/2016; Published Date: 02/04/2016
Abstract: Wind resources in India found to be most viable and reliable energy generation sources among the all renewable. It is free and perennial energy source. The environmental problem of the others power sources has leads the wind energy as clean energy worldwide. The estimated power potential of the wind energy in India is approximately about 45000 to 48000 MW. The installed capacity of wind power turbine in India is about 25188 MW up-to end of January, 2016. This paper narrates the state-of art review of the wind conserving systems and the related issues.
Keywords: Wind resources, assessment, turbine, conversion systems
Corresponding Author: MR. S. R. KALBANDE
Co Author: MR. V. P. KHAMBALKAR
Access Online On:
www.ijpret.com
How to Cite This Article:
S. R. Kalbande, IJPRET, 2016; Volume 4 (8): 7-13 PAPER-QR CODE
SPECIAL ISSUE FOR
NATIONAL LEVEL CONFERENCE
"RENEWABLE ENERGY
Organized by C.O.E.T, Akola. Available Online at www.ijpret.com8
INTRODUCTION
Wind energy relies, indirectly, on the energy of the sun. A small proportion of the solar radiation received by the Earth is converted into kinetic energy the main cause of which is the imbalance between the net outgoing radiation at high latitudes and the net incoming radiation at low latitudes. The Earth’s rotation, geographic features and temperature gradients affect the location and nature of the resulting winds. The use of wind energy requires that the kinetic energy of moving air be converted to useful energy. As a result, the economics of using wind for electricity supply are highly sensitive to local wind conditions and the ability of wind turbines to reliably extract energy over a wide range of typical wind speeds. Wind energy is playing a critical role in the establishment of an environmentally sustainable low carbon economy. This chapter presents an overview of wind turbine generator technologies and compares their advantages and drawbacks used for wind energy utilization. Traditionally, DC machines, synchronous machines and squirrel-cage induction machines have been used for small scale power generation. For medium and large wind turbines (WTs), the doubly-fed induction generator (DFIG) is currently the dominant technology while permanent magnet (PM), switched reluctance (SR) and high temperature superconducting (HTS) generators are all extensively researched and developed over the years. In this chapter, the topologies and features of these machines are discussed with special attention given to their practical considerations involved in the design, control and operation.
Wind energy use:
mid-Organized by C.O.E.T, Akola. Available Online at www.ijpret.com9 1900s. The primary use of wind energy of relevance to climate change mitigation is to generate electricity from larger, grid-connected wind turbines, deployed either in a great number of smaller wind power plants or a smaller number of much larger plants. As of 2010, such turbines often stand on tubular towers exceeding 80 m in height, with three-bladed rotors that often exceed 80 m in diameter; commercial machines with rotor diameters and tower heights in excess of 125 m are operating, and even larger machines are under development. Wind power plants are commonly sited on land (termed ‘onshore’ in this chapter): by the end of 2009, wind power plants sited in sea- or freshwater were a relatively small proportion of global wind power installations. Nonetheless, as wind energy deployment expands and as the technology advances, offshore wind energy is expected to become a more significant source of overall wind energy supply.
Wind Energy in India:
In 2012, despite a slowing global economy, India’s electricity demand continued to rise. Electricity shortages are common, and over 40% of the population has no access to modern energy services. India’s electricity demand is projected to more than triple between 2005 and 2030. In the recently released National Electricity Plan (2012) the Central Electricity Authority projected the need for 350-360 GW of total generation capacity by 2022. Despite major capacity additions over recent decades, power supply struggles to keep up with demand. India had another record year of new wind energy installations between January and December 2011, installing more than 3 GW of new capacity for the first time to reach a total of 16,084 MW. As of March 2012, renewable energy accounted for 12.2 percent of total installed capacity, up from 2 percent in 1995. Wind power accounts for about 70 percent of this installed capacity. By the end of August 2012, wind power installations in India had reached 17.9 GW. Under the New Policies Scenario of the World Energy Outlook (2011), total power capacity in India would reach 779 GW in 2035. To reach 779 GW in 2035, capacity must grow at a CAGR of 5.9 percent, or over 20 GW per year from 2009 through 2035. The largest addition per year up to now was nearly 18 GW during fiscal year 2011-20123; this scale of expansion could pose a challenge for the government [IEA,2012] without a significant role for renewables. During fiscal year 2011-2012 wind energy alone delivered over 3GW to India’s new installed capacity, accounting for over 16.5 percent of total new installed capacity.
Wind Resource Assessment Systems
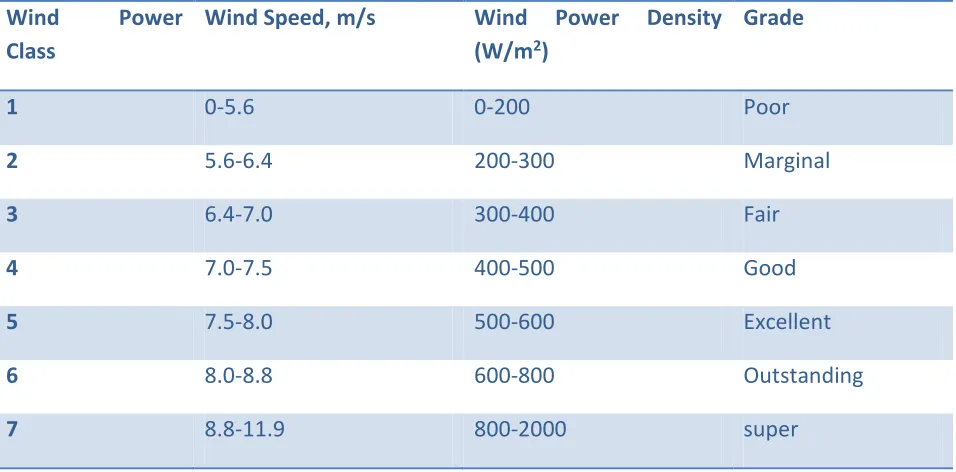
Organized by C.O.E.T, Akola. Available Online at www.ijpret.com10 resource assessment programme started in 1986 and dedicated wind monitoring towers and instruments are being used for the study. Till now about 700 dedicated wind measurement stations are established covering all parts of the country. The height of wind mast / towers used in Indian Wind Resource programme were of 20 m, 25 m, 50 m in earlier days and the same are now increased to 80 m, 100 m and 120 m. Accurate measurements of wind speed and turbulence structure of boundary layer at turbine hub height is very essential. To get accurate measurements of wind profiles instrumented meteorological masts, remote sensing system and virtual data screening system are there. Wind resource measurement by instrumented meteorological mast at any potential location should be such that it needs to meet the wind energy programme objective. The programme should cover at least the following parameters i.e. (a) Measurement parameters, (b) Equipment type and quality, (c) Measurement accuracy, duration and data recovery, (d) Sensor measurement level, (e) Data sampling and recording intervals, (f) Data storage format, (g) Data processing procedure and (h) Data reports. But deployment of instrumented meteorological mast is expensive especially in complex terrain and extrapolation of data to higher altitude is not reliable and does not accurately reflect the true vertical profile structure. The wind class definition is given in Table 1.
Table 1: Wind class definition at 50 m wind mast
Wind Power
Class
Wind Speed, m/s Wind Power Density
(W/m2)
Grade
1 0-5.6 0-200 Poor
2 5.6-6.4 200-300 Marginal
3 6.4-7.0 300-400 Fair
4 7.0-7.5 400-500 Good
5 7.5-8.0 500-600 Excellent
6 8.0-8.8 600-800 Outstanding
7 8.8-11.9 800-2000 super
Organized by C.O.E.T, Akola. Available Online at www.ijpret.com11 Sun is the main source of all renewable energy on earth including wind. The earth’s rotation and uneven heating of earth’s surface leads to increase in the momentum of air motion known as wind. Wind energy extractable by the present technological advancements is bounded between the ground and a height of less than 200 meters. The wind because of its proximity to the ground surface is affected by surface friction. The atmospheric layer where roughness plays a vital role is known as surface layer. The power in the wind is given by the equation;
Where Pd = Wind Power Density in watts
ρ = Air Density in kg/m3
u = Mean Wind Speed in m/s
Wind profile varies depending on location, seasonal variation as well as time of day variation or diurnal variation, which are fairly predictable.
Wind turbine
A wind turbine produces power by converting the force of the wind (kinetic energy) acting on the rotor blades (rotational energy) into torque (turning force or mechanical energy). This rotational energy is used either within a generator to produce electricity or, perhaps less commonly, it is used directly for driving equipment such as milling machines or water pumps (often via conversion to linear motion for piston pumps). Water pumping applications are more common in developing countries. Usually wind energy systems are classified in three categories: grid-connected electricity generating, stand-alone electricity generating (often subdivided into battery-based or autonomous diesel, the later having automatic start-up when the wind speed falls, although diesel generators may also be used within stand-alone battery systems) and mechanical systems. Table 2 depicted the application of wind energy in various utilities.
Table 2: Application of wind energy
Organized by C.O.E.T, Akola. Available Online at www.ijpret.com12
Wind to electric Grid connection Power for the national grid
Stand alone with battery bank
Domestic, navigation, pumping, remote utilities etc
Wind to mechanical Water pumping Supply of water, irrigation, dewatering etc,
milling grain and agricultural application
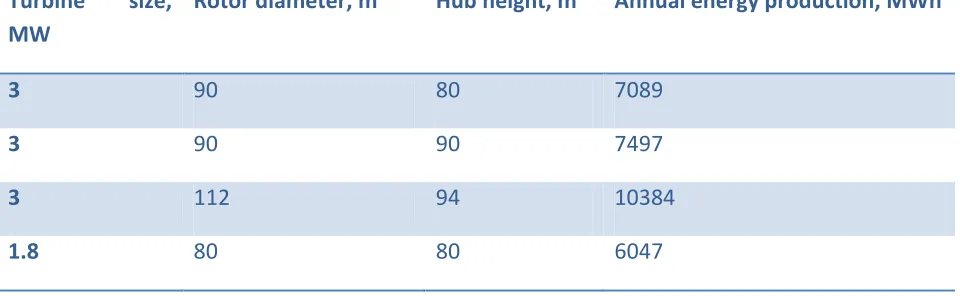
The maximum energy than can be harnessed by a wind turbine is roughly proportionally to the swept area of the rotor. Blade design and technology developments are one of the keys to increasing wind turbine capacity and output. By doubling the rotor diameter, the swept area and therefore power output is increased by a factor of four. Table 3 presents an example of the impact of different design choices for turbine sizes, rotor diameters and hub heights.
Table 3: Impact of turbine sizes on energy production (adapted from Source: Nielsen, et al., 2010)
Turbine size,
MW
Rotor diameter, m Hub height, m Annual energy production, MWh
3 90 80 7089
3 90 90 7497
3 112 94 10384
1.8 80 80 6047
CONCLUSIONS:
The energy from wind has predicted up to 10% of global electricity supplies by 2030 are feasible, assuming that cost and policy factors are favorable towards wind energy deployment. It is clean resources available worldwide for harnessing. The technological advancement in the turbine has lead the cost effective conversion and the life cycle cost of energy is low as compared to many others resources.
Organized by C.O.E.T, Akola. Available Online at www.ijpret.com13 1. Ackermann, T. (ed.) (2005). Wind Power in Power Systems. John Wiley and Sons, London, UK.
2. Ackermann, T., and L. Soder (2002). An overview of wind energy-status 2002. Renewable and Sustainable Energy Reviews, 6, pp. 67-127.
3. Apt, J. (2007). The spectrum of power from wind turbines. Journal of Power Sources, 169, pp. 369-374.
4. Archer, C.L., and M.Z. Jacobson (2005). Evaluation of global wind power. Journal of Geophysical Research, 110, D12110.
5. AWEA (2008). Wind Energy Siting Handbook. American Wind Energy Association, Washington, DC, USA, 183 pp.
6. Barthelmie, R.J., and L.E. Jensen (2010). Evaluation of wind farm efficiency and wind turbine wakes at the Nysted offshore wind farm. Wind Energy, 13, pp. 573-586.
7. Bastasch, M., J. van-Dam, B. Sondergaard, and A. Rogers (2006). Wind turbine noise – An overview. Canadian Acoustics, 34, pp. 7-15.
8. Bengtsson, L., K.I. Hodges, and N. Keenlyside (2009). Will extra tropical storms intensify in a warmer climate? Journal of Climate, 22, pp. 2276-2301.
9. Benitez, L.E., P.C. Benitez, and G.C. van Kooten (2008). The economics of wind power with energy storage. Energy Economics, 30, pp. 1973-1989.