Internetworking
Indonesia
Journal
olume 5
umber 1
13
ISSN: 1
942-9
703
IIJ © 20
13
www
.Int
erne
tw
or
kingIndonesia.or
g
Editors’ Introduction
1
Web-based Mobile Client and Server Grid Data Service
3
for Accessing High Resolution Weather Information
Teddy Mantoro, Wido Hanggoro and Media A. Ayu
Material Flow Data Representation and Integration Based on STEP 11
N. Shariatzadeh, G. Sivard and M. Hedlind
Intellectual Property Right Dissemination Service Based 21
On Mobile User Location in Indonesia
Teddy Mantoro, Yoga Prihastomo and Media A. Ayu
Adaptive Behavior of Evolvable Neurocontroller 31
for Obstacle Avoidance Mobile Robot
Aloysius Aldo Gani, Sofyan Tan and Meiliayana
The International Journal of ICT and Internet Development
Series B: Computing, Communications, Engineering and Internet Technologies
Influences of Wireless Traffic toward WiFi Performance: 37
Case Study at BINUS Square - Jakarta
Internetworking Indonesia Journal
The International Journal of ICT and Internet Development ISSN: 1942-9703
www.InternetworkingIndonesia.org
The Internetworking Indonesia Journal (IIJ) is a peer reviewed international journal devoted to the timely study of Information and Communication Technology (ICT) and Internet development. The journal seeks high-quality manuscripts on the challenges and opportunities presented by information technology and the Internet, and their impact to society. The IIJ is published electronically based on the Open Access Publication Policy, and the journal is indexed by SCOPUS and Google Scholar. Papers in the IIJ appear in one of two series:
Journal mailing address: Internetworking Indonesia Journal, PO Box 397110 MIT Station, Cambridge, MA 02139, USA.
Series B of the Internetworking Indonesia Journal covers the broad technical areas of computing, communications, engineering and Internet Technologies.
Possible topics for papers include, but are not limited to the following: • Information technology and information systems
• Communications technology • Software and hardware engineering • Algorithms and computation • Applications and services
• Broadband and telecommunications technologies • Mobile and wireless networks
• Internet infrastructure systems, protocols, standards and technologies
• Multimedia and content development • Education and distant learning
• Open source software development and deployment • Cloud Computing, SaaS, and Grid Computing Series B:
Computing, Communications, Engineering & Internet Technologies
• Series A: Community Informatics & Society • Series B: Computing, Communications, Engineering & Internet Technologies
Prof. Edy Tri Baskoro, PhD (ITB, Indonesia) Mark Baugher, MA (Cisco Systems, USA) Lakshminath Dondeti, PhD (Qualcomm, USA) Paul England, PhD (Microsoft Research, USA)
Brian Haberman, PhD (Johns Hopkins University, USA) Prof. Svein Knapskog, PhD (NTNU, Norway)
Prof. Bambang Parmanto, PhD (University of Pittsburgh, USA)
Prof. Wishnu Prasetya, PhD (Utrecht University, The Netherlands) Graeme Proudler, PhD (HP Laboratories, UK)
Prof. Susanto Rahardja, PhD (NUS, Singapore)
Prof. Jennifer Seberry, PhD (University of Wollongong, Australia) Prof. Willy Susilo, PhD (University of Wollongong, Australia) Prof. David Taniar, PhD (Monash University, Australia) Thomas Hardjono, PhD
(MIT, USA)
Budi Rahardjo, PhD (ITB, Indonesia)
International Advisory Board Series B:
Co-Editors
Technical Review Board Moch Arif Bijaksana, MSc (IT Telkom, Indonesia)
Teddy Surya Gunawan, PhD (IIUM, Malaysia)
Brian Haberman, PhD (Johns Hopkins University, USA) Dwi Handoko, PhD (BPPT, Indonesia)
Martin Gilje Jaatun, PhD (SINTEF, Norway) Endra Joelianto (ITB, Indonesia)
Mira Kartiwi, PhD (IIUM, Malaysia) Maciej Machulak, PhD (Google, USA) Ihan Martoyo (UPH, Indonesia)
Jesus Molina, PhD (Fujitsu Laboratories of America) Bobby Nazief, PhD (UI, Indonesia)
Anto Satriyo Nugroho, PhD (BPPT, Indonesia) Muhammad Suryanegara (UI, Indonesia)
Bernardi Pranggono, PhD (University of Leeds, UK) Bambang Prastowo, PhD (UGM, Indonesia) Bambang Riyanto, PhD (ITB, Indonesia) Andriyan Bayu Suksmono, PhD (ITB, Indonesia) Setiadi Yazid, PhD (UI, Indonesia)
ELCOME to the first issue of the Internetworking Indonesia Journal in 2013. This issue carries three papers from the 2nd IEEE Conference on Control, Systems & Industrial Informatics (ICCSII), which was held in Bandung, Indonesia in June 2013. The remaining two papers are the regular papers received by the IIJ.
The first paper covers a project on a client and server system that provides weather predictions to its end-user. As may be evident to the readership of the IIJ, a weather reporting and prediction system is valuable to many developing nations, particularly those with a considerable agrarian sector. The paper looks at the management of high-resolution weather data, with the aim of improving the dissemination of information. The paper proposes the use of a web-based data inquiry/access solution which is accessible via mobile devices. The implementation uses the numerical weather prediction model as the basis for obtaining high-resolution predictions. The project was implemented using open source software in order to reduce development costs.
The second paper reports work done at the Royal Institute of Technology (Department of Industrial Production) in Sweden. In broad terms the work seeks to include manufacturing information (typically stored in CAD/CAM systems) into Discrete Event Simulation, by using ISO 10303 Application Protocol 214 (STEP AP214). The aim of the work is among others to improve data management architectures for capturing, structuring, storing and exchanging process specifications.
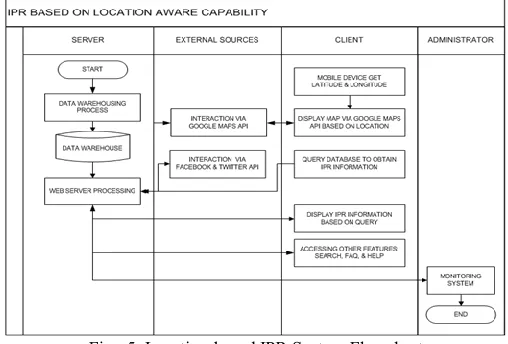
The third paper reports on a project in Indonesia which seeks to make Intellectual Property (IP) information more accessible to mobile devices. This is due to the fact that the many islands in the country are not as yet connected to the Internet backbone of Indonesia. Hence, mobile phones and smartphones are the main client-side system available to the majority of people in Indonesia. The paper presents a number of interesting background data regarding the IPR applications received by the various branch offices of the Directorate General for IPR in Indonesia. In itself the paper represents an interesting snapshot of efforts to provide digital services to the public in Indonesia using the available technologies, in this case mobile devices.
Robotics is the topic of the fourth paper, which belongs in the regular section of this journal issue. A mobile robot is designed using an artificial neural network-based controller (or neurocontroller), which allows it to learn adaptively. The neurocontrollers of interest are those which evolve according to the determined genetic algorithm. Here the chromosome of
The editors can be reached individually at the following email addresses. Endra Joelianto can be reached at [email protected]. Thomas Hardjono is at [email protected], Budi Rahardjo is at [email protected], Henri Uranus is at [email protected].
each individual neurocontroller is defined to be the binary weights of the connections, while the fitness function is a simple rule for obstacle avoidance behavior. Prior to programming into the mobile robot, the best neurocontroller behavior is analyzed and selected through computer simulation. Although the chromosome is simple and only encodes the weight connections, the simulated evolution of the neurocontrollers has produced a neurocontroller that possess the obstacle avoidance behavior. The best neurocontroller simply controls the mobile robot to rotate left whenever the front and sides sensors detect an obstacle. Only after the obstacle is at the back of the mobile robot would it then move forward away from the obstacle. An important finding is that the three rear distance sensors are actually not important for the mobile robot to possess the obstacle-avoidance behavior. The last paper in this journal issue reports on some problems and solutions pertaining to the roll-out of Wi-Fi services within a campus dormitory. The authors found that some user behavioral patterns affected the over performance of the Wi-Fi performance, and sought to develop some models to explain in greater clarity the problems faced.
Endra Joelianto (Guest Editor) Thomas Hardjono Budi Rahardjo Henri Uranus
Editors’ Introduction
Abstract—The new era of forecast decision model was led by the usage of numerical weather prediction to ensure forecast accuracy. Weather information providers give accuracy, speed and appropriate information to different basic needs of the users. Unfortunately, service providers that meet those three criteria are still rare (especially in developing countries). A combination of PC-Cluster, NWP (Numerical Weather Prediction) and GDS (Grid Data Service) can be used as a low-cost solution in providing weather information which meets those three criteria. This paper presents a proof-of-concept web-based application using GrADS (Grid Analysis and Display System), GrADS Data Server, and GrADS interface to PHP. This was designed to give access to the weather online database to the server-side, which can then assist users from the mobile client in representing the weather prediction. Although the features of the resulting information service (Web Service, GDS and User defined data access) can already assist users in accessing weather information, improvements are still needed especially for delivering of high resolution weather information.
Index Terms—Grids data server, weather information, NWP, high resolution weather.
I. INTRODUCTION
ITH the increasing in the incidence of disasters caused by weather factors, there is public awareness of the need for weather information which is delivered fast, precise and accurate as absolutely indispensable. Weather information, in general and specific terms, given to certain sectors – such as agriculture and transportation – are also needed. In addition, the information provided should be easily
Teddy Mantoro is with the Faculty of Science & Technology, Siswa Bangsa International University, Jl. MT Haryono Kav. 58-60,Jakarta Selatan, 12780, Indonesia. He is also at the Advanced Informatics School, University of Technology Malaysia. He can be reached at: [email protected].
Wido Hanggoro is with the Indonesia Meteorological Climatological and Geophysical Agency, Jl. Angkasa I No.2, Kemayoran Jakarta Pusat, Indonesia. He can be reached at: [email protected].
Media A. Ayu is with the Department of Information Systems, KICT, International Islamic University Malaysia, Kuala Lumpur 53100 Malaysia. Her email address is [email protected].
and quickly accessible (i.e. mobile).
The accuracy of weather forecasts is strongly influenced by the spatial resolution of the information provided. So as to obtain accurate results, the forecasts should have a resolution that can describe the dynamics of the atmosphere in the region. This typically requires higher resolutions.
Nowadays, there are numerous options to obtain the weather information while mobile, either through websites or mobile weather applications which can be accessed via computers or mobile devices such as smartphones.
Although the forecast information provided needs to have good accuracy and delivered fast, the National Weather Office (NWO) is also required to provide information that can be easily understood by the general public.
In relation to the weather information, business process models used to describe weather analysis and forecasting has been evolving due to the presence of numerical weather prediction (NWP) [1]. Traditionally, weather information was read from the subjectivity of the forecaster’s analysis. Thus the accuracy of the prediction was, more or less, dependent on the skill and knowledge of each forecaster. New business processes minimize the human factor by using NWP as a weather analyst and examined the dissemination of weather information. This business process still uses forecasters to verify the NWP output and calculate the forecast uncertainty for decision-making [2].
In addition to the benefits of NWP methods, there are some variables that need to be considered, ensuring the accuracy of the weather information provided. Other methods that are used for weather predictions often have results that are less than the NWP expectations. Therefore, we need more improvements to increase the accuracy of the NWP model. Furthermore, according to Hawick [3], spatial environment datasets (especially with high resolution information) still has many challenging problems with regards to storage, access and processing.
NWP is used to get high resolution weather forecast. NWP is described as a collection of computer programming languages which is a numerical representation of the physical
Web-based Mobile Client and Server Grid Data
Service for Accessing High Resolution Weather
Information
Teddy Mantoro,1,2 Wido Hanggoro3 and Media A. Ayu4
1Universitas Siswa Bangsa Internasional, Jakarta, Indonesia
2University of Technology Malaysia, Kuala Lumpur, Malaysia
3Indonesian Meteorological Climatological and Geophysical Agency, Jakarta, Indonesia
4International Islamic University Malaysia, Kuala Lumpur, Malaysia
4 INTERNETWORKING INDONESIA JOURNAL MANTORO ET AL.
and dynamic equations that occur in the atmosphere (represented in the spatial grids). Therefore, the calculation of physical and dynamic equations is complex and the number of spatial grids is huge. It can only be done with High Performance Computing (HPC).
This paper studies the management of high-resolution weather data to improve the dissemination of information through the development of a NWP web-based data inquiry. It also looks at obtaining high-resolution weather predictions using the NWP model and the configuration of hardware and software (Open Source), including access to the NWP output data with features for users who have differing weather information needs.
The remainder of this paper is organized as follows: Section 2 discusses some related works on weather data service. Section 3 discusses an overview of grid computing for weather information. Section 4 briefly presents the server side of web-based grid data service and the mobile client is discussed in Section 5. Section 6 presents the result and discusses the weather information service. Section 7 concludes the paper and outlines areas for future work.
II. RELATED WORK
Management of huge distributed and shared data resources efficiently within wide area networks has been a topic for both scientific research and commercial application for some time now [4]. The National Weather Services (NWS) in developing countries – which usually has poor Internet bandwidth, limited infrastructure and lack of human resources – faces a more significant problem. Hence, any proposed solution to solve the problem of the dissemination of weather information in developing countries should be low cost, adaptable and applicable.
Over the years scientists have developed many proposals to eliminate the gap for distributing the weather information (please refer to Table I). One of the most referenced systems is NOMADS (NOAA Operational Model Archive and Distribution System). It aims to build a public data center that can serve environmental datasets from NOAA and other organizations [5]. There are also plug-and-play applications such as DAPPER [6], THREDDS [7], and ERDDAP [8] that basically use OPeNDAP [9] as a protocol for delivering the huge amounts of data. For specific NWS purposes there are the KNMI (Koninklijk Nederlands Meteorologisch Instituut) Climate Explorer [10] and the ECMWF (European Centre for Medium-Range Weather Forecasts) MARS [11], while GrADS DODS [12] are the simplest applications that deliver GrADS readable format through online access.
In general there are three types of data access services on NOMADS server:
• Direct Client Access • Live Access Server • Data Portals
Due to its convenience level, NOMADS has become one of the more frequently accessed servers. Nevertheless the application of that system for most countries (especially
developing countries) is hard to implement. We believe the simplest way is to adopt some of these systems and apply them as needed to the specific situation.
Fig. 1. The NOMADS Philosophy (redrawn and simplified from [13])
Table 1: Research on Weather Information Systems Database
Research Paper Tools Result The Real NOMADS Project:
Access to Operational Model Data and Value Added Products
OPenDAP, CGI GDS Server,
pdisp and ftp2u application Thematic Real-Time
Environmental Distributed Data Services (THREDDS)
OPeNDAP, OGC Web Coverage Service, NetCDF
subset, HTTP file
transfer services and XML Web based server, Live Access server, INGRID and GDS DAPPER: An OpenDAP
Server for In-Situ Data
OPeNDAP, NetCDF, Java NetCDF Library,
Web based server and DCHART application ERDDAP-The
Environmental Research Division’s Data Access Program OPenDAP, WCS, SOS, OBIS Web based application handling many output format KNMI Climate Explorer: A
Web-based Research Tool for High-Resolution
Paleoclimatology
FORTRAN, CGI, GrADS, CDO, NCO, netCDF, Lapack dan Blas
Web based server including statistical analysis MARS, ECMWF’s
Meteorological Archive: Experience in Managing a Large Archive
FORTRAN dan C, Java
MARS language and web based application The GrADS-DODS Server:
An Open-Source Tool for Distributed Data Access and Analysis
OPenDAP, XML,
Java Online database server
netCDF, HDF, GRIB WMO and BUFR WMO. Analysis tools that have been able to use OPENDAP data are: GrADS, Ferret, Matlab, IDL [14].
III. SYSTEM OVERVIEW
In grid computation, which needs intensive computation power such as in NWP, the resource required is dependent on the amount of computation to be performed. Weather predictions on a large area such as Indonesia, obviously needs a heavy duty computing machinery to deliver daily weather predictions on time as a part of the system decision support. Several projects related to the usage of PC Clusters have been established in many disciplines [15]. To get excellent output, cluster computing is used especially in monitoring its operations, in debugging, in failure detection and for performance optimizations [16]. One example is the use of parallel computing technology embedded in a distributed system, providing an ideal and practical solution for multi-site organizations and especially for government agencies who need to extract the best value from bulk geographic data in GIS systems [3].
System requirements needed to run the NWP is dependent on the amount of computation to be performed. As the number of grid points that are calculated increases, the workload of the computers will also increase. According to [17], the minimum computer equipment needed to run one of the NWP models WRFEMS (Weather Research and Forecasting Environmental Modeling System) is a premium-class computer with at least 4GB of physical memory. However, in actuality this depends on the amount of computation to be performed.
A. NWP Computation Model
The main problem encountered in running the NWP is the needs of computing processing. The use of PC-Clustering (a collection of several PCs connected through a network [1]) is one solution to obtain large computational grid data at low cost [19-20].
HPC architectures (such as multi-core, multi-processor HPC platforms with access to fast networks) have an influence on the overall performance of an application [21].
A network consisting of one cluster master node and the 4 client nodes are used to perform computations. The server has an Intel specification (R) Xeon (R) E5640 2.66GHz 24 processor and 16GB of memory use for each server. The network is connected with Fast-Gigabit Ethernet switches for data traffic to cope with rapid and large data access.
To apply a cluster system to this problem area, we also require software that can integrate the entire computing systems in the cluster to serve a job. One such software is MPI (Message Passing Interface), which is a platform in a distributed-memory parallel super computer, where a process can be run separately in a communication node and use the High-Performance Switch [22].
This system uses MPICH (Message Passing Interface Chameleon) for the optimization of the cluster without
disturbing any other processes running on the same system [22]. In other words, the process can be done multiple ways and aimed only at specific nodes. However, for reasons of computational requirements, all nodes (including the master node) are used to process data.
Fig. 2. Hardware configuration
B. Weather Data Acquisition
The environmental data, such as atmospheric variable, is highly dynamic. As such the data input needed to predict the weather should be recent information in order to maintain the rapid changes in any parameter predicted [23]. Brusch [24] used the latest environmental information that uses radar and satellite data to provide storm prediction information. Kang also achieved this using AWS data to gain daily weather information to predict plant diseases [25]. Despite this, the basic understanding of the NWP and the weather is still required [26].
C. Grid Analysis and Display System (GrADS) Data Server
The main reason for using this application is that GrADS was commonly used by forecasters worldwide and is able to read 5 dimensions of data; 4 of which are commonly used in regular dimensional weather data (latitude, longitude, altitude and time level) and one other dimension that is used for the ensemble [27].
GDS allows users to access, to manipulate and to display data in a GrADS format via the GDS (online data server). GDS uses a combination of GDS and OPENDAP (the Open source Project for a Network Data Access Protocol) software, formerly known as DODS (Distributed Oceanographic Data System), to produce open-source solutions of weather information data services [28].
6 INTERNETWORKING INDONESIA JOURNAL MANTORO ET AL.
PC-Cluster specifications was set-up, with two 8 TB Network Attached Storage (NAS) for data storage.
Figure 3 shows a flow diagram of a GDS, which requires implementation of Java servlet on the server side. The Jakarta Project's Tomcat package serves as a servlet execution environment so that the data is accessible via the internet.
Fig. 3. GDS work flow [12]
All configurations are handled by a server configuration file in XML format which also defines the data that we want to display. The configuration file also gives control over resource usage of the GDS server. An administrator can restrict the use of CPU and memory to a request for access by restricting the number of users and the maximum size of a subset of the data cache [30].
GDS provides a server that can manage and serve the weather data. The server can easily be used to share data with others and can be used internally to reduce the load on the network access [30].
IV. WEB-BASED SERVER
Although GDS has been able to deliver NWP data as an online-ready access product, typically not every user or forecaster has the ability to useit with certain applications, such as GrADS or MATLAB. It is also more time consuming to display any images or data extraction using that application with several codes needed, rather than accessing it under web-based service (user friendly application).
Improvements have been made to bypass the difficulties using GDS under a third party application, by using a PHP interface for GrADS. The PHP interface for GrADS is an alternative method of scripting GrADS that can take advantage of the unique capabilities of PHP [31].
A. Basic Features
This application simply delivers all of GrADS basic
features into a web application. Users freely choose any settings to display value or images on certain locations or area by changing input values on the left side panel to display on the right side panel (saving images by using right click). Previously users needed to type a few lines of code to get the same output using a third party application. This application is also able to handle animated images by choosing a certain option provided. By choosing the latitude and longitude, users can easily pan their domain interest across Indonesia region.
Fig. 4. Web-based Database Service Layout
The forecast information provided by the server is made available up to three days, within hourly time resolution with initial condition provided three days backwards. However, only basic weather parameters, such as precipitation, temperature and humidity at any certain pressure level are provided. To access more parameters, users can use the features of GDS.
Display features are divided into four groups based on how many varying dimensions are inserted. If there are no varying dimensions, the output panel will display the value of the parameter in a certain location, but if there is at least one varying dimension the output will be a graphic image (Figure 5). This web-based application is also capable of providing display output if there are four varying dimensions inserted that typical third applications, such as grads, are not capable of doing.
GDS link was provided to check the availability of the data. The full list of metadata should be checked using this link. It is very useful to browse the data, especially for new users. It also has direct access to data location that can be accessed using third party applications.
B. Raw NetCDF Data Access
identify atmosphere phenomena or verify the model output with some observation data. Hence, we provide an access button to download the data (in the NetCDF format) that is easily modified by users using the menu panel. The full feature of this application is provided in Figure 4.
To decrease the size of the downloaded file the NetCDF file is compressed into a zip file, reducing the time required for the download.
V. MOBILE GRID DATA
To obtain the data grid, we used the Weather Research and Forecasting Environmental Modeling System (WRF EMS) software, which is one of the NWP models. According to Rozumalski [4], the WRF EMS is a complete NWP model and is simple to use with a basic knowledge of NWP and the weather data. Compare with other NWP models the WRF EMS is more intended for operational use of weather forecasts than a model intended for research purposes.
There are several steps to obtain estimates of the output data grid in the WRF EMS model. The details are presented in Figure 5.
Fig. 5. WRF EMS flow diagram [4]
The first step is setting up a domain or local area that we want to predict. In this case, the predictions were made for a resolution of 27 km area in Indonesia with the following specifications:
• Latitude-19.47° to 27.71° • Longitude 79.97° to 169.74°
• Altitude (pressure level) 1013mb to 10mb • Time steps 1 – 73 hours
These specifications are required by the NWP models to prepare the data information such as the study area,
topographic data, the soil type and land use.
NWP Data input is obtained from GFS (Global Forecast System) NOAA which has a spatial resolution of 0.5 °. The data is downloaded each time a model needs to output a prediction. The results of processing these data will be data grid to be used as a source of weather information.
The total time needed from the HPC initial data preparation to obtain the output of the data grid is approximately 3 hours, using the HPC 5 nodes and a large output file about 2GB.
VI. RESULTS AND DISCUSSION
NWO, as a weather service provider, is usually thought to display information that is easily understood by users. Therefore, the information displayed is usually very diverse depending on the needs and knowledge of the users.
By using a combination of GDS, GrADS and GrADStoPHP software, we have built a web application that bridges the information needs of users with different requirements. The application of weather information is running in real-time online; as such it can be easily accessible. Moreover, simple computations of these data with the help of GDS can also be done.
To provide output data that is informative, we developed three (3) types of services that can provide information services to users who have different interests.
Fig. 6. Weather web information services
A. Web Service
This Web service is one of the most common types of service provided by any provider in the weather information. Data produced by NWP models will then be converted into the form of images/pictures and then uploaded into the website (Figure 6).
8 INTERNETWORKING INDONESIA JOURNAL MANTORO ET AL.
temperature and humidity with different levels of user-accessible heights up to three days ahead with a range of hourly predictions.
A limitation of this type of service is that users can only view the parameters provided by the service providers, without the ability to modify the raw data.
B. GDS Access
To be able to modify the output data (e.g. display the parameters that are not displayed on the web service, perform data processing, displaying a particular domain, converting the data into another format, etc.) provided by a GDS, the information obtained is in a lot (62 parameters with different levels of altitude) because direct access to the raw data output of NWP models are possible.
Data access can be done using one of the data processing software using GrADS through port 8080. Therefore, users are required to use the data processing software, which can become obstacles for some users. Wide bandwidth is also required to access the large data.
Fig. 7. GrADS data server screenshots
C. User Defined Data Access
User Defined Data Access is a web service that is used to overcome the obstacles encountered when accessing the web service and the GDS. In this feature, the user can freely choose the parameters they want to display without having to think about how to run weather data processing software.
An interactive web interface is used to allow users to select the desired parameters (example: Initial condition, latitude, longitude, time interval, the level of altitude and weather parameters). The resulting output can be either images or moving images such as those obtained at the web service access. All computation is done by the computer server so that the large bandwidth requirement to access the GDS can be
overcome (e.g. when a lot of users are accessing simultaneously, and large transfer of data is required).
Accessing data using the User Defined Data Access is not as pleasant as using the GDS. But when compared with using a web service, data access using the User Defined Data Access is much better as the user does not have to think about how to deploy the weather data processing software (using the GDS). Therefore the User Defined Data Access can fill a needs-gap between a web service and the GDS.
Even with the advantages offered by each of these features, refinement and dissemination of the data is still required in order to provide appropriate information to the users.
D. GDS and User Defined Data Access Speed Comparison
WRF EMS data access speed in GDS server is analyzed by comparing data access using GDS (in this case client GrADS was used) and user defined data. The data access speed is calculated based on how fast data from GDS can be accessed using both techniques. Various air temperature data dimensions, i.e. time, latitude, longitude, and level, was used in analyzing the speed of these two techniques in accessing the data (see Table II).
Data access speed on user defined data is calculated based on the accumulation of the time required to process the data in the server and the time required by the client to download the data. Data access on GDS ignores the load burden caused by the high number of accesses by other users, and it was done not during the peak access time (done at night time).
Table 2: Air Temperature Data Dimensions
Datasets Time Latitude Longitude Height Level
Data 1 Vary
(1-25 hours) Fix Fix Fix
Data 2 Vary
(1-25 hours) (9°S to 5°S) Vary Fix Fix
Data 3 Vary
(1-25 hours)
Vary
(9°S to 5°S)
Vary
(105°E to 115°E)
Fix
Data 4 Vary
(1-25 hours) (9°S to 5°S)Vary (105°E to 115°E)Vary (1013 to 800 mb)Vary
VII. CONCLUSION
This paper presents a weather information provider which provides accuracy, speed and appropriate information to different basic needs of the users. We propose the combination of PC-Clusters, NWP and GDS that can be used as a low-cost solution in providing weather information which meets those three criteria.
This paper also presents a solution for the server side to manage large weather information datasets using web-based application. By using GrADS, GDS, and GrADS interface to the PHP application, information was delivered for the users at a low-cost solution.
information. It also provides an improvement in the form of a statistics feature that can download raw data in text format, and compile some data input from other NWP models.
As a case study, the prediction of weather information for a resolution of 27 km area in Indonesia was discussed.
With the increasing number of smartphone users, an client-side application on smartphone devices (e.g. Android, IOS, Symbian, etc.) that can access the User Defined Data Access would be needed. This could be a promising direction for further development for mobile users who need to query specific weather information.
REFERENCES
[1] Dutton, J. A. (2002). Opportunities and Priorities in a New Era for
Weather and Climate Services. Bulletin American Meteorology Society, 83, 1303-1311.
[2] Lanicci, J. M. (2012). Using A Business Process Model As a Central
Organizing Construct for An Undergraduate Weather Forecasting
Course. American Meteorological Society, 697-709.
doi:10.1175/BAMS-D-11-00016.1
[3] Hawick, K. A. (2003). Distributed Frameworks and Parallel Algorithms
for Processing Large-scale Geographic Data. Parallel Computing, 1297-1333. doi:10.1016/j.parco.2003.04.001
[4] Tang, M., Lee, B.-S., Yeo, C.-K., & Tang, X. (2005). Dynamic
Replication Algorithms for Multi-Tier Data Grid. Future Generation Computer System-The International Journal of Grid Computing and Escience, 775-790. doi:10.1016/j.future.2004.08.001
[5] Alpert, J., & Wang, J. (2004). The Real Time NOMADS Project: Access
to Operational Model Data and Value Added Products. 20th Conference on Interactive Information Processing Systems (IIPS) for Meteorology, Oceanography, and Hydrology. Seattle: American Meteorological Society.
[6] Sirott, J., Denbo, W. D., & Zhu, W. H. (2001). Dapper: An Opendap
Server for In-Situ Data. 20th International Conference on Interactive Information Processing System. Seattle: American Meteorological Society.
[7] Domenico, B. (2002). THematic Real-time Environmental Distributed
Data Services (THREDDS). 18th International Conference on Interactive Information and Processing Systems for Meteorology, Oceanography, and Hydrology. Orlando: American Meteorological Society.
[8] Simons, R. (2011). ERDDAP - The Environmental Research Division's
Data Access Program. Retrieved from
http://coastwatch.pfeg.noaa.gov/erddap.
[9] Cornillon, P., Gallagher, J., & Sgouros, T. (2003). OPENDAP:
Accessing Data in A Distributed, Heterogeneous Environtment. Data Science Journal, 2, 159-169.
[10] Trouet, V., & Oldenborgh, G. J. (2013). KNMI Climate Explorer: A
Web-based Research Tool for High-resolution Paleoclimatology. Tree-Ring Research, 69, 3-13. doi:10.3959/1536-1098-69.1.3
[11] Raoult, B. (2002). MARS, ECMWF's Meteorological Archive:
Experience in Managing a Large Archive. Retrieved from www.vds.cnes.fr/manifestations/PV2002/DATA/1-5_raoult.pdf
[12] Wielgosz, J., Doty, B., Gallagher, J., & Holloway, D. (2001). GrADS
and DODS. 17th International Conference on Interactive Information and Processing System for Meteorology, Oceanography, and Hydrology. Albuquerque: American Meteorological Society.
[13] Rutledge, G. K., the NOAA Operational Model Archive and Distribution
System (NOMADS), Proc. 13thSymp. On Global Change and Climate Variations, Orlando, FL, Amer. Meteor. Soc., J76-J78, 2002.
[14] Wielgosz, J., Doty, B., Adams, J., The GrADS-DODS Server: An
Open-Source Tool for Distributed Data Access and Analysis, American Meteorological Society conference proceedings, 2003.
[15] Ng, J., & Rogers, G. (2000). Clusters and Node Architecture. Retrieved
from The Cloud Computing and Distributed Systems (CLOUDS) Laboratory: http://www.cloudbus.org/~raj/csc433/ClusterNodeArch.pdf
[16] Chinnaiah, V., & Somasundaram, T. S. (2012). A Grid resource
brokering strategy based on resource and network performance in Grid. Future Generation Computer System-The International Journal of Grid
Computing and Escience, 28, 491-499.
doi:10.1016/j.future.2011.09.002.
[17] Rozumalski, R.A., A Nearly Complete Guide to the WRF EMS V3,
NOAA/NWS National SOO Science and Training Resource Coordinator, Boulder Colorado, 2010.
[18] Baker, M., & Buyya, R. (1999). Cluster Computing: The Comodity
Supercomputer. Software Practice and Experience, 29, 551-576.
[19] Takijawa, H., & Kobayashi, H. (2006). Hierarchical Parallel Processing
of Large Scale Data Clustering On a PC Cluster With GPU co-Processing. Journal Supercomputer, 36, 219-234.
[20] Farley, D. L. (2005). Performance Comparison of Mainframe,
Workstations, Cluster, and Desktop Computers. Technical report, NASA.
[21] Shainer, G., Liu, T., Michalakes, J., Liberman, J., Layton, J., Celebioglu,
O., et al. (2009). Weather Research and Forecast (WRF) Model Performance and Profiling Analysis on Advanced Multi-core HPC Clusters. The 10th LCI International Conference on High-Performance Clustered Computing. Colorado.
[22] William, G., Lusk, E., Doss, N., & Skjellum , A. (1996). A
High-Performance, Portable Implementation of the MPI Message Passing Interface Standard. Parallel Computing, 22 (6), 789 - 828.
[23] Yongmi, L., Jung, Y. J., Nam, K. W., Nittel, S., Beard, K., & Ryu, K.
H. (2012). Geosensor Data Representation Using Layered Slope Grids. Sensors , 12 (12), 17074-17093.
[24] Brusch, S., Lehner, S., & Stellenfleth , J. S. (2008). Synergetic Use of
Radar and Optical Satellite Images to Support Severe Storm Prediction for Offshore Wind Farming . IEEE Journal of Selected Topics in Applied Earth Observations and Remote Sensing , 1, 57-66.
[25] Kang, W. S., Hong, S. S., & Han, Y. K. (2010). A Web-based
Information System for Plant Disease Forecast Based on Weather Data at High Spatial Resolution. Plant Pathology Journal , 26, 37-48.
[26] Robert, R. A. (2010). A Nearly Complete Guide to the WRF EMS V3.
Colorado: NOAA/NWS National SOO Science and Training Resource Coordinator.
[27] COLA/IGES. (2010). GrADS Homepage. Retrieved 2013 from Grid
Analysis and Display System (GrADS) : http://www.iges.org/grads/.
[28] Montella, R., Giunta, G., & Riccio, A. (2007). Using Grid Computing
Based Components in On Demand Environmental Data Delivery. Proceedings of The Second Workshop on Use of P2P, GRID and Agents for The Development of Content Networks , (pp. 81-86).
[29] The GrADS website (2012). Grid Analysis and Display System
(GrADS), accessed on 27 February 2013. Available at: http://www.iges.org/grads/.
[30] Wielgosz, J. Doty, B, Gallagher, J, and Holloway, D., GrADS and
DODS, Seventeenth International Conference on Interactive Information and Processing System for Meteorology, Oceanography and Hydrology, Albuquerque, NM, 2001.
[31] Tozzi, L. R. (2012). OpenGrads Wiki: from PHP Interface to Grads.
Retrieved on 27 February 2013 http://opengrads.org/wiki/
index.php?title=PHP_ Interface_to_GrADS&redirect=no.
10 INTERNETWORKING INDONESIA JOURNAL MANTORO ET AL.
Wido Hanggoro holds bachelor degree in Agrometeorology from Bogor Institute of Agriculture and currently as a master student at Department of Informatics Engineering, Faculty of Information Technology, University of Budi Luhur Jakarta, Indonesia. He is also a researcher at Research and Development Center of Indonesia Meteorological, Climatological and Geophysical Agency. His research interests are in prediction, simulation and scenario projection of weather and climate modeling using parallel and networked computer system
Abstract— A fundamental requirement for executing Discrete Event Simulation (DES) is incorporating a data structure that represents process, product and resource information, and their interrelations. Further, the capability of integrating this data structure with other types of information such as geometry (e.g. for sizes of products or distances of transports) is of vital interest. Manufacturing information is normally not integrated but is heterogeneous and stored in different Computer Aided Design (CAD) and Computer Aided Manufacturing (CAM) applications in the factory plant. Therefore this paper aims to describe how to represent the main required operational data of a manufacturing system for DES by using ISO 10303 Application Protocol 214 (STEP AP214) in order to fulfill the mentioned characteristics of data and information. Stochastic properties of manufacturing resources and corresponding processes such as measured cycle time and disturbances information are represented using application module 1274 (ISO 10303- 1274) that defines a particular schema for probability distribution representation. A test implementation of the mentioned data including a graphical user interface has been carried out to show the feasibility of the research approach.
Index Terms— Computer aided engineering, Computer integrated manufacturing, Information representation, Computer applications
I. INTRODUCTION
IGITAL manufacturing is defined as a technology to process information to verify and optimize the manufacturing of products [1]. Discrete Event Simulation has shown a rigorous capability as a tool in the digital manufacturing context for the purpose of material flow analysis. However DES is rarely used in industry due to the ineffective and inefficient data management that is required for the DES implementation [2]. Extensive and
This work is funded by VINNOVA (The Swedish Governmental Agency for Innovation Systems) and has been supported by XPRES (Initiative for excellence in production research). We also thank Scania CV AB for fruitful discussions and support.
N. Shariatzadeh is with the Royal Institute of Technology, Department of Industrial Production, Stockholm, Sweden, phone: +46-8-790-8338; e-mail: navidsz@ KTH.se.
G. Sivard, is with the Royal Institute of Technology, Department of Industrial Production, Stockholm, Sweden, phone:+ 46-8- 790-9080; e-mail: [email protected].
M. Hedlind. is with Scania CV AB, Department of Industrial
Development, Stockholm, Sweden, phone:+46-8-55386000 ,e-mail:
consuming data preparation is one of the main reasons of this problem.
In addition, the required data for DES are heterogeneous and reside in different computer applications and databases. For instance, failure and disturbance data is stored in the databases of maintenance systems. Cycle times are defined by process planners and can be found in process planning applications, while geometrical data comes from CAD systems. Therefore, the representation of this data and information in an application and in a system-neutral format allows for easier data integration, for acceleration in the data preparation, and expedites updating DES models. This in turn prevents probable mistakes in data interpretation and facilitates data exchange among different computer applications.
There are a number of approaches that are able to develop data management architectures for capturing, structuring, storing and exchanging process specifications. Falkman [7] shows how process specifications represented as Petri Networks can be mapped to ISO 10303-214. This work represents process planning and conditions for process operation occurrences. However,the work does not focus on interrelated properties of processes, resources and products such as cycle times. Furthermore it does not specify the uncertainties embedded in the process such as the failure data Mean Time between Failure (MTBF) and Mean Time To Repair (MTTR).
Other research have been conducted on information modeling required for manufacturing processes, DES, online simulation, NC data and interlocking [8,9,10,11], However, little has been investigated concerning the connection between information and DES modelsm and integrating this information with other type of data.
There exist rich ontologies to represent manufacturing processes such as the Process Specification Language (PSL) [12], A Language for Process Specification (ALPS) [13], Core Plan Representation (CPR) [14], the <I-N-OVA> constraint model [15], the Visual Process Modeling Language (VPML) [16] and Petri Nets [17]. However since the aim of all ontologies is to represent knowledge of some domain (in this case manufacturing processes), integrating a specific ontology with other types of information is a laborious task. Moreover these approaches do not focus on shop floor data such as failure data. Boulonne indicates how operational data such as measured cycle time, MTBF, MTTR and energy consumption can be generated by using generic data extracted from
Material Flow Data Representation and
Integration Based on STEP
N. Shariatzadeh, G. Sivard and M. Hedlind
Royal Institute of Technology, Department of Industrial Production, Stockholm, Sweden
12 INTERNETWORKING INDONESIA JOURNAL SHARIATZADEH ET AL.
manufacturing databases [18]. They represent these operational data using the Core Manufacturing Simulation Data (CMSD) standard considering the stochastic processes properties. Riddick discusses representing geometrical or spatial aspects of manufacturing entities. However the CMSD standard does not rigorously cover all geometrical data and only focuses on simulation aspects such as boundary, placement and some other spatially-related aspects of the manufacturing entities [19]. Representations of this information using CMSD results in redundant data instantiation/conversion and waste of time since geometrical and spatial data already exist in CAD models and many Commercial CAD systems are able to translate them to the STandard for the Exchange of Product (STEP) model data that allows for interoperability.In the next section we discuss the necessity of integrating manufacturing processes with other types of information to support DES.
II. REQUIRED INFORMATION FOR MATERIAL FLOW AND
PROCESS CONTROL
Required information for material flow representation and process control can be categorized as follows:
Product: Product breakdown structure and its geometry data are used for DES. For instance, the diameter of a cylinder is necessary to be able to identify the required capacity of a conveyor which is used in a DES model.
Layout: layout information such as general definitions of the boundary, placement and spatial relations of the manufacturing entities.
Manufacturing resources: their operational property such as the speed of a conveyor or energy consumption of a resource in different states.
Maintenance: manufacturing resources availability information such as uptimes and downtimes.
Process-plan: description of manufacturing processes sequence and product routing.
Enterprise resource planning: information about orders, production scheduling and production strategy.
Fig. 1. Required information for DES modeling
Figure 1 illustrates the various domains and their corresponding information to build up a DES model.
III. PROBLEM STATEMENT
Data and information regarding products, processes and manufacturing systems are stored in different systems and databases throughout the factory, such as the Manufacturing Execution System (MES), the Enterprise resource Planning ( ERP) and the PDM. This information is heterogeneous due to the lack of interoperability between the CAx commercial software and simulation software. Therefore capturing, structuring and representing this information requires harmonization of this heterogeneous information, and thus also providing the interoperability capability of these data.
This paper presents research on an information modeling schema for an integrated modeling of product, process and manufacturing system for the purpose of discrete event simulation. The schema is based on ISO 10303-214 International standard, namely the application protocol 214 (AP214). This schema has been implemented in a software platform that generates process specification using process schema represented in the CMSD standard, in layout systems, and product design. The presented schema and associated software can support DES, reconfiguration and optimization process in the shop floor.
IV. RESEARCH APPROACH
In this research ISO 10303 is utilized for the purpose of an integrated representation of product, process and manufacturing system. This standard has been chosen for this purpose in reference to the following essential characteristics:
1) Extensibility: the schema must be developed in a way that it can accommodate extensions of data in the overall data structure. This property is essential since during the life cycle of a manufacturing system and its reconfiguration new pieces of information might be needed. For instance, the distances that human operators walk can be important for the purpose of line balancing in manufacturing systems.
2) Interoperability: the data storage must be done in an application and system neutral format. Hence different software tools can use this information and perform analysis. Furthermore, data interoperability makes the communication of layout tools and simulation tools possible since important information of a DES comes from layout system such as distances among machines, stop times and so on.
3) Multi granularity: The schema must be designed to support different levels of analysis of data according to the required detail of information.
4) Generic: The schema must be generic to make it possible to be used for wide variety of manufacturing system.
planning, and product routing. Hence different users can exploit their required data in their desired level of detail.
Entities represented in the suggested schema of this research deal with the product, process, and resources to model a manufacturing system and the interrelation of entities are highlighted in order to represent the product, process and resources as whole.
This research has focused on four (4) tasks and development of the software application:
1) Development of an integrated product, process and resources schema based on ISO 10303-214.
2) Mapping the process schema described in CMSD standard to STEP standard.
3) Develop computer application to translate data represented in CMSD (XML) to STEP 214 and validate it.
4) Develop a computer application for process specification translation from CMSD (XML) and integration with geometry of products and resources exporting form commercial CAD system in STEP format.
V. STANDARD FOR INFORMATION EXCHANGE
ISO 10303 STEP is an international standard that “provides a representation of product information along with the necessary mechanisms and definitions to enable product data to be exchanged” [3]. The term exchange should be interpreted as the exchange of data between computer systems in environments associated with the complete life-cycle of a product, including manufacturing. As an introduction to the STEP standard the following concepts will be explained:
• Application protocol (AP);
• Application reference model (ARM); • Application interpreted model (AIM); • Integrated resource (IR);
• The exchange/sharing mechanisms.
Application protocols (AP): define the scope, context, and information requirements for a particular application, e.g., the automotive industry (AP214), or the electrical design and installation (AP212). An application protocol is divided into two different representations of the information requirements: the application reference model (ARM) and the application interpreted model (AIM). In depth information on application protocols and STEP, in general, are available in [4]–[5].
ARM and AIM: The ARM is used to capture the information requirements using application-based terminology, whereas the AIM is used to represent the information requirements in application- neutral terminology. Thus, the ARM provides a model that is easy to interpret and understand for domain experts. In addition, the AIM provides a mechanism for interoperability between different application protocols. In this paper, the AIM model of AP214 is used.
AP214 is an application protocol developed to consider the requirements of automotive industry on information exchange. However, Scheller has shown that the generic structure of AP214 can be used to represent any type of mechanical product, including a manufacturing resource [6].
Implementation of the standard is supported by ISO 10303_22 SDAI (standard data Access Interface). SDAI is an
abstract programming interface to access data models based on EXPRESS (ISO 10303-11). Express is a language that describes Information models in STEP. ISO 10303-27 specifies a Java binding to SDAI and is implemented in JSDAI, an open source development package produced by LKSoftWare GmbH.
VI. INTEGRATED SCHEMA FOR PRODUCT,PROCESS AND
RESOURCE
A. Product, Resource Information Model
Figure 2 illustrates the product schema in a generic way in the AIM level of the ISO 10303_214 Standard. The product schema is generic; therefore it can represent both product and resource. The entities “Product”, “Product_ definition_ formation” and “product_ definition” are used to represent a product in general regardless the aspects that must be represented such as geometry, structure, feature etc. However; for the purpose of representing a resource one need to use the entity“Product_definition_resource”.
The”Product_definition_resource” entity can be of type “Product_definition” and/or “Action resource”, and it specifies a machine or an instrument that is used to perform a process.
Fig. 2. Product schema to represent product and manufacturing resource in ISO 10303_214
A process is represented by the “Process_operation” entity. “Product_definition_formation” entity is a collector of definitions of a product. An “Application interpreted model” could use this entity to support the identification of different versions of a single product.
14 INTERNETWORKING INDONESIA JOURNAL SHARIATZADEH ET AL.
the product. If the “Product” entity is a product that is to be manufactured, the Name attribute of the
“product_related_product_category” must be instantiated as “part” and if it is a resource it must be instantiated as a “tool”.
Moreover; in AP214 each “product definition” entity and other related entities such as “product_definition_resource” must be connected with the entity “product_definition_ context” and “Applied_organization_assignment”.
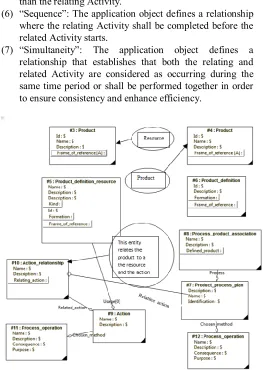
Fig. 3. Action schema to represent processes of a manufacturing system
B. Process Schema
Figure 3 demonstrates the process schema in the AIM level of the ISO 10303_214 Standard. A “Process_plan” is a type of action that specifies the information necessary for manufacturing planning. The relation_type specifies the meaning of the relationship. In the ARM level the following relation_type have been defined:
(1) “Alternative”: The application object defines a relationship where the related Activity may be used
alternatively instead of the relating Activity; (2) “Decomposition”: The application object defines a
relationship where the related Activity is one of potentially more sub-activities into which the relating
Activity is broken down. (3) “Derivation”: The application object defines a
relationship where the related Activity is derived from the relating activity. (4) “Exclusiveness”: The application object defines a
relationship where the relating and the related Activity
shall not have any overlap in time of execution. (5) “Precedence”: The application object defines a
relationship where the related Activity has higher priority than the relating Activity. (6) “Sequence”: The application object defines a relationship
where the relating Activity shall be completed before the related Activity starts.
(7) “Simultaneity”: The application object defines a relationship that establishes that both the relating and related Activity are considered as occurring during the same time period or shall be performed together in order to ensure consistency and enhance efficiency.
Fig. 4. Integrated schema of product, process, resource that represents the manufacturing system
C. Integrated Schema of Product, Process, Resource
In order to represent the manufacturing system the product, process and resource information and their interrelationship must be represented as a whole schema. Figure 4 shows an integrated schema for a product and a resource that performs a process on the product.
To represent the manufacturing processes that are performed with a resource, the “Poduct_definition_resource” entity is related by the entity” Action” and this action is already connected to the product schema as explained before. Hence, the relationship among product, process and resources can be established and represented. The product information includes ID, Name, Description, Life Cycle stage. The resource information includes ID, Name, Description, Category, and Operation.
Fig. 5. Representing MTBF and measured cycle time as properties of an “Action” that is performed by a resource on a product
D. Schema to Represent Failure Data and Measured Cycle Time
The most widely used failure information in discrete event simulation is MTBF and MTTR. MTBF is often in practice seen as a kind of total performance measure of a resource which performs many different operations on various products. Thus it might be difficult in practice to relate the MTBF to a specific combination of operation-product. Still, theoretically the MTBF is a kind of time which characterizes how the resource performs. Thus the time between failures is a property of an activity which in turn is related to both resource and the product that is being processed.
MTBF and MTTR can be represented by “Product-property” schema (ISO 10303-41) and “Process-“Product-property” (10303-49) schemas.
Figure 5 demonstrates an example of representing a property of a resource-process. The “Action entity “is connected to a “Process_operation” entity that is a manufacturing process. The “Action” is connected to the “Action_property” entity property that can be MTBF. “Action_property” entity is connected to the “Action_property_representation “entity that is used to represent the desired property. Measured cycle time is a cycle time that has been measured in the shop floor for example by executing stop-watch method. This property can be represented with the same schema. Moreover the cycle time that is identified through the process planning activity can also
be represented in the same way. However if measured cycle time is stochastic, its corresponding distribution is represented using AM 1274 that is explained in next section. Figure 5 shows the schema for representation of MTBF as a property of an action that is performed by a certain resource and produces a particular product.
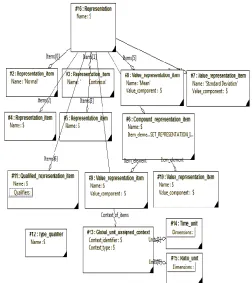
Fig. 6. Schema for probability distribution using AM 1274 ISO 10303
E. Schema of Probability Distribution
16 INTERNETWORKING INDONESIA JOURNAL SHARIATZADEH ET AL.
Figure 6 illustrates a MTBF representation that follows Normal distribution with mean that follows Normal distribution with mean 125 and Standard deviation 5.
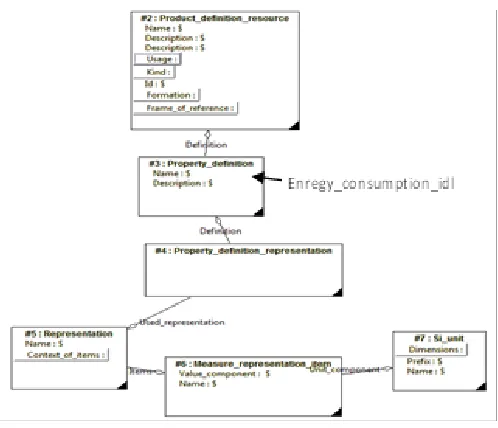
Fig. 7. Schema for representation energy consumption of resource
F. Representation of Energy consumption of manufacturing resources
Energy consumption analysis has been the subject of interest for DES to increase the ecological sustainability in production systems. Skoogh shows that the variability of energy consumptions in different statues of the machine (Idle, busy, standby) are low [20]. Therefore this research represents the energy consumption data in a deterministic way by using “Product_property-definition” schema (10303-41), representation schema” (10303-43) and “Measure schema” ISO 10303-41.
Figure 7 illustrates an example of energy consumption as a property of a resource.
G. Map CMSD TO STEP
GDM (Generic Data Management) tool is a software application developed by Chalmers University which extracts the generic data regarding cycle time and failures form the available databases in the plant, draw the histogram, execute the probability distribution fitting, and publish the result in XML format based on CMSD standard [21]. The CMSD Information Model defines a data specification for exchange of manufacturing data in a manufacturing simulation environment. The specification provides a neutral data format for integrating manufacturing applications and simulation. However it does not cover specification of implementation methods and execution behavior of the manufacturing system.
In GDM the toll raw data, describing all necessary behavior on the shop floor, are manually extracted from off-line copies
of two production databases, mainly using copy and paste functions. Moreover, filtering of irrelevant or incorrectly measured data was manually performed in MS Excel by simply identifying and deleting data points using process knowledge.
The computer application developed in this research extracts operational data from the output of GDM tool. Therefore a comparative study has been carried out to map the CMSD to STEP. The scope of data is limited to operation sequence, cycle time, failure data and energy consumption of resources in this research.
Table 1 shows some examples regarding the mapping table. The entities used in CMSD to represent a manufacturing system and properties for a DES model are described in [2].
Table 1. Example of mapping CMSD to STEP AP214
The main attributes of product, resource and processes that are considered in this schema are as follows:
● Product representation: unique ID, Name, Description, Life Cycle stage, Product process plan (a relation between product and processes).
● Resource representation: unique ID, Name, Description, Category, Operation.
● Representation of Stochastic operational characteristics of resources including Mean Time Between failure (MTBF) and Mean Time To Repair (MTTR).
● Processes required for product manufacturing:
○ Stochastic representation of Measured Cycle time;
○ Product routing (describes the material flow: operation sequence, operation alternatives and synchronization of operations - whether parallel or in sequence).
Fig. 8. System architecture of developed computer application for material flow data generator in STEP and integrator with other information
VII. SYSTEM ARCHITECTURE OF THE DEVELOPED COMPUTER
APPLICATION
This research includes development of one application for providing information for a Discrete Event Simulation Software tool. Figure 8 illustrates the system architecture of the developed computer application. This application is a STEP implementation based on the AP214 AIM schema. It was developed using the Java language because the STEP standard has a strong programming interfaces for Java. All data are represented with STEP part 21 that is the physical part of the standard. Other required data such as organizational data, technical information of a manufacturing resource (machine data card) can be extracted for other available databases or instantiated manually. The geometry data of a product or a resource are translated from any CAD system that is able to represent geometrical data rigorously in STEP format. After translation of operational data, these data are merged with geometry using the developed computer application. Now this repository of data and information can be used for extracting the desired information for the purposes of discrete event simulation. However, since one of the objectives of this test implementation is to export data to the ExtendSim software, the application extracts and converts the information to a text file that is recognizable for the
ExtendSim software. This will be discussed below. In the design stage, the integration of three layers is considered: physical data, resources, and application. The resources are collected in a layer to link the application with physical data. Physical data is the data physically stored in the hard disk. The application layer contains the developed programs.
VIII. CASE STUDY
This case study considers a manufacturing encompassing five manufacturing resources, one product and 5 processes. The purpose of the simulation is the calculation of throughput and energy consumption. Each resource includes energy data in three different states: busy, idle and standby. Each process-resource has MTBF, MTTR, measured cycle time, and nominal cycle time. The MTBF, MTTR and measured Cycle time are imported to the application in CMSD format (XML) and other information is extracted from other databases or set up manually. A graphical user interface was developed for end users. With this interface end users only need to identify the path of the CMSD file, the desired location for the STEP file and the database of the ExtendSim software. Finally by clicking the convert buttons the files will be converted in less that one minute.
Figure 9 demonstrates the flow of data translation and integration using the developed computer application. First manufacturing process specification in XML format is translated to STEP. In this step other organizational information is added as well. In second step this information is integrated with geometrical information. The geometrical data come from CAD systems. Finally three pieces of information including cycle time, MTBF and MTTR are exported to a readable text format for ExtendSIM simulation software.
Figure 10 illustrates the graphical interface and the various file formats during the conversion process. As mentioned before some geometrical data of a resource and product are used for DES as well. For instance, the capacity of a straight roller conveyor is the result of the length of the conveyor divided by the diameter of a semi finished product. Therefore the developed computer application merges the operational data with geometrical data of resources or products.
The geometry of a resource or a product is imported from commercial CAD systems. When merging geometry and process schemas, the header, data section and entities “product“ and Product_definition_formation” are duplicated. As such the application eliminates the extra entities, and combines geometrical data and process data, etc.
The” Product_definition-formation” is the entity that collects all product representation aspects and exists in geometry, technical data, and property schema. Therefore the computer application searches products with the same ID, keeps one “Product_definition_representsation”, elimates the rest and conducts the necessary relationships among the remaining “product_definition_representation” entity and the other entities that were connected with
![Fig. 1. The NOMADS Philosophy (redrawn and simplified from [13])](https://thumb-us.123doks.com/thumbv2/123dok_us/8756482.1750039/6.612.313.567.375.661/fig-nomads-philosophy-redrawn-simplified.webp)