Available Online at www.ijpret.com 99
INTERNATIONAL JOURNAL OF PURE AND
APPLIED RESEARCH IN ENGINEERING AND
TECHNOLOGY
A PATH FOR HORIZING YOUR INNOVATIVE WORK
EXPERIMENTAL INVESTIGATION OF EDM PROCESS PARAMETERS USING
TAGUCHI DESIGN METHOD
AHEMAD K. KHAN1, PROF. DR. RAJESH A. KUBDE2
1. PG Student, Prof. Ram Meghe Institute Of Technology And Research, Badnera, Amravati
2. Associate Professor, Department of Mechanical Engineering, Prof. Ram Meghe Institute Of Technology And Research, Badnera, Amravati
Accepted Date: 12/04/2015; Published Date: 01/06/2015
\
Abstract: Electrical Discharge machining (EDM) has been recognized as an efficient production method for machining of electrically conductive hard material. The large number of parameters and the inherent complexity of material removal mechanism taking place in EDM make it even more difficult to select machining conditions for optimal performance. Hard material are generally difficult to machine but getting great demand from industries like aerospace, automobile and die making. In the present work, Taguchi Design Method is used to investigate and optimize the effect of four important EDM process parameter namely discharges current, Gap Voltage, Pulse on Time and pulse off time on material removal rate (MRR) and surface roughness (Ra). Parts of the experiment were conducted with the L9 orthogonal array based on the Taguchi method. The process has been successfully modeled and model adequacy checking is also carried out using MINITAB software. The model have been validated with analysis of variance(ANOVA).Finally, an attempt has been made to estimate the optimum machining conditions to produce the best possible response within the experimental constraints.
Keywords: EDM, Surface Finish, Material Removal Rate, Surface Finish
Corresponding Author: MR. AHEMAD K. KHAN
Access Online On:
www.ijpret.com
How to Cite This Article:
Ahemad K. Khan, IJPRET, 2015; Volume 3 (10): 99-110
Available Online at www.ijpret.com 100
INTRODUCTION
Electrical Discharge Machining (EDM) is an electro-thermal non-traditional machining Process, where electrical energy is used to generate electrical spark and material removal mainly occurs due to thermal energy of the spark. EDM is mainly used to machine difficult-to-machine materials and high strength temperature resistant alloys. Work material to be machined by EDM has to be electrically conductive.
1.1 Current Research Trends in EDM
As far as EDM is concerned, two kinds of research trends are carried out by the researchers viz modeling technique and novel technique. Modeling technique includes mathematical modeling, artificial intelligence and optimization techniques such as regression analysis, artificial neural network, genetic algorithm etc. The modeling techniques are used to validate the efforts of input parameters on output parameters since EDM is a complicated process of more controlled input parameters such as machining depth, tool radius, pulse on time, pulse off time, discharge current, offset depth, output parameters like material removal rate and surface quality. Novel techniques deal with hour other machining principles either conventional or unconventional such as ultrasonic can be incorporated into EDM to improve efficiency of machining processes to get better material removal rate and surface quality. Novel techniques have been introduced in EDM research since 1996
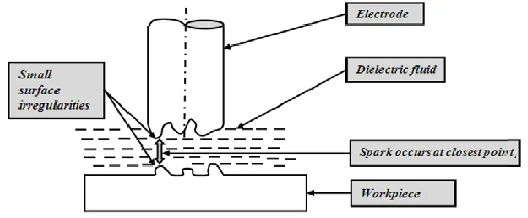
1.2 Principle of EDM
Available Online at www.ijpret.com 101
Figure 1: Working principle of EDM
2. Machining parameters of EDM
This section discusses the process parameters of EDM.
Discharge Current (Ip):Current is measured in amp Allowed to per cycle. The discharge current (Ip) is a measure of the power supplied to the discharge gap.
Pulse-on time (Ton):The duration of time (μs) the current is allowed to flow per cycle. Machining takes place only during the pulse-on time (Ton).
Pulse-off time (Toff):The duration of time (μs) between the sparks (that is to say, on-time). A non-zero pulse off time is a necessary requirement for EDM operation.
Gap voltage (Vg):It is a potential that can be measure by volt. When the gap voltage is increased, it increases the material removal rate and the surface roughness value.
3. Literature Review:-
Donald B.Moulton [3], study reveals about various features of EDM and improvement from the past to the recent improvements in manufacturing processes. His paper also gives about a better understanding and basic overview of fundamentals, features and practical uses of EDM
Ramakrishnan, R and Karunamoorthy [4], uses Taguchi Technique for developing robust design of experiment. They used this design for the optimization of input parameters (pulse on time, pulse of time, wire speed and wire tension) and output parameters (material removal rate. wire wear ratio and surface roughness) in EDM. They further applied multi response (signal to noise ratio) approach to measure the performance characteristics deviating from the actual value.
Available Online at www.ijpret.com 102
stochastically model and analyze EDM surface profiles to gain a better understanding of the surface generating mechanism. Further scanning electron microscopy and energy dispersive spectrometry were also used to study EDM surface characteristics.
Speeding and Wang [8], optimized the process parametric combinations of pulse on time, pulse off time and wire speed by modelling the process using artificial neural networks. The neural network was based on central composite rotatable experimental design and on feed-forward, back-propagation technique. They further characterized the EDM developed surfaces through time series techniques.
Sorabh et. al. [9], Studied reveals that Surface finish can be improved by decreasing both pulse duration and discharge current. This indicates short pulse durations.
R.Garg [10], investigated the effects of various EDM process parameters on the machining quality and to obtain the optimal sets of process parameters. Desirability functions were used for simultaneous optimization of performance measures.
Manoj Malik et. al. [22], Applied Grey based Taguchi technique to get optimized input parameter for wire EDM and suggested that pulse on time is most affecting input parameter for surface roughness and duty factor is least significant parameter.
Jaganathan p et. al. [23], investigated the effects of different input parameters on material removal rate and surface roughness and got the result using Taguchi optimization technique that voltage, pulse width, and wire speed is critical input parameters.
S.B.Prajapati and Patel [24], Suggested that pulse on time and pulse off times effected cutting rate and surface roughness critically machining process parameters on AISI A2 tool steel in wire electric discharge machining.
4. Aims and Objectives of Current Work
Available Online at www.ijpret.com 103
5. Experimental set up
For this experiment the whole work can be down by Electric Discharge Machine, model ELECTRONICA- ZNC EDM (Model- Smart ZNC) Pulse Generator S 50 ZNC with servo-head (constant gap) and positive polarity for electrode was used to conduct the experiments. Commercial grade EDM oil (specific gravity= 0.763, freezing point= 94°C) was used as dielectric fluid with Cu tool with a pressure of 0.48 kgf/cm2 .Experiments were conducted with positive
polarity of electrode. The pulsed discharge current was applied in various steps in positive mode.
5.1The experimental process variables and settings
Machining Media Workpiece material Mild Steel Brite (2062)
Electrode material Copper
Dielectric fluid Commercial grade EDM oil
Constant parameter Electrode diameter (mm) 10 mm
Flushing pressure(Kgf/cm2) 0.25 kgf/cm
Polarity Electrode positive
Process parameter Discharge current (A) 10,18,22
Pulse on time(μs) 11,55,95
Pulse off time(μs) 5,7,9
Gap voltage(V) 70,75,80
6. RESULT AND DISCUSSION
6.1.1. EDM Operation for Metal Removal Rate:( S/N Ratio Values for MRR)
Run Ip Ton Toff Vg MRR SNRA1
1 10 11 5 70 3.78 11.56
2 10 55 7 75 10.42 20.35
3 10 95 9 80 15.43 23.77
4 18 11 7 80 22.98 27.22
5 18 55 9 70 29.32 29.34
6 18 95 5 75 35.84 31.08
7 22 11 9 75 37.56 31.49
8 22 55 5 80 40.57 32.16
Available Online at www.ijpret.com 104
6.1.2. Response Table for Signal to Noise Ratios (Larger is better)
Level Ip Ton Toff Vg
1 18.57 23.43 24.94 24.72
2 29.22 27.29 26.95 27.65
3 32.31 29.37 28.2 27.72
Delta 13.74 5.94 3.26 3
Rank 1 2 3 4
M
ea
n
of
S
N
ra
tio
s
22 18
10 32
28
24
20
95 55
11
9 7
5 32
28
24
20
80 75
70
Ip Ton
Toff Vg
Main Effects Plot (data means) for SN ratios
Signal-to-noise: Larger is better
The regression equation is
MRR = - 24.4 + 2.60 Ip + 0.131 Ton + 0.176 Toff - 0.004 Vg
Predictor Coef SE Coef T P
Constant -24.36 10.40 -2.34 0.079
Ip 2.5984 0.1083 23.99 0.000
Ton 0.13062 0.01575 8.29 0.001
Toff 0.1761 0.3309 0.53 0.623
Available Online at www.ijpret.com 105
S = 1.62131 R-Sq = 99.4% R-Sq(adj) = 98.8%
Residual Plots for MRR
Residual P er ce nt 2 1 0 -1 -2 99 90 50 10 1 Fitted Value R es id ua l 40 30 20 10 0 2 1 0 -1 -2 Residual Fr eq ue nc y 2 1 0 -1 -2 4 3 2 1 0 Observation Order R es id ua l 9 8 7 6 5 4 3 2 1 2 1 0 -1 -2
Normal Probability Plot of the Residuals Residuals Versus the Fitted Values
Histogram of the Residuals Residuals Versus the Order of the Data Residual Plots for MRR
6.1.3Analysis of Variance
Source DF SS MS F P
Regression 4 1693.79 423.45 161.09 0
Residual Error 4 10.51 2.63
Total 8 1704.31
6.1.4. Verification and Confirmation Experiments:
Details Optimal parameters of MRR
Prediction Experimental
Process parameter Ip Ton Toff Vg Ip Ton Toff Vg
Level 3 3 3 3 3 3 3 3
Available Online at www.ijpret.com 106
6.2.1. EDM Operation for Surface Roughness:S/N Ratio Values for Ra
Run Ip Ton Toff Vg Ra SNRA1
1 10 11 5 70 4.8 -13.62
2 10 55 7 75 2.9 -9.24
3 10 95 9 80 1.8 -5.1
4 18 11 7 80 5.5 -14.8
5 18 55 9 70 9.9 -19.91
6 18 95 5 75 9.8 -19.82
7 22 11 9 75 9.7 -19.73
8 22 55 5 80 10 -20
9 22 95 7 70 11.2 -20.98
6.2.2.Response Table for Signal to Noise Ratios (Smaller is better)
Level Ip Ton Toff Vg
1 -9.326 -16.056 -17.816 -18.174
2 -18.181 -16.387 -15.013 -16.269
3 -20.24 -15.305 -14.918 -13.304
Delta 10.914 1.082 2.899 4.87
Rank 1 4 3 2
M
ea
n
of
S
N
ra
tio
s
22 18
10 -10.0
-12.5
-15.0 -17.5 -20.0
95 55
11
9 7
5 -10.0 -12.5
-15.0 -17.5
-20.0
80 75
70
Ip Ton
Toff Vg
Main Effects Plot (data means) for SN ratios
Available Online at www.ijpret.com 107
The regression equation is
Ra = 20.0 + 0.603 Ip + 0.0113 Ton - 0.267 Toff - 0.287 Vg
Predictor Coef SE Coef T P
Constant 20.001 6.041 3.31 0.030
Ip 0.60298 0.06291 9.58 0.001
Ton 0.011279 0.009149 1.23 0.285
Toff -0.2667 0.1922 -1.39 0.238
Vg -0.28667 0.07688 -3.73 0.020
S = 0.941556 R-Sq = 96.5% R-Sq (adj) = 92.9%
Residual Plots for Ra
Residual P e rc e n t 2 1 0 -1 -2 99 90 50 10 1 Fitted Value R e si d u a l 12 9 6 3 1.0 0.5 0.0 -0.5 -1.0 Residual F re q u e n cy 1.0 0.5 0.0 -0.5 -1.0 3 2 1 0 Observation Order R e si d u a l 9 8 7 6 5 4 3 2 1 1.0 0.5 0.0 -0.5 -1.0
Normal Probability Plot of the Residuals Residuals Versus the Fitted Values
Histogram of the Residuals Residuals Versus the Order of the Data
Residual Plots for Ra
6.2,3. ANOVA for regression analysis
Source DF SS MS F P
Regression 4 96.823 24.206 27.3 0.004
Available Online at www.ijpret.com 108
Total 8 100.369
6.2.4 Results of the confirmation experiments
7. CONCLUSION & FUTURE WORK
7.1 CONCLUSION
This work presented the high MRR and fine surface finish obtained on EDM machining processes. In this work, an attempt was made to determine the important machining parameters for performance measures like MRR and Ra separately in the EDM.
The experiments were conducted under various parameters setting of discharge current (Ip), pulse on time (Ton), pulse off time (Toff) and gap voltage (Vg). L-9 OA based on Taguchi design was performed for Minitab software was used for analysis the result and theses responses were partially validated experimentally.
The material removal rate (MRR) mainly affected by peak current (Ip) and pulse-on time (Ton). The effect of pulse off time (Toff) is less on MRR. Gap voltage (Vg) has least effect on it.
Peak current, pulse off time and pulse on time significantly affects the MRR and SR in EDM.
Analysis of variance shows that peak current and Pulse on time are having more influence to material removal rate.
The fine surface finish (Ra) is mainly affected by peak current (Ip) and Gap voltage (Vg). The effect of pulse-on time (Ton) is less on Ra. Pulse off time (Toff) has least effect on it.
Surface roughness was mainly affected by the current and gap voltage. At higher value of current causes the more surface roughness. Higher surface finish can be achieved value can be achieved at lower current.
Details Optimal parameters of Ra
Prediction Experimental
Process parameter Ip Ton Toff Vg Ip Ton Toff Vg
Level 1 3 3 3 1 3 3 3
Available Online at www.ijpret.com 109 Peak current and gap voltage are the most influential parameters for reducing surface
quality.
7.2. Scope for Future Work
Although the EDM machining has been thoroughly investigated for Mild Steel Brite (2062) work material, still there is a scope for further investigation. The following suggestions may prove useful for future work:
The machining parameter combinations are to be find out for high MRR and fine surface finish.
It is found that the basis of controlling and improving MRR mostly relies on empirical methods. This is largely due to stochastic nature of the sparking phenomenon. Being an important performance measure, the MRR has been getting overwhelming research potential since the invention of EDM process and requires more study/experimentation/modelling in future.
The contribution Variants of EDM has brought tremendous improvements in the surface finish of machined advanced engineering materials. The effect of process parameters such as flushing pressure, conductivity of dielectric, Tool diameter, workpiece height etc. may also be investigated.
REFERENCES
1. Donald B.Moulton (Usa) Edm Network Sugar Grove, IL USA Fundamentals of EDM pp 3-7.
2. Ramakrishnan, R. and Karunamoorthy, L.,(2006), Multi response optimization of wire EDM operations using robust design of experiments, International journal of advanced manufacturing technology, 29, pp. 105–112.
3. Williams, R. and Rajurkar., K.,(1991),Study of wire electrical discharge machined surface characteristics, Journal of Materials Processing Technology, 28, pp.127-138.
4. Speeding, T. and Wang, Z., (1997), Parametric optimization and surface characterization of wire electrical discharge machining process, Precision Engineering, 20, pp.5-15.
5. Sorabh., Manoj.,Neeraj Nirmal.,(Jan-Feb 2013)., A literature review on optimization of machining parameters in wire edm.pp-492-494.
Available Online at www.ijpret.com 110
7. Manoj malik, Rakesh, Nitesh, Deepak and Manoj (2012), Optimization of process parameters of Wire edm using zinc coated brass wire, International Journal of Advanced Technology and Engineering Research.
8. Jaganathan P., Naveen Kumar, Dr. R. Sivasubramanian (2012), Machining parameters optimizations of WEDM using taguci method, International journal of Scientific and Research Publications, Issue-12.