Reprinted from the Soil Science Society of America Journal Volume 56, no. 2, March-April 1992
677 South Segoe Rd., Madison, WI 53711 USA
Lime Effects on Phosphorus Availability in a Calcareous Soil
D. T. Westermann* ABSTRACT
Crop yields are sometimes reduced on irrigated calcareous soils with elevated lime concentrations. This study was conducted to determine the influence of lime on P availability. The effects of acid-equivalent lime concentrations and P fertilization rates on NaHCOrsoluble P, anion resin-extractable P, P-adsorption isotherms in 0.01 M CaCl2, and P uptake by sudangrass [Sorghum bicolor (L.) Moench] and po-tato (Solanum tuberosum L.) were investigated in the greenhouse on soil samples from the Portneuf silt loam (coarse-silty, mixed, mesic Durixerollic Calciorthid). Plant P uptake was increased by P fertil-ization and decreased by increasing lime concentration. Phosphorus uptake was curvilinearly related to solution P (extracted by 0.01 M CaCl2). Solution P concentrations increased linearly as the resin-ex-tractable P/equilibrium buffer capacity (EBC) ratio increased, where EBC is the slope of the P-adsorption isotherm at the indigenous equi-librium P concentration. The EBC increased as the lime concentration increased. Phosphorus applications increased solution P and resin-extractable P and decreased EBC within a given lime concentration. These data indicate that the soil-test P concentration or P fertilization rate should increase as the lime concentration increases to provide the same degree of P availability and plant P uptake in this calcareous soil.
M
ANY AGRICULTURAL SOILS in the western USA contain a lime-enriched layer that is often ex-posed during irrigation development from land level-ing to aid water distribution. Serious erosion caused by furrow irrigation also reduces the topsoil depth (A and Bw horizons) sufficiently for tillage operations to mix a portion of the lime-enriched layer with the re-maining topsoil (7). The lime-enriched layer often ex-ceeds 200 g lime kg-1 (CaCO3 equivalent), while the surface soil horizon of the native soil contains <10 g kg-' (27).
Crop yields depend on the topsoil depth on irrigated soils (7). Yield reductions have occurred where the top 1.2 m of soil was mixed by deep tillage (8). These yield reductions were not associated with water stress or high concentrations of soluble salts (7,8). Subsoils in these soils are low in plant-available Zn, P, and N (19); however, above-normal fertilizer application rates did not compensate for the reduced crop yields (7,8). Attempts to identify other nutrient deficiencies or tox-icities were not successful (19). Plants in these areas often show reduced vigor and growth in the seedling stages and delayed maturity. Plant P concentrations are often low even though soil-test P concentrations are above adequacy (19). In addition, the average soil temperatures are generally lower than normal until full plant cover because of a lighter colored soil surface due to the high lime concentration (8). These obser-vations suggest that P availability may be a factor limiting plant growth and yields.
Soil factors affecting plant P uptake are the P
con-D.T. Westermann. USDA-ARS, 3793 N 3600 E, Kimberly, ID 83341. Contribution from USDA-ARS. Received 19 Apr. 1991. *Corresponding author.
Published in Soil Sci. Soc. Am. J. 56:489-494 (1992).
centration at the root surface and the ability of the soil solid phase to replenish it (23). These are partially controlled by soil water content, pH, CaCO3 and clay concentrations, and the amount of readily labile P. One common characteristic of these eroded or land-leveled irrigated soils is a high lime concentration (>50 g kg-1). Phosphorus availability is known to be af-fected by CaCO3 (9, 15, 20, 28) and to react on its surfaces (10, 11), however neither P fertilization rates nor critical soil-test concentrations are commonly ad-justed for the CaCO3 concentration.
A study was initiated to evaluate the P nutritional relationships of irrigated crops grown on calcareous soils. This study investigated the effect of lime on the relationship between selected P-availability parame-ters and P uptake by plants grown in the greenhouse.
MATERIALS AND METHODS
The soil used in this study is a Portneuf silt loam. This soil contains a lime-cemented layer between 0.4- and 1-m soil depth. It restricts downward root penetration by annual plants but is permeable to water. Soil texture is uniform down to =---1.2 m (18% sand, 62% silt, 20% clay). The surface soil has a pH of 7.5 (saturated paste) and a cation-exchange capacity of 200 mmolc kg- 1 soil (27). Organic matter is usually =--10 g kg-'.
Four greenhouse experiments were conducted as follows. Experiment 1. Six soil samples (0-20 cm) were obtained from a field study established in 1972 (8) that included P fertilization rates: three from deep-tillage, "high" lime treatments and three from traditional tillage, "low" lime treatments (Table 1). The soil was air dried and 5-kg sub-samples were placed in an individual pot. Three sudangrass (cv. Trudan no. 8) plants were grown in each pot in a greenhouse maintained at 22 ± 4°C with natural lighting. Both the tops and roots were harvested after 45 d for de-termining P uptake.
Experiment 2a. A bulk soil sample (0-20 cm) was ob-tained from a Portneuf A horizon soil in crested wheatgrass
[Agropyron desertorum (Fisher ex Link) Schultes] and
sagebrush (Artemisia tridentata Nutt.) vegetation. Four
dif-ferent lime-concentration treatments were established by mixing CaO with the soil. The CaO–soil mix was subjected to repeated wetting and drying cycles, and intermittently mixed for 13 wk. The CaO was assumed to be completely converted to freshly precipitated lime when the soil pH (saturated paste) reached 8 or below. Sufficient weight of each soil–lime mix was used so that each pot contained the equivalent of 6 kg of untreated soil (e.g., 6.38 kg for the 6 g lime kg-' treatment). This procedure eliminated the inherent soil variability that would occur in samples from different locations. Phosphorus, as Ca(H,P0,) 2 . 2H20, was then added at rates of 0, 25, and 75 mg kg-' across lime concentrations (Exp. 2a, Table 2). A single potato (cv. Russet Burbank) seed ball (1.5–cm diam.) was planted in each pot. The tops and roots were harvested after 35 d of growth for P-uptake determinations. After removing the roots, the soil was retained for use in Exp. 2b.
Experiment 2b. An additional application of Ca(H2P0,02 . 2H20 was made on selected treatments from Exp. 2a after removing the potato plants in an attempt to obtain similar soil-test P concentrations within each lime
Abbreviations: EBC, equilibrium buffer capacity; ANOVA, analysis of variance.
6 6 6 2a Potato
30 29 28 75 75 75 126 125 126
12.5 23.3 45.8 0
25 75
9.5 19.5 42.0 0
25 75
7.2 14.9 32.7 0
25 75
43.3 63.2 104.1 29.9 48.3 81.7 20.1 29.4 51.2
0 19.6 35.6
25 32.8 61.0
75 58.7 113.6
0.277 48 12.45 42
0.455 38 14.29 62
1.094 21 14.06 74
0.172 104 8.65 25
0.260 78 11.95 41
0.763 53 12.95 59
0.139 182 7.43 17
0.172 129 10.88 33
0.251 94 11.47 43
0.020 624 6.52 10
0.022 540 6.94 14
0.030 338 7.53 20
*** *** *** 5.0
* 5 * *** * 5* 33.3
0
6 6 6
0 0
17.3 35.1 28.2 51.1 46.9 86.1
21.9 32.5 51.6
38.4 54.0 %.5 75
75 75
23 30 38
23.4 35.9 54.8
39.5 57.3 90.2 31
45 65 126
125 126
30 16 20.9 56.7
29 21 32.1 77.9
28 29 52.2 127.5
*•* *** *5* VP!,
*•* ••* • 5* *5*
*•,1, *** **
0.1 10.5 7.2 10.6
0.138 48 19.38 35
0.280 35 22.38 52
0.767 24 24.47 84
0.125 70 7.18 14
0.260 51 14.51 32
0.682 38 20.46 54
0.086 100 3.74
0.189 74 9.74 21
0.400 52 20.65 48
0.055 196 1.86 2
0.076 190 5.04 8
0.194 130 10.59 20
Significance Lime Phosphorus Lime x P CV (%)
Sudangrass
490 SOIL SCI. SOC. AM. 1., VOL. 56, MARCH-APRIL 1992
Table 1. Treatmentst, lime, selected soil P characteristics, plant dry-matter yield, and P uptake for sudangrass in Exp. 1.
P application
Soil characteristics Plant
Lime NaHCO3-P Resin-P Solution P EBC$ Yield P uptake kg ha-' g kg-' mg kg-' mg kg-' mg L- 1 L kg-' g pot-' mg pot-'
0 156 4.4 14.6 0.020 210 5.34 8.2
67 160 15.6 28.9 0.033 175 13.75 27.1
268 178 57.6 67.1 0.379 66 24.04 43.5
0 28 4.5 15.8 0.024 90 7.60 11.7
67 18 24.9 39.6 0.222 41 23.96 39.3
268 52 63.4 88.8 0.838 24 30.43 62.6
Significance
Lime ** *** *** *** *** I.**
Phosphorus Lime x P
*5* **
*** ***
*5* ***
*5* ***
*5* **
*5* **
CV (%) 16.7 13.2 2.9 11.2 10.3 11.8
*,**,***Significant at the 0.05, 0.01, and 0.001 levels, respectively.
t Fall soil samples (0-20 cm) from field plots spring fertilized with Ca(1-1 2PO4)2 .2F120. $ EBC = equilibrium buffer capacity.
concentration (Exp. 2b, Table 2). Sudangrass (Trudan no. 8), three plants per pot, was grown for 55 d before har-vesting tops and roots for P-uptake determinations.
Experiment 3. Chemical-reagent-grade CaCO3 (Lot no. 23200, J.T. Baker Co., Phillipsburg, NJ) was added to 4 kg of the Portneuf A horizon soil at concentrations of 0, 68, and 110 g kg- '. After several wetting-drying cycles,
P, as Ca(H2PO4)2 .2H20, was added to provide similar P
availabilities at the different lime concentrations (Table 3). Sudangrass (Trudan no. 8) was grown (three plants per 4 kg soil plus lime) for 45 d before harvesting roots and tops for P-uptake determinations.
The P-fertilizer material was mixed with the soil in each pot. This mix was subjected to at least one wetting-drying
Table 2. Treatments, selected soil P characteristics, plant dry-matter yield, and P uptake for potato and sudangrass in Exp. 2a and 2bt, respectively.
Treatments Soil characteristics Plant
Experiment Lime P application NaHCO3-P Resin-P Solution P EBC$ Yield P uptake g kg-' mg kg-' mg kg-' mg kg-' mg L-' L kg-' g pot - I mg pot- '
Significance
Lime * 5 * •**
Phosphorus *** ***
Lime x P NS ***
CV (%) 8.4 13.9
*,**,***Significant at the 0.05, 0.01, and 0.001 levels, respectively. NS = nonsignificant, at P = 0.10. t Experiment 2b used the same soil pots as Exp. 2a, with additional fertilizer P added as indicated.
EBC = equilibrium buffer capacity.
44* *•* *5* *5*
*5* * 5 * • 5* *4.*
*5 • * 5 * • +1, • *5*
80
NaHCO3 -P Solution-P • High CaCO3 0 • Low CaCO3
'
:' - - :--- - -. - . - - - --- . e , . "' •
7
^ 0.01 M CaCI Solution-P Ong kg')
•
0.2 0.4 0.6 0.8 1.0
10 20 30 40 50 60 70 NaHCO3 -P (mg kV)
60
rn 0_
E ao
Ld
20-:
D
0 0
WESTERMANN: LIME EFFECTS ON PHOSPHOROUS AVAILABILITY 491
Table 3. Treatments, selected soil P characteristics, plant dry-matter yield, and P uptake for sudangrass in Exp. 3.
Treatments Soil characteristics
Plant uptake Yield P Uptake Lime P application NaHCO,-P Resin-P Solution P EBCt
g kg-' mg kg-' mg kg-' mg kg-' mg L kg-' g pot-' mg pot-'
5 0 21.4 36.5 0.144 56 22.96 28
5 20 31.9 59.8 0.309 40 25.56 34
68 0 22.1 32.0 0.030 207 8.2 13
68 40 43.3 58.0 0.152 115 18.88 26
110 0 22.9 24.0 0.008 457 4.11 6
110 80 69.9 73.8 0.129 208 23.43 32
Significance
Lime *** ** *** *** ***
Phosphorus *** *** *** *** *** ***
Lime x P *** *** NS *** *** **
CV (%) 22.6 6.9 0.1 4.4 4.1 16.3
***:** Significant at the 0.05, 0.01, and 0.001 levels, respectively. NS = not significant at P = 0.10. t EBC = equilibrium buffer capacity.
cycle before sampling the soil from individual pots. The
samples (---,100 g) were air dried and crushed with a soil
pulverizer (flail type) before analysis for NaHCO3-extract-able P (24, 25), Cl-saturated resin-extractNaHCO3-extract-able P (2), and acid-equivalent lime (22). Phosphorus-adsorption isotherms were determined as follows: 3 g of air-dried soil was added
to 0.03 L of 0.01 M CaCl2 with 200 1.1,L of toluene, shaken
continuously for 24 h at 22°C, centrifuged and filtered. Phosphorus was determined on the filtrate (21). The initial
P concentrations in the CaC12 solutions were 0, 1.0, 2.5,
5.0, and 10.0 mg kg-'. The Pin the CaC12 extraction was
also compared with the P concentration in a solution ob-tained by centrifuging soil samples (only for soil samples used in Exp. 1) that were equilibrated for 6 d at the soil's field moisture capacity (1). The P buffer capacity was es-timated as the EBC, defined as the slope of the P-adsorption isotherm at the indigenous natural equilibrium P concentra-tion, i.e., y = 0 (12).
Adequate amounts of N, K, Zn, Fe, and S were applied in all experiments for maximum plant growth. Distilled water was added daily to maintain soil moisture near field
capacity. At harvest, the plant tops were excised at the soil
surface and the soil was then removed from each pot. The easily recoverable roots were physically separated from the soil and washed in distilled water. This procedure did not recover all the fine roots or root hairs. All plant materials
were dried at 60°C, ground to pass a 425-vim2 screen,
di-gested in HNO3HC104, and analyzed for total P (17). The
plant dry-matter yield and P uptake per pot is the sum of the tops and roots. All experiments contained three repli-cates. Data were analyzed by standard ANOVA procedures and regression analysis where appropriate.
RESULTS
The lime, P, and lime x P interaction effects on soil P characteristics and plant responses were signif-icant in all experiments (Tables 1, 2, and 3). Applying P increased NaHCO 3-extractable P, resin-extractable P, solution P, plant dry-matter yields, and P uptake and decreased EBC. Increasing lime concentration at an equivalent P application generally decreased NaHCO 3-extractable P, resin-extractable P, solution P, plant dry-matter yield, and P uptake and increased EBC. Plant P concentrations (data not shown) and dry-matter yields were similar to P-uptake differences. The P uptake by sudangrass in Exp. 1 was influ-enced by the NaHCO3-extractable P and lime concen-tration (Fig. 1 and Table 1). Similar P uptake and dry-matter yields occurred in treatments with significantly
Fig. 1. The relationship between P uptake by sudangrass and soil solution P in 0.01 M CaCl2 or P extracted by NaHCO 3 in Exp. 1. Lines hand-fitted to data points.
different NaHCO 3-extractable P and lime concentra-tions (i.e., 24.9 vs. 57.6 mg P kg- 1 , and 18 vs. 178 g kg-', respectively, Table 1). Closer examination of data indicated that P uptake was probably related to the solution P concentration by two linear lines (Fig. 1).
Equivalent amounts of soil were included in each lime treatment in Exp. 2 to reduce any intrinsic soil differences that could affect the results. The relative increase in NaHCO 3-extractable P, resin-extractable P, and solution-P concentrations from P application decreased as the lime concentration increased (Table 2, Exp. 2a). Plant dry-matter yield and P uptake were related to NaHCO 3-extractable P and resin-extractable P within a lime concentration, but not across lime concentrations. Phosphorus uptakes were dependent on solution-P concentrations and independent of lime concentrations, similar to Exp. 1. Even the highest P application (75 mg kg- 1 ) on the 126 g lime kg-' treat-ment had plants with severe P-deficiency symptoms, even though the NaHCO 3-extractable P concentration (32.7 mg kg- 1 ) would normally be considered ade-quate for plant growth.
Additional P applications were made on selected Exp. 2a treatments in an attempt to obtain equivalent NaHCO3 -extractable P concentrations at different lime concentrations (note no significant lime x P
Table 4. Linear correlation coefficient matrixt for selected soil and plant P parameters in Exp. 1, 2a, 2b, and 3.
Lime NaHCO3-P Solution P Resin-P EBCt
NaHCO,-P Solution P Resin-P EBC P uptake
-0.03 -0.49**
-0.27
0.60** -0.53**
0.66** 0.86** -0.38*
0.61** r
0.80** -0.53** 0.87**
-0.48**
0.69** -0.58**
***Significant at the 0.05 and 0.01 probability levels, respectively.
t EBC = equilibrium buffer capacity. 80
_v 70 60 0) E 50
a_ 40 „,30 0
20 0 Z 10
20 40 60 80 100 Resin-P (mg kg 1 )
120 140 Table 5. Relationships between selected independent variables and plant P uptake in Exp. 1, 2a, 2b, and 3.
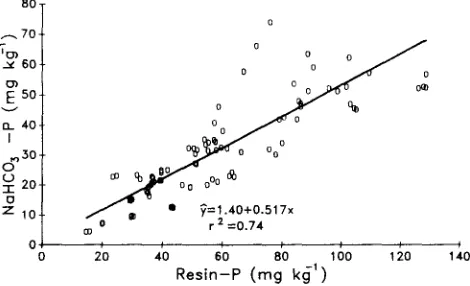
Fig. 2. The relationship between the soil P extracted by anion resin and NaHCO, in Exp. 1, 2a, 2b, and 3. Relationship significant at the P = 0.001 probability level.
2). Overall treatments trends were similar to Exp. 2a. Phosphorus uptake, dry-matter yield, and solution P decreased as lime concentration increased at nearly equivalent NaHCO3-extractable P concentrations
(Ta-ble 2). Solution P and P uptake were curvilinearly related. At similar solution-P concentrations, plant P uptake was slightly higher in the lowest lime concen-tration than in the other lime concenconcen-trations. The EBCs were lower than in Exp. 2a, partially because of ad-ditional P applications, and possibly because the lime's surface reactivity was decreasing. Solution P, Na-HCO3-extractable P, and resin-extractable P
concen-tration decreased where additional P was not applied (i.e., 6 g lime kg-1), reflecting P removal by the
potato plants and slow fixation. Results were similar from an application of reagent grade CaCO3 to the
`native' Portneuf soil (Exp. 3) as those obtained from precipitating lime from CaO (Table 2 vs. Table 3). Solution-P, plant dry matter yield, and P uptake de-creased, and EBC increased as lime increased. Phos-phorus uptake was related to solution-P across all lime concentrations (Table 3).
The NaHCO3 extracted 55% of the P fertilizer
ap-plied in Exp. 3 with no significant effect of lime con-centrations. Apparent recoveries by NaHCO3 of the P
fertilizer applied in Exp. 2a were 52, 44, 44, and 34% as lime increased from 6 to 126 g kg-1. NaHCO3-P
averaged 52% of the resin-P across all experiments (Fig. 2) and was not affected by lime concentration. A multiple linear regression analysis that included lime or EBC did not account for more experimental vari-ability. The resin-extractable P, as a percentage of the P fertilizer applied, decreased linearly as the lime in-creased in Exp. 2a and 3 (9 = 103.5 - 4.81x, r2 = 0.89).
Simple linear correlation coefficients (Table 4) be-tween selected variables were all significant (0.05 level), except for the relationship between lime and NaHCO3-extractable P or resin-NaHCO3-extractable P. Phosphorus up-take was negatively correlated with lime concentration and EBC, and positively correlated with NaHCO3-extractable P, resin-NaHCO3-extractable P, and solution P. So-lution-P concentrations were positively correlated with resin-extractable P, NaHCO3-extractable P, and P
up-take, while negatively correlated with EBC and lime concentrations. The solution P was also exponentially
Model F-ratio R2
15.1 + 67.4 (solution P) 305.3 0.75
69.7 (solution P)°'32 148.0 0.60
564.2 (EBCt) -° 69' 109.5 0.52
54.8 + 48.6 (solution P) - 7.74 In(EBC) 198.1 0.80 24.4 + 0.72 (NaHCO3-P) - 10.12 In(CaCO3) 113.2 0.69
t EBC = equilibrium buffer capacity.
All models are significant at the 0.001 probability level.
related to EBC (r = - 0.87) and to resin-extractable P (r = 0.83). Lime and EBC were positively corre-lated.
The P-uptake data were also evaluated in a stepwise regression analysis. The solution P and a natural-log transform of the EBC were selected for the final regression model (Table 5). Attempts to improve this relationship with other variables or models were not successful. A similar model using NaHCO3-extracta-ble P and the natural log of the CaCO3 equivalence
as independent variables gave an intermediate fit.
DISCUSSION AND CONCLUSIONS Adsorption isotherms are usually developed from relatively long equilibrations to simulate field soil conditions. In this study, they were determined after 24 h of continuous shaking. The solution-P concen-trations (0.01 M CaC12) for all treatments in Exp. 1
were closely related to the P concentrations in soil solutions obtained by centrifugation (Cent-P = 0.931[solution P] - 0.014, r2 = 0.99). The P in the soil solution should be representative of that found under field conditions since these soils were equili-brated for 6 d at their field-capacity moisture content before centrifugation.
Lime decreased the relative P uptake of both su-dangrass and potato, and of bean (Phaseolus vulgaris L.) in a previous study (19). Significantly different plant-species responses to P buffer capacities are also reported (4). This suggests that the critical soil-test P concentration for a given extractant may also be de-pendent on plant species. Different critical soil-test concentrations are sometimes used for making P-fer-tilizer recommendations for different plant species. This is caused by species' differences in external-P require-ment, root length and hairs, and infection by vesicu-lar-arbuscular mycorrhizal fungi (26).
1.4
1.2
-Y 1.0
rn
E 0.8
9=0.037+0.206x r 2 =0.91
3 4 Resin P:EBC
0
I 0.6
0 t 0.4
(7)
(1) 0.2
0.0 0
WESTERMANN: LIME EFFECTS ON PHOSPHOROUS AVAILABILITY 493
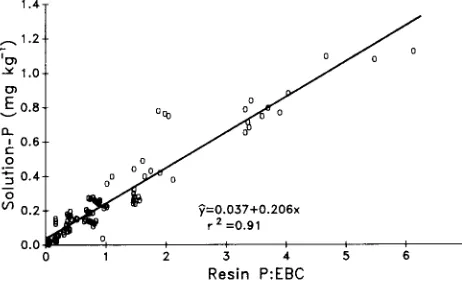
of labile (adsorbed) P as related to the P buffering capacity (16, 18) and it can be estimated by the resin-extractable P/EBC ratio. This ratio was linearly re-lated to the soil solution-P concentration (Fig. 3). A similar relationship existed between solution P and the NaHCO3-extractable P/EBC ratio ()" = 0.05 + 0.362x, r2 = 0.86). At a given resin-extractable P
concentra-tion, an EBC increase decreased the solution-P con-centration. The EBC significantly increased as the lime concentration increased in this study (Table 4), low-ering the solution-P concentration and reducing P up-take. A small but significant correlation occurred between resin-extractable P and EBC (Table 4). As expected, a P application at a given lime concentration increased P uptake because it increased resin-extract-able P and reduced EBC. A higher EBC at a given labile-P concentration would reduce the solution-P concentration and the effective distance that P moves to the roots by diffusion (23). This effect will be in-tensified under field conditions because root densities are smaller than in greenhouse pots. If P uptake is less than optimal, plant growth rates will be reduced, de-laying crop maturity or increasing the susceptibility of the crop to diseases. Yields may also be reduced if normal crop maturity is not reached by the end of the growing season.
Phosphorus adsorption in calcareous soils correlates with dithionite-soluble Fe and the surface area of the lime (12, 15). Every deep-tillage operation on an eroded calcareous soil has the potential to expose fresh cal-careous subsoil material. This material is probably more reactive than lime subjected to cropping and manage-ment practices for a number of years. Organic mate-rials and inorganic anions are adsorbed on the surfaces of lime materials with time, reducing their P-adsorp-tion capacities (15). The lime in the deep-tilled soil samples (Exp. 1) was recently exposed to the cropping environment (8). Its P reactivity was similar to freshly precipitated lime (Exp. 2a or 2b) or reagent-grade CaCO3 (Exp. 3), where equal amounts of "native" soil were used across lime concentrations. This sug-gests that the surface area of the lime was the major factor affecting P availability on these soils; however, neither surface area nor dithionite-soluble Fe was es-timated in these soils. Other forms of carbonate
min-Fig. 3. The relationship between the soil solution P in 0.01 M
CaCl2 and the resin-extractable P/equilibrium buffer capacity (EBC) ratio in Exp. 1, 2a, 2b, and 3. Relationship significant at the P = 0.001 probability level.
erals, carbonate minerals coated with nonreactive materials, or limed acidic soils may not follow the relationships found in this study. Increasing lime con-centrations also reduce the residual value of P fertil-izers (9, 28).
The portion of labile P extracted by an effective soil test should be dependent on the P buffering capacity. Lime concentration or reactivity is generally not con-sidered in P-fertilizer recommendations based on the NaHCO3 soil test. The NaHCO 3 test is based on sol-ubility-product principles in CaCO 3soil systems (24). In this study, it averaged 52% of that extracted by the anion-exchange resin, similar to that reported for other calcareous soils (6). For a wider range of soil types, the portion of labile P extracted by NaHCO 3 decreased from 58 to 5% as the buffer capacity increased (14), suggesting that the critical concentration of NaHCO3-extractable P may not change. However, this study and others (3, 5, 13) shows that the critical soil-test P concentration should increase as the buffer capacity increases to provide the same degree of P availability and plant uptake if the soil-test extractant is not sen-sitive to the buffering capacity. Additional studies are needed to further characterize the reactivity of the lime materials in calcareous soils and the effect of exposure and farming practices on their reactivity, and to iden-tify the effect of the soil's P buffer capacity on the critical soil-test P concentration under field condi-tions.
REFERENCES
1. Adams, F., C. Burmester, N.V. Hue, and F.L. Long. 1980. A comparison of column-displacement and centrifuge meth-ods for obtaining soil solutions. Soil Sci. Soc. Am. J. 44:733-735.
2. Amer, F., D.R. Bouldin, C.A. Black, and F.R. Duke. 1955. Characterization of soil phosphorus by anion exchange resin adsorption and 32P-equilibration. Plant Soil 6:391-408. 3. Barrow, N.J. 1967. Effects of the soil's buffering capacity
for phosphate on the relation between uptake of phosphorus and the phosphorus extracted by sodium bicarbonate. J. Aust. Inst. Agric. Sci. 33:119-121.
4. Barrow, N.J. 1975. The response to phosphate of two annual pasture species. I. Effect of the soil's ability to adsorb phos-phate on comparative phosphos-phate requirement. Aust. J. Agric. Res. 26:137-143.
5. Barrow, N.J., and T.C. Shaw. 1976. Sodium bicarbonate as an extractant for soil phosphate. III. Effects of the buffering capacity of a soil for phosphate. Geoderma 16:273-283. 6. Bowman, R.A., S.R. Olsen, and F.S. Watanabe. 1978.
Greenhouse evaluation of residual phosphate by four phos-phorus methods in neutral and calcareous soils. Soil Sci. Soc. Am. J. 42:451-454.
7. Carter, D.L., R.D. Berg, and B.J. Sanders. 1985. The effect of furrow irrigation erosion on crop productivity. Soil Sci. Soc. Am. J. 49:207-211.
8. Cary, J.W., and W.W. Rasmussen. 1979. Response of three irrigated crops to deep tillage of a semiarid silt loam. Soil Sci. Soc. Am. J. 43:574-577.
9. Fixen, P.E., and A.E. Ludwick. 1982. Residual available phosphorus in near-neutral and alkaline soils: II. Persistence and quantitative estimation. Soil Sci. Soc. Am. J. 46:335-338.
10. Freeman, J.S., and D.L. Rowell. 1981. The adsorption and precipitation of phosphate onto calcite. J. Soil Set. 32:75-84.
11. Griffin, R.A., and J.J. Jurinak. 1973. The interaction of phosphate with calcite. Soil Sci. Soc. Am. Proc. 37:847-850.
12. Holford, I.C.R. 1979. Evaluation of soil phosphate buffering indices. Aust. J. Soil Res. 17:495-504.
14. Holford, I.C.R. 1980b. Greenhouse evaluation of four phos-phorus soil tests in relation to phosphate buffering and labile phosphate in soils. Soil Sci. Soc. Am. J. 44:555-559. 15. Holford, I.C.R., and G.E.G. Mattingly. 1975. The high- and
low-energy phosphate adsorbing surfaces in calcareous soils. J. Soil Sci. 26:407-417.
16. Holford, I.C.R., and G.E.G. Mattingly. 1976. Phosphate ad-sorption and availability to plants of phosphate. Plant Soil 44:377-389.
17. Kitson, R.E., and M.G. Mellon. 1944. Colorimetric deter-mination of phosphorus as molydivanado phosphoric acid. Ind. Eng. Chem. Anal. Ed. 16:379.
18. Kuo, S. 1990. Phosphate sorption implications on phosphate soil tests and uptake by corn. Soil Sci. Soc. Am. J.
54:131-135.
19. Leggett, G.E. 1982. Fertilizer requirements of beans grown on Portneuf silt loam subsoil layers. p. 29-38. In Proc. 33rd Ann. NW Fert. Conf., Boise, ID. 11-13 July 1982. North-west Plant Food Association, Portland, OR.
20. Mattingly, G.E.G. 1975. Labile phosphate in soils. Soil Sci. 119:369-375.
21. Murphy, J., and J.P. Riley. 1962. A modified single solution method for determination of phosphate in natural waters. Anal. Chim. Acta 27:31-36.
22. Nelson, R.E. 1982. Carbonate and gypsum. p. 181-197. In
C.A. Black et al. (ed.) Methods of soil chemical analyses.
Part 2. Agron. Monogr. 9. ASA, CSSA, and SSSA, Madi-son, WI.
23. Nye, P.H. 1979. Soil properties controlling the supply of nutrients to the root surface. p. 39-49. In J.L. Harley and R.S. Russell (ed.) The soil-root interface. Academic Press, New York.
24. Olsen, S.R., and L.E. Sommers. 1982. Phosphorus. p. 403-430. In C.A. Black et al. (ed.) Methods of soil analysis. Part
2. Agron. Monogr. 9. ASA, CSSA, and SSSA, Madison, WI.
25. Olsen, S.R., C.V. Cole, F.S. Watanabe, and L.A. Dean. 1954. Extraction of available phosphorus in soils by extrac-tion with sodium bicarbonate. USDA Circ. 939. U.S. Gov . Print. Office, Washington, DC.
26. Ozanne, P.G. 1980. Phosphate nutrition of plants - a general treatise. p. 559-589. In F.E. Khasawneh et al. (ed.) The role
of phosphorus in agriculture. ASA, CSSA, and SSSA, Mad-ison, WI.
27. Robbins, C.W. 1977. Hydraulic conductivity and moisture retention characteristics of southern Idaho's silt loam soils. Univ. of Idaho Res. Bull. no. 99. Moscow, ID.