DOI: 10.9781/ijimai.2017.449
Exploring the Relevance of Search Engines: An
Overview of Google as a Case Study
Ricardo Beltrán-Alfonso. Andres Torres-Tautiva. Paulo Alonso Gaona-Garcia. Carlos Enrique Montenegro-Marin
Universidad Distrital Francisco José de Caldas, Bogotá, Colombia
Abstract — The huge amount of data on the Internet and the diverse list of strategies used to try to link this information with relevant searches through Linked Data have generated a revolution in data treatment and its representation. Nevertheless, the conventional search engines like Google are kept as strategies with good reception to do search processes. The following article presents a study of the development and evolution of search engines, more specifically, to analyze the relevance of findings based on the number of results displayed in paging systems with Google as a case study. Finally, it is intended to contribute to indexing criteria in search results, based on an approach to Semantic Web as a stage in the evolution of the Web.
Keywords — Browsers, Google, Internet, Search, Algorithms.
I. I
ntroductIont
heconstant growing of web-related services and the amount ofdata Internet handles, bring a new challenge for all information users associated to its veracity and quality. However, it is not an easy task, considering that the contents on Internet increase each second regardless their use or efficacy [1], which requires a deep and clear analysis about the quality of the search results.
Internet, and its fast evolution during years, has become a transforming factor for social, political, cultural, and especially scientific structures [1]. Also, this evolution has transformed the way in which the information has been stored and distributed by Internet, regarding internet significant size that hinders finding relevant results. It makes necessary structuring an architecture based in the Semantic Web that allows a more efficient search, analyzing it according to its results [2].
There are precursors in the field of quality assessment in search results on Internet, like [3, 4] and [5]; authors who have published results from their investigations about Web pages’ evaluation. Among the most representative instruments, they highlight the use of control lists and propose a list of useful indicators to evaluate the quality of the digital information. This proves that the necessity to evaluate the information is not a new subject but it is a prevalent topic in the implementation of the Semantic Web: a relevant aspect for the adoption of strategies that allow an increased use inside the field of agents and multi-agent systems about search processes [2].
The purpose of this study is to analyze the relevance of the results obtained in search engines on Internet regarding the real content of each indexed resource. For that, the search engine Google will be used as a case study. This study has identified the following considerations in order to obtain results according subjective impressions of searches by students based on the use of keywords. Therefore, the study has focused on the following conditions: 1) tests with undergraduate students located in Bogotá - Colombia, 2) participants aged 18 to 25 years and 3) the use of keywords according to the frequency of keywords identified by
the Colombian region. Based on these considerations, the study aims to analyze the relevance of indexing results according to keywords most frequently in undergraduate students within the region of Bogota - Colombia. To carry out this study we develop an algorithm that allows scrolling through the results of searches obtained by Google to identify the way in which these results are indexed, and validation criteria of the obtained results. Finally, it is intended to analyze these results with the aim of proposing methods that will improve the indexing of search results based on strategies and initiatives defined by the Semantic Web, and from these approaches generate strategies of linking data through Linked Data [7] and intelligent agents.
This document is structured as follows: In section 2, all the key aspects associated with resource search, search engines and valid methods of analysis for our study will be addressed. Section 3 shows the implementation of the algorithm necessary to scroll through the results detailing its use and showing a guide to apply it in other related researches. In section 4, preliminary results analysis that the algorithm implementation produces will be presented making punctual emphasis in the actual results vs. the shown results. Section 5, we present discussion of our study. As a final point, conclusions and the future applications of this research are presented.
II. B
ackgroundVisual Analytics is a field that arises from the visualization of information and its practice has as a target to support the analytic reasoning through interactive visual interfaces [8]. Therefore, Visual Analytics combines techniques of automated analysis with interactive visualizations for effective understanding, reasoning and decision-making over data sets that are too big and complex [9]. Meanwhile [10] defines this analysis as the science of analytic reasoning facilitated by interactive visual interfaces. In summary, visual analytics is a tool preceding automated research; it is a tool that, with aid of interactive visual interfaces, allows us to have a deep analysis, providing information for reasoning and decision-making.
A. The relevance of visual analytics
Visual analytics includes in its work area several scientific branches such as scientific & information visualization, data mining, data management, human computer interaction, and perception cognition, that work inside its scope. For example, the integration of scientific visualization and information include works in the fields of space-time data, data analysis and management, and human perception and cognition [9].
Meanwhile, it may be set that the Semantic Web has as main purpose to lay out the information in such a way that it can be accessible by any user regardless his level of experience [2], and therefore solve the usual problems of information search. Even now that the Semantic Web has not as a purpose to become a reality and a primordial approach anymore, and spite of all the several technological efforts, it can only be partially used, whence intellectual and technological resources have to be used in a way that may meet these needs and contributes to build the Web with meaning by automating tasks like information search.
B. Contents search
With the huge growth of the Web, the availability of electronic academic resources has also grown. Nowadays, the users face the need of finding more relevant academic resources for their necessities and their personal characteristics and cultural aspects based on suitable visual search interfaces [11-13]; nonetheless, locating resources in an infrastructure like Internet, that does not stop growing, is a complex activity. For this reason, there are strategies proposed to optimize location processes. One of the most common strategies is the use of a search engine to classify web files that contain interesting material. The most known and useful in terms of the precision in the last years is Google [14], the most popular search engine in the world, even though most of them work in the same way, and only differ in classification and relevance criteria [15]. Google was designed with the purpose of giving priority to the amount of visits a page has, and in this way it assigns priority to each page [16]. This model is known as PageRank [17, 18].
When a search through Google is made, the engine makes a classification and then shows a fragment of each page (or snippet), but since there is so much information, there are occasions when the desired info is not found (generally associated to a bad search). This is the reason for which Google offers several tools to make more effective searches. Among them Advanced Search, the use of symbols like quote marks or “site”, and the versions of Google allow classification in a zone manner or by specific territories [19].
C. Related work
The study of information metric sciences has been addressed by different authors, based on the study subject of the informative disciplines. There are different areas such as focused crawling [20], distributed crawling [21], extraction based on Domain Ontology [22], based on PageRank [18, 23], among other described in [24]; were we can extract information from Internet. Mathematics, applied in different ambits in social sciences, allows problem resolution and contributes to the development of mathematical models.
There are also the bibliometric and scientometric methods that are very similar, and sometimes called identical. These allow the study of growth, size and organization of the information, allowing planning in the organization of the scientific documentation, etc. They are based on the use of statistical models [25]. Once demonstrated the effort made to conduct a search in terms of quality and optimization of resources, it is established that the amount of irrelevant responses is proportional to the high amount of information circulating in the web of webs; also the use of additional indicators to improve the search or decreasing the irrelevant results is not enough. Authors like [26] propose a weighted architecture based on the number of clicks or [27] from combinational searches and listing the results in a metric manner, it is both a promising and applicable solution.
Another study, conducted by [28] proposes methods of dynamic data and also includes the sensible testing of changes in the website, and the dynamic recovery of the linked web pages. Also, authors like [20] implemented a tracking application based on Java, and its performance, in comparison to the conventional static approaches,
was relatively good. Among the outstanding results of the experiment, it was shown a 59% improvement in the performance with the static tracking method.
In the study conducted by [29], it is addressed the question of how to build a practical system at great scale that can use the information in the hypertext. This gives an approximation of the importance and quality of a page certified by PageRank. Another study conducted by [30], proposes a series of heuristic criteria to identify trackers in the access registry of web servers. Later, the impact of the requests from robots in web caches was assessed and the behavior of the trackers was compared with the automatic buyers ‘one. In the context of their work, the authors studied the time distribution between arrivals of crawler petitions.
There is another crawler known as Nutch, which is applied as a tracking mechanism in charge of analyzing documents published in Intranet [16]. This web crawler is free and with an open code, where the description of its management and configuration is found, and which is made through the console mode of the Linux operative system.
Meanwhile, a combination between the information recovery agents with the visual analysis is the work made by [31] through the development of a tool called WebTheme. This theme helps the users to understand rapidly big amounts of information of the web and to deepen into the interesting section of such information. Several Crawlers have already been recognized, as is the case of UbiCrawler [32], a tool made in Java, under an independent architecture and lineal scalability through the use of functions based in hash operations to divide the tracking domain.
Based on these referents, the next section presents the proposed methodology of the study to present a systematic analysis of search results given by Google as a case study based on a visual analysis tool.
III. W
orkM
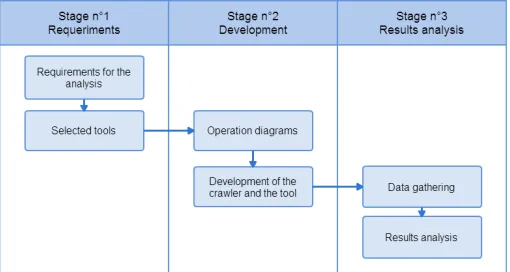
ethodologyWith the objective of building the Crawler for the analysis, a series of stages is proposed where the structure and methodology of the work to be done are shown. In Fig. 1, a diagram with the methodology, stages, and activities to carry out is shown.
Fig. 1. Work methodology (own elaboration).
A. Stage 1: requirements
1) Requirements for the analysis
Given that the proposed algorithm is a focused Crawler, it is necessary first to consider the page in which the analysis will be conducted, since it will do the search and show the results [30].
Since the objective of this study is to conduct an analysis of the results displayed in the Google search engine, the first thing to be analyzed is how Google conducts a search and how it changes the URL to move through the result pages. This activity is verified making a search in the page and observing the URL change.
As a result of this process, Google makes the search based on the URL https://www.google.com/search?q=”word_to_look_for” and advances through the pages adding &start=”number_multiple_ of_10_based_on_which_results_are_shown”, to include all the results, “&filter=0” is added. It is worth knowing that Google shows the results in groups of 10 and it does it with the header h3 with the attribute class=r.
In the same way, it is important to stand out the outputs of the algorithm to write for its development, whereby it is defined that the algorithm must show the number of results indicated by Google and the number of actual results displayed given that “Google is designed to escalate” [29], so it optimizes the results shown and it is intended to analyze this action. Additionally, it must show the pages, it went through to get coincidences among them. Therefore, the methodology to extract information is based on the work made by [32] in terms of data extraction and their type.
2) Selected tools
The algorithm was developed in Java programming language according to the recommendations made by [28]. For the open development environment, NetBeans was used, which allows the construction of the algorithm using the Jsoup library, a library that allows working with HTML documents to analyze them and extract information from them. Likewise, for the complete tool JFreeChart library will be implemented, a library in charge of graphic management.
B. Stage 2: development and elaboration of the algorithm
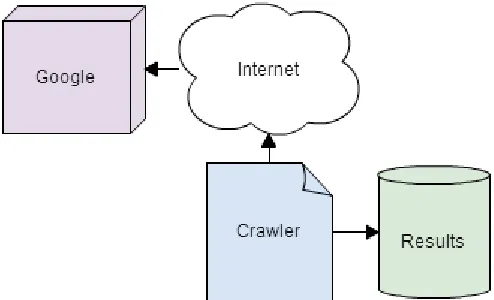
In this stage a Crawler will be constructed for data gathering and the complete tool for the analysis. For that, a diagram of operation and the necessary methods for the development are defined considering the architecture of a query on Internet proposed by [33].
1) Operation diagram
The operation of the algorithm is shown in Fig. 2 where the tool connects to Internet, specifically to the Google search engine and then it shows a series of results for further analysis.
Fig. 2. Algorithm operation (own elaboration).
2) Development of the crawler
The Crawler is in charge of going through the generated results, creating a list of titles, a list of links, and a list of descriptions, all generated by the search engine. The implemented Crawler has two principal methods:
The first and most important method in the Crawler is the search method. This method has the task of conducting a search in a HTML document, filtering the results and setting them apart from the total amount of links in each page. This will generate relevant data for the research. The code of this method is shown in Fig. 3.
Fig. 3. Method that searches the results of a page (own elaboration).
The search method performs a connection with an URL using the Jsoup library, and then stores all the HTML files in the document doc. To do this connection, it is necessary to identify itself as a browser, in this case Mozilla in order that the engine will allow the connection and the page scanning. After having the document stored, the extraction and filtering of relevant data for research continue. In this case the titles, the links, and the descriptions will be the relevant data. For this filters are made by class or identifiers. These filters can be made through methods included in the Jsoup library. Next, data is stored in text document for a later analysis.
The second most important method is in charge of going through the pages and sending to the first method each page so it can conduct the link search. This method is observed in Fig. 5, where, by means of a for cycle, the generated page is changing by displaying ten results each time. The method implementation is shown in Fig. 4.
Fig. 4. Method to browse the pages (own elaboration).
important to point out that the method advances from 10 to 10 since this is the number of results by page that Google shows.
3) Final architecture of the crawler
The final architecture of the Crawler is shown in Fig. 5, where the Crawler class implemented by the library Jsoup is seen. This class executes a search in the Google search engine, goes through the generated pages, lists the number of results and generates a file with the paths for a later analysis. This type of architecture is proposed in studies made by [33,34], showing good results.
Fig. 5. Architecture of the Crawler (own elaboration).
4) Graphic tool
For the implementation and visualization of the results, in the same Crawler project a library called JFreeChart is implemented, which allows to visualize the results by means of graphics. In Fig. 6, there is a diagram showing its operation.
Fig. 6. Operation of the graphic tool (own elaboration).
Based on the Crawler, the results are generated in text documents that become graphics in the Chart class and are then visualized in the Frame class. This first part only includes the number of actual results vs. the number of results given by the search engine. Then, an analysis is made in its respective class where there are identified key axis, and a deep analysis of the results of the search, and an analysis of the related results.
IV. r
esultsTo show the behavior of the results of the searches, two phases of analysis were defined: 1) analysis of the effectiveness of the tool, for which related aspects with the number of obtained results are analyzed,
as the number of unique results, and 2) objective analysis based on the obtained results with users through a definition of a study. Controlled experiments are carried out under controlled conditions, not necessarily in a real context, but in a “laboratory” or “experimental” setting. Participants were 50 undergraduate students between 18 to 25 years old and with a good level of English. Given the nature of the study, it was not necessary that users exhibit extremely specific knowledge of subject search, and neither strategy of advanced searches.
A. Analysis of the effectiveness of the tool
This study includes keywords of common usage defined through a previous study where, based on a list of candidate words chosen at random, words whose meaning can be given in a conceptual manner, that can show different types of results like images, videos or reviews were filtered. The last criterion to select the keywords is the number of results given by the search engine. With these criteria, it is desired that the amount of possible results will be variable; this with the goal of showing the results for different volumes of information.
For the analysis of results, there were proposed five queries associated to knowledge fields of general culture, through the use of different terms, which were: fossil, museum, stadiums, London, and Rome. Based on these terms, in first instance the number of actual displayed results vs. the number of results displayed by the search engine was analyzed and then the traveled web pages were listed to analyze them. To be able to do the necessary data collection, the developed Crawler is used from which two initial data were obtained.
Table I show the results of two data types obtained. The first column corresponds to the number of related results displayed by the search engine. That is, the number of resources that the search engine has classified as related even when these cannot be verified in its totality. The second column corresponds to real number of results displayed by the search engine, that is, the real number of results related to the keywords of search.
taBle I. WordsprelIMInaryanalysIs
Word Google search engineResults given by the Real results displayed based on Crawler
Fossil 2,160,000 830
Stadiums 11,000,000 710
London 163,000,000 660
Museum 211,000,000 950
Rome 583,000,000 600
As it is presented in table I, the results displayed by the search engine surpass by great numbers the real results of available resources that actually have a relation with the search made. For example, for the case of the Fossil, from the 2,160,000 results given by the search engine, there are only 830 real resources. This same process was made with several iterations per word (20), and the results, in average, were associated with the ones indicated in Table I.
B. Case study
To complement these results, a case study was conducted with the purpose of: 1) analyzing the behavior of undergraduate students at the moment of conducting a search process and 2) collating the results from the algorithm made in the Crawler with results obtained by people with experience in processes of information search on Internet. In summary, there were 5 proposed scenarios with different searches, and each scenario was evaluated with ten (10) different participants, that add up a total of 50 participants for the whole test.
of participants is made in a random manner and the results are evaluated in a general way given that the subjects have an habitual character and are non-specific to a field, that is, a group of users is defined in relation to a documental analysis of a topic as it is done in [36].
For the case study, the participants were asked for looking for information related to a knowledge field in several scenarios like:
1. The first case consisted in a search where the user would simulate being a primary school teacher and his experience was required to teach a class about mammal animals.
2. In the second case, the participant assumed the role of a student and he was asked to conduct a study about the first computer in the history.
3. In the third case a user was defined as a young person with the desire of finding the most adequate definition of the word “computing”.
4. A participant was defined with interest in knowing the benefits of a four-step engine for a motorbike.
5. Finally, the last case is presented to the user as a participant of an informal discussion where it is debated the World Ranking of best National Football Teams, for which it is necessary to consult Internet and have the best available information.
The data was gathered through an Internet survey performed to undergraduate students from different knowledge fields where the specific search case and a series of questions associated with daily situations were set where a necessity to make a low complexity search was presented. After conducting the search, they were asked to fill a form where the user provides information related to the obtainment of selected information. In this way, the participants show what their preferences are when they conduct a search and in which way the classification of relevance or veracity of the resources found is made.
The questionnaire starts by asking what was the search engine used for the research. In this way the relevance of this article was assessed when the Google search engine is used. The questionnaire continues with the query section, where it is established whether the user is using filters, the number of used keywords, and the time employed for the query. The last section of the questionnaire is related to the result assessment.
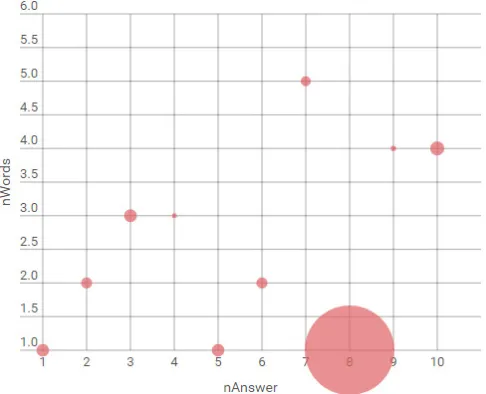
This section allows gathering information about the number of resources, the examined pages, source verification, and responsibility delegation to the search engine. A resume of volume dispersion for the first case is present in Fig. 7.
Fig. 7. Results volume dispersion for the first case (own elaboration).
Fig. 7 presents the results obtained for the first case study. In this occasion, there are responses from ten participants where a variation of the number of used keywords and the volume of results displayed by the search engine is shown. It is important to point out that each participant conducts a search with the same number of words, but with semantic differences that are not accounted for the study. Given that fig. 7 shows an unstable behavior, it is proposed to make a correlation statistical analysis in order to establish whether or not there is a relation between the number of used keywords and the dimension of the results. In order to made the study a statistical hypothesis is proposed as follows.
H1 = There is a relation between the number of keywords used by a user and the number of results displayed by the search engine.
Nonfulfillment of the previous hypothesis is taken as a null hypothesis, having an allowed error of 5%.
Based on this hypothesis, we perform a Pearson correlation analysis for the first case as presented in Table II.
taBle II.
pearsoncorrelatIonanalysIsforthefIrstcase
Correlation
nWords nResults
nWords
Pearson Correlation Sig. (bilateral)
N
1
10
-0,399
0,254 10
nResults
Pearson Correlation Sig. (bilateral)
N
-0,399
0,254 10
1
10
In the first proposed case study, there is a Pearson correlation index R of -0.399 with a significance value of 0.254, higher than the one set for 5% error. Having into account a negative value, the hypothesis which indicates that there is no relation between the number of keywords used by a user and the magnitude of results given by the search engine for the first case is rejected. From the results presented for case 2 (R = -0.01; SD= -0.997), case 3 (R = -0.212; SD= -0.613), case 4 (R = -0.465; SD= -0.176) and case 5 (R = -0.289; SD= -0.418), it can be concluded that the number of results given by the search engine is not associated to the number of keywords.
To go a little deeper into the user’s behavior regarding the number of used keywords, a Kolmogorov Normality Analysis may be established given that there is a number of data over 30. Table III presents these results.
taBle III.
user’sBehaVIorregardIngthenuMBerofWords
Normality Analysis
Kolmogorov-Smirnov
nWords Statistical gl Sig.
nResults
1,0 0,354 7 0,008
2,0 0,399 10 0,000
3,0 0,459 17 0,000
4,0 0,169 9 0,200
5,0 0,368 4 0,000
As it is presented in table III, the data is not in a normal distribution given that their significance values are under 5%. Nevertheless, in this case study it is possible to establish the users’ preference regarding the use of keywords, as it is presented in Fig. 8.
Fig. 8. Use of keywords by users (own elaboration).
C. Analysis of the participants’ behavior
The results of the case study give relevant information with respect to the number of visited pages, the number of consulted results and other user’s behaviors at the moment of conducting a search. These results are shown in Fig. 9a,9b and 10.
Fig. 9a. Analysis of results pages visited by participants (own elaboration).
Fig. 9b. Analysis of pages consulted by participants (own elaboration).
Fig. 9a and 9b, shows two initial graphics about the behavior of the participant regarding the number of average results that are evaluated to find the desired information. The first graphic shows the amount of pages that are visited in the information search. In it, it is noted that a little over half of the people (53.81%) navigate between 5 and 10 pages to complete the solicited information; while the other half is divided between the first and fourth consulted page. With these results it can be deduced (for the particular case study) that the ideal number of pages to find valid information is near to five.
The second graphic shows the information sources consulted and evaluated by the user, and it is noted that the number of consulted results is less than 10 sources (5.76%), while the ideal number of sources in average for the search process is (36.55%) for most participants. Fig. 10 shows, in a classified manner, the behavior of the participants when doing the search process.
Fig. 10. Analysis of pages consulted by participants (own elaboration).
In the conducted study, it can be seen that only 2% of people use filter to conduct a search, which shows that the task of filtering the information is completely relied on the search engine. Another important conclusion is that 7 of each 10 participants (70%) found at least one source with an attractive title but with irrelevant content or not related to the research topic. Also, 55% of people consulted only well-known or previously consulted sources, so, their initial criteria was based on their own experience. These sources, like Wikipedia, YouTube, or WordReference are consulted by over half of the people without previously verifying their references or their pertinence to the query made. In the same proportion, 55% of people repeat the search specifying the query with greater detail, adding keywords, dates or type of resource.
D. Analysis of the results obtained by the tool
Associated to the tool, from the obtained results by the Crawler different conclusions may be obtained. First, there is a minimal existent relationship between the displayed data and the actual data displayed after a search process. Among actual displayed data it may be classified by the type of displayed source and their respective quantities. This data is shown in Fig. 11. From the actual displayed results, 55% of the titles are directly related with the search keyword, while 20% are linked to related searches or similar ones. With the same percentage, there are results shown from a same page (Wikipedia, in this case). Lastly, 5% of the results are not related since they are advertisement or others.
Fig. 11. Analysis of consulted sources (own elaboration).
could indicate that the Ranking in the search engine privileges the more recent and consulted results. In the next graphic in the same figure, it is shown the types of generated content: in 39% of the cases, there are shown pages from private companies (.com) followed by pages with domain of the country where the search is conducted. In this case: Colombia (.co) with a 50%.
Fig. 12. Analysis of the types of consulted resources (own elaboration).
V. d
IscussIonsIt is important to perform a previous evaluation of all the tools that will be used to provide the resources and their qualities in an appropriate manner. That being said, it is important to point out that the used search engine blocks periodically these tracking algorithms, and so the final tool needs waiting times to be employed in an experimental manner, but its results fulfill the objective of the research and provide enough bases for the next related studies.
Besides these aspects, it can also be said that the classification of resources the user does to prioritize a result, is based in his experience with the consulted page and he fully trusts on the ranking presented by the search engine, so much that the results supposed as trustable ones are not superior to five and the rigidness of the query is minimal, in barely the first five pages of displayed results.
In the results analysis a great volume of results may be identified in the displayed resources that is not relevant to the solicited information by participants in a search process. Therefore, the construction of tools that allow to catalog and explore information in the Web is essential and fundamental in the process of analysis of great volumes of data. For that reason, a good classification of the information is fundamental for the development based on Semantic Web for the linking of metadata [37, 38], that allows a classification of digital resources in a way that optimizes the search processes.
VI. c
onclusIonsThe implementation of a Crawler type tool to systematically browse over the web allows a fast classification of the results in a way that can be contrasted with a desired number of results to make an evaluation of a search. In this way relevant results are obtained like the lack of organization and distribution of the information in the Web.
The exhibited case study about the behavior of the users that conduct Internet searches was fundamental in the results of this study, since it permits the modeling of the behavior of the participants regarding their
preferences or practical modes to conduct a search. According to these results, different aspects of behavior are evident like: i) the high grade of detachment when confirming the sources of the resources, ii) the minimum use of elements to intensify the searches like filters or related words, and iii) the unconditional acceptation of keywords suggested by the search engine.
As future work, it is intended to propose strategies that integrate agent systems or adaptive multi-agents, equipped with an initial experience defined by keywords or characteristics categorization [39], and needed by conventional users typified. In this strategy it is necessary to carry out a characterization of the user types based on the search needs and supply an agent system with criteria obtained based on the quality and quantity of given keywords. In the same way, it is proposed as a guide the use of open educational resources to conduct linking processes through technologies like Linked Data [7]. This way, the inter-operability of digital resources through semantic models that classify them may be used based on related knowledge fields, using information visualization and classification methods like the ones defined by [12]. For this, the use and classification of educative repositories by related topics is proposed, so that a web of repositories with academic content and specialized according to the needs of users using tools previously mentioned like Linked Data [40], categorization or agent systems, will be available to implant new methods of search based on specialized search engines.
a
cknoWledgMentThe authors gratefully acknowledged to Universidad Distrital Francisco José de Caldas trough GIIRA Research group.
r
eferences[1] N. Askitas and K. F. Zimmermann, “The internet as a data source for advancement in social sciences,” Int. J. Manpow., vol. 36, no. 1, pp. 2–12, 2015. doi: 10.1108/IJM-02-2015-0029
[2] G. Stumme, A. Hotho, and B. Berendt, “Semantic Web Mining. State of the art and future directions,” Web Semant., vol. 4, no. 2, pp. 124–143, 2006. doi:10.1016/j.websem.2006.02.001
[3] J. Zhao, X. Lu, X. Wang, and Z. Ma, "Web Information Credibility: From Web 1.0 to Web 2.0." International Journal of u-and e-Service, Science and Technology, vol. 8, pp. 161-172, 2015. doi: http://dx.doi.org/10.14257/ ijunesst.2015.8.7.16
[4] J.W. Fritch, "Heuristics, tools, and systems for evaluating Internet information: helping users assess a tangled Web". Online Information Review, vol. 27, pp. 321-327, 2003. doi:10.1108/14684520310502270. [5] B. Frazier, "Niche Search Engines: Expanding Information Discovery."
The Reference Librarian, vol. 54, pp. 168-174, 2013. doi:10.1080/02763 877.2013.755440
[6] M. Suárez-Barón and K. Salinas-Valencia, “An approach to semantic indexing and information retrieval,” Rev. Fac. Ing. Univ. Antioquia, no. 48, pp. 174–187, 2009.
[7] C. Bizer, T. Heath, and T. Berners-Lee, “Linked data-the story so far,” Semant. Serv. Interoperability Web Application Emerging Concepts, pp. 205–227, 2009. doi:10.4018/jswis.2009081901
[8] N. Andrienko and G. Andrienko, “Visual analytics of movement: An overview of methods, tools and procedures,” Information Visualization., vol. 12, no. 1, pp. 3–24, 2013. doi:10.1177/1473871612457601
[9] D. Keim, G. Andrienko, J.D. Fekete, C. Görg, J. Kohlhammer, and G. Melançon, “Visual analytics: Definition, process, and challenges,” Lect. Notes Comput. Science, vol. 4950 LNCS, pp. 154–175, 2008. doi:10.1007/978-3-540-70956-5_7
[10] J. Kohlhammer, D. Keim, M. Pohl, G. Santucci, and G. Andrienko, “Solving problems with visual analytics,” in Procedia Computer Science, 2011, vol. 7, pp. 117–120. doi:10.1016/j.procs.2011.12.035
digital repositories,” Online Inf. Rev., vol. 38, no. 2, pp. 284–304, 2014. doi:10.1108/OIR-03-2013-0051
[12] P. A. Gaona-García, S. Sánchez-Alonso, and C. E. Montenegro Marín, “Visualization of information: a proposal to improve the search and access to digital resources in repositories,” Ingeniería e Investigación, vol. 34, pp. 83–89, 2014. doi: 10.15446/ing.investig.v34n1.39449
[13] P. A. Gaona-García, G. Stoitsis, S. Sánchez-Alonso, and K. Biniari, “An Exploratory Study of User Perception in Visual Search Interfaces Based on SKOS.” Knowledge Organization, vol. 43, no. 4, 2016.
[14] J. Edosomwan and T. O. Edosomwan, “Comparative analysis of some search engines.” S. Afr. J. Sci., vol. 106, no. 11–12, 2010. doi:10.4102/ sajs.v106i11/12.169
[15] D. Tümer, M. A. Shah, and Y. Bitirim, “An empirical evaluation on semantic search performance of keyword-based and semantic search engines: Google, yahoo, msn and hakia,” in Proceedings - 2009 4th International Conference on Internet Monitoring and Protection, ICIMP 2009, 2009, pp. 51–55. doi:10.1109/ICIMP.2009.16
[16] P. Gupta, S. K. Singh, D. Yadav, and A. K. Sharma, “An improved approach to ranking web documents,” J. Inf. Process. Syst., vol. 9, no. 2, pp. 217–236, 2013. doi:10.3745/JIPS.2013.9.2.217
[17] T.H. Haveliwala, "Efficient Computation of PageRank," Stanford Univ. Technical Report, 1999.
[18] T. H. Haveliwala, “Topic-sensitive PageRank: a context-sensitive ranking algorithm for Web search,” IEEE Transactions on Knowledge and Data Engineering, vol. 15, no. 4. pp. 784–796, 2003. doi:10.1109/ TKDE.2003.1208999
[19] C. Kliman-Silver, A. Hannak, D. Lazer, C. Wilson, and A. Mislove, “Location, location, location: The impact of geolocation on web search personalization,” in Proceedings of the ACM SIGCOMM Internet Measurement Conference, IMC, 2015, vol. 2015-October, pp. 121–127. doi:10.1145/2815675.2815714
[20] W. Zhang and Y. Chen, “Bayes topic prediction model for focused crawling of vertical search engine,” in Proceedings - 2014 IEEE Computers, Communications and IT Applications Conference, ComComAp 2014, pp. 294–299. doi:10.1109/ComComAp.2014.7017213
[21] L. Zhang, H, Song, S. Yu, F. Ma. “Design and implementation of a high-performance distributed web crawler,” Shanghai Jiaotong Daxue Xuebao/ Journal of Shanghai Jiaotong University, Vol 38, pp. 59-61, 2004. [22] L. Liu, T. Peng, "Post-processing of Deep Web Information Extraction
Based on Domain Ontology," Advances in Electrical and Computer Engineering, vol.13, no.4, pp.25-32, 2013. doi:10.4316/AECE.2013.04005 [23] S. Brin, “The anatomy of a large-scale hypertextual Web search engine 1,”
Comput. Networks, vol. 30, no. 1–7, pp. 107–117, 1998.
[24] M. A. Kausar, V. S. Dhaka, and S. K. Singh, “Web crawler: a review,” Int. Journal Computer Application, vol. 63, no. 2, 2013. doi: 10.5120/10440-5125
[25] A. Martínez-Rodríguez, “Cybermetric indicators: New proposals to measure information in the digital environment” ACIMED, vol. 14, no. 4, 2006.
[26] F. Ahmadi-Abkenari and A. Selamat, “An architecture for a focused trend parallel Web crawler with the application of clickstream analysis,” Inf. Sci. (Ny)., vol. 184, no. 1, pp. 266–281, 2012. doi:10.1016/j.ins.2011.08.022 [27] V. Raval and P. Kumar, “SEReleC (Search Engine Result Refinement
and Classification) - A Meta search engine based on combinatorial search and search keyword based link classification,” in IEEE-International Conference on Advances in Engineering, Science and Management, ICAESM-2012, 2012, pp. 627–631.
[28] K. S. Kim, K. Y. Kim, K. H. Lee, T. K. Kim, and W. S. Cho, “Design and implementation of web crawler based on dynamic web collection cycle,” in International Conference on Information Networking, 2012, pp. 562– 566. doi:10.1109/ICOIN.2012.6164440
[29] S. Brin and L. Page, “Reprint of: The anatomy of a large-scale hypertextual web search engine,” Comput. Networks, vol. 56, no. 18, pp. 3825–3833, 2012. doi:10.1016/j.comnet.2012.10.007
[30] M. D. Dikaiakos, A. Stassopoulou, and L. Papageorgiou, “An investigation of web crawler behavior: Characterization and metrics,” Comput. Commun., vol. 28, no. 8, pp. 880–897, 2005. doi:10.1016/j. comcom.2005.01.003
[31] M. A. Whiting and N. Cramer, “WebThemeTM: Understanding web information through visual analytics,” Lecture Notes Comput. Sci.
(including Subser. Lect. Notes Artificial Intelligent Bioinformatics), vol. 2342 LNCS, pp. 460–468, 2002. 10.1007/3-540-48005-6_41
[32] P. Boldi, B. Codenotti, M. Santini, and S. Vigna, “UbiCrawler: A scalable fully distributed Web crawler,” Software - Practice Exp., vol. 34, no. 8, pp. 711–726, 2004. doi:10.1002/spe.587
[33] N. Singhal, A. Dixit, R. P. Agarwal, and A. K. Sharma, “Regulating frequency of a migrating web crawler based on users interest,” International Journal Engineering Technology, vol. 4, no. 4, pp. 246–253, 2012. [34] R. Shettar and G. Shobha, “Web crawler on client machine,” in
Proceedings of the International MultiConference of Engineers and Computer Scientists, 2008, vol. 2.
[35] J. Nielsen, “Usability inspection methods,” in Conference on Human Factors in Computing Systems - Proceedings, 1994, vol. 1994-April, pp. 413–414. doi:10.1145/259963.260531
[36] M. Maguire, “Methods to support human-centred design,” Int. J. Hum. Comput. Stud., vol. 55, no. 4, pp. 587–634, 2001. doi:10.1006/ ijhc.2001.0503
[37] M. A. Marzal, J. Calzad-Prado, M. J. C. Ruiz, and A. C. Cerveró, “Development of a controlled vocabulary for learning objects’ functional description in an educational repository,” in Proceedings of the International Conference on Dublin Core and Metadata Applications, 2006.
[38] D. Manjula and T. V Geetha, “Semantic search engine,” J. Inf. Knowl. Manag., vol. 3, no. 1, pp. 107–117, 2004. doi:10.1142/S0219649204000729 [39] C. Cobos, E. León, and M. Mendoza, “A harmony search algorithm for
clustering with feature selection,” Rev. Fac. Ing. Univ. Antioquia, no. 55, pp. 153–164, 2010.
[40] F. J. Serón and C. Bobed, “VOX system: a semantic embodied conversational agent exploiting linked data,” Multimedia Tools Application, vol. 75, no. 1, pp. 381–404, 2016. doi:10.1007/s11042-014-2295-5.
Ricardo Beltrán-Alfonso: Student of computer science at the engineering Faculty of the Universidad Distrital Francisco Jose de Caldas.
Paulo Alonso Gaona-Garcia: PhD in computer science and professor at the engineering Faculty, Universidad Distrital Francisco Jose de Caldas.
Andres Torres-Tautiva: Student of computer science at the engineering Faculty of the Universidad Distrital Francisco Jose de Caldas.