Volume 2, Issue 3, March 2013
Page 116
Abstract
There are a large number of refrigerants, which are used to transfer heat from low temperature reservoir to high temperature reservoir by using vapour compression refrigeration system. In this paper, experimental study was conducted to observe the power consumption of different environmental friendly refrigerant mixtures (HC mixture and R401a). It was also observed the effect of working parameters like diameter of capillary tube, working pressures and inlet water temperatures, which affect the power consumption of vapour compression refrigeration system. It was observed that R401a consumed more power than HC mixture and R134a, but there is less mass quantity of HC mixture and R401a is required in the same system. So there is less effect in environment due to leakage.
Keywords: Vapour compression refrigeration system (VCRS), refrigerant, COP, ODP, GWP
1. I
NTRODUCTIONVCRS is a system which is used to transfer heat from low temperature reservoir to high temperature reservoir with the help of working fluid, called refrigerant. There are different types of refrigerant, which were used as the working medium in VCRS in the last few decades, but they cause of ozone layer depletion and greenhouse effect.
1.1. Refrigeration system: working principle and construction
Refrigeration system consists of four basic components, i.e. a compressor, an evaporator, a condenser and capillary tubes. This system is based upon the Clausius statement of second law of thermodynamics. This statement shows, “It is impossible to construct a device which, operating in a cycle, will produce no affect other than the transfer of heat from a cooler to a hotter body.
1.2. Processes Involved In VCRS:
Figure 1 Pressure-enthalpy graph for vapour compression refrigeration system [10]. Process 1 – 2: Isentropic compression in compressor.
Process 2 –3: Constant pressure heat rejection in condenser. Process 3 – 4: Isenthalpic expansion in expansion device. Process 4 – 1: Constant pressure heat absorption in evaporator.
1.3. Mathematical Relations:
d. Heat abstraction in evaporator -
Effect of capillary diameter on the power
consumption of VCRS using different
refrigerants
Dr. A. G. Matani 1, Mukesh K. Agrawal2
1Asso. Professor, Mechanical Engineering Department, Govt. College of Engineering, Amravati, 444604, (M.S.) India.
2
Volume 2, Issue 3, March 2013
Page 117
a ew pw ew
Q
m
C
T
e. Work input in compressor -
in
W
Energy meter readingf. Power per Ton of Refrigeration- 3.5
/ in
a W P O W E R T R
Q
2. L
ITERATURER
EVIEWJames M. Calm [1], has studied the emission and environmental impacts of R11, R123, R134a due to leakage from centrifugal chiller system. He also investigated the total impact in form of TEWI and change in system efficiency or performance due to charge loss. He also summarized the methods to reduce the refrigerant losses by the system like design modifications, improvement in preventive maintenance techniques, use of purge system for refrigerant vapour recovery, servicing and lubricant changing in system.
Samira Benhadid-Dib and Ahmed Benzaoui [2], have showed that the uses of halogenated refrigerants are harmful for environment and the use of "natural" refrigerants become a possible solution. Here natural refrigerants are used as an alternative solution to replace halogenated refrigerants. The solution to the environmental impacts of refrigerant gases by a gas which contains no chlorine no fluorine and does not reject any CO2 emissions in the atmosphere. The researchers showed that emissions have bad effects on our environment. They also concerned by a contribution to the reduction of greenhouse gases and by the replacement of the polluting cooling fluids (HCFC).
Eric Granryd [3], has enlisted the different hydrocarbons as working medium in refrigeration system. He studied the different safety standards related to these refrigerants. He showed the properties of hydrocarbons (i.e. no ODP and negligible GWP) that make them interesting refrigerating alternatives for energy efficient and environmentally friendly. But safety precautions due to flammability must be seriously taken into account.
Y. S. Lee and C. C. Su [4], have studied the performance of VCRS with isobutene and compare the results with R12 and R22. They used R600a about 150 g and set the refrigeration temperature about 4 °C and -10 °C to maintain the situation of cold storage and freezing applications. They used 0.7 mm internal diameter and 4 to 4.5 m length of capillary tube for cold storage applications and 0.6 mm internal diameter and 4.5 to 5 m length of capillary tube for freezing applications. They observed that the COP lies between 1.2 and 4.5 in cold storage applications and between 0.8 and 3.5 in freezing applications. They also observed that the system with two capillary tubes in parallel performs better in the cold storage and air conditioning applications, whereas that with a single tube is suitable in the freezing applications.
R. Cabello, E. Torrella and J. Navarro-Esbri [5], have analyzed the performance of a vapour compression refrigeration system using three different working fluids (R134a, R407c and R22). The operating variables are the evaporating pressure, condensing pressure and degree of superheating at the compressor inlet. They analyzed that the power consumption decreases when compression ratio increases with R22 than using the other working fluids.
Volume 2, Issue 3, March 2013
Page 118
without any environmental problem and thus can be used as long-term alternatives for residential air-conditioning and heat-pumping applications.
Ki-Jung Park and Dongsoo Jung [8], have analyzed thermodynamic performance of two pure hydrocarbons and seven mixtures composed of propylene (R1270), propane (R290), R152a, and dimethylether (R170) was measured in an attempt to substitute R22 in residential air-conditioners. The pure and mixed refrigerants tested have GWP of 3–58 as compared to that of CO2 at the evaporation and condensation temperatures of 7 and 45 °C, respectively. Test results show that the COP of these mixtures is up to 5.7% higher than that of R22. Whereas propane showed 11.5% reduction in capacity, most of the fluids had the similar capacity to that of R22. Compressor discharge temperatures were reduced by 11–17 °C with these fluids. There was no problem found with mineral oil since the mixtures were mainly composed of hydrocarbons. The amount of charge was reduced up to 55% as compared to R22.
K. Mani and V. Selladurai [9], have analyzed a vapour compression refrigeration system with the new R290/R600a refrigerant mixture as drop-in replacement was conducted and compared with R12 and R134a. The VCRS was initially designed to operate with R12.The results showed that the refrigerant R134a showed slightly lower COP than R12. The discharge temperature and discharge pressure of the R290/R600a mixture was very close to R12. The R290/R600a (68/32 by wt %) mixture can be considered as a drop-in replacement refrigerant for R12 and R134a.
A.S. Dalkilic and S. Wongwises [10], have studied the performance on a VCRS with refrigerant mixtures based on R134a, R152a, R32, R290, R1270, R600 and R600a was done for various ratios and their results are compared with R12, R22 and R134a as possible alternative replacements. The results showed that all of the alternative refrigerants investigated in the analysis have a slightly lower COP than R12, R22, and R134a for the condensation temperature of 50 °C and evaporating temperatures ranging between −30 °C and 10 °C. Refrigerant blends of R290/R600a (40/60 by
wt. %) instead of R12 and R290/R1270 (20/80 by wt. %) instead of R22 are found to be replacement refrigerants among other alternatives.
Vincenzo La Rocca and Giuseppe Panno [11], have analyzed and compared the performance of a vapour compression refrigerating unit operating with R22, and with three new HFC fluids, substituting the former according to Regulation No 2037/2000. Here the plant working efficiency was first tested with R22 and then with three new HFC fluids: R417a, R422a and R422d. It is analyzed that the performance with the new tested fluids did not result as efficient as when using R22.
3. F
ACTORSA
FFECTING THEP
OWERC
ONSUMPTION OFVCRS
The following factors affect the power consumption of VCRS.
Properties of working fluid.
Amount of charge filled and system pressure.
Diameter of capillary tubes.
Inlet water temperature.
4. E
XPERIMENTALS
ETUP OFVCRS
The main loop of the system under study was composed of five basic components, i.e., a compressor, an evaporator, a condenser, capillary tubes and a liquid line filter–drier, as shown in Fig. 2.There was used a system of a three-phase, 220 V, reciprocating compressor originally designed for R134a refrigerant. The input power of the compressor within the system varied between 230 and 300 W. The major ingredient of the compressor lubricant was mineral oils. A silica gel drier filter was used to absorb the moisture. Compact forced air cooled type condenser was used for their good heat transfer performances. Capillary tubes of different internal diameters were used to find the optimum operating points of the system. Evaporator section was made by shell and tube type by copper tubes and stainless steel tank. For minimizing the heat loss, the evaporator tank was well insulated by puff. The refrigerants used were R134a, HC mixture (R290+R600a) and R401a.
Volume 2, Issue 3, March 2013
Page 119
Figure 2 Schematic diagram of experimental setup.Figure 3 Experimental setup.
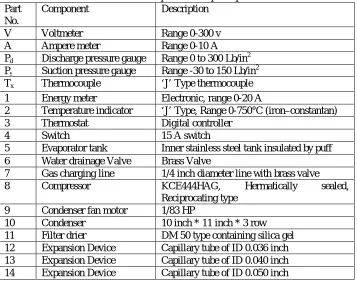
Table 1: Description of setup components Part
No.
Component Description
V Voltmeter Range 0-300 v
A Ampere meter Range 0-10 A
Pd Discharge pressure gauge Range 0 to 300 Lb/in2 Ps Suction pressure gauge Range -30 to 150 Lb/in2 Tx Thermocouple ‘J’ Type thermocouple 1 Energy meter Electronic, range 0-20 A
2 Temperature indicator ‘J’ Type, Range 0-750°C (iron–constantan) 3 Thermostat Digital controller
4 Switch 15 A switch
5 Evaporator tank Inner stainless steel tank insulated by puff 6 Water drainage Valve Brass Valve
7 Gas charging line 1/4 inch diameter line with brass valve
8 Compressor KCE444HAG, Hermatically sealed,
Reciprocating type 9 Condenser fan motor 1/83 HP
Volume 2, Issue 3, March 2013
Page 120
5. E
XPERIMENTALP
ROCEDUREThe objective of the study was to compare the power consumption per ton of refrigeration. ‘J’ type thermocouples were used to measure the temperatures and pressures were measured by calibrated pressure gauges. The ranges of equipment used in the experimental test setup are showed in Table 1. The temperatures and pressures of the refrigerant and initial water temperatures were measured at various locations in the experimental setup as shown in Fig. 2. The compressor energy consumption was measured using an energy meter. Three manual type expansion devices were used to regulate the mass flow rate of refrigerant and to set pressure difference.
The refrigerant was charged after the system had been evacuated. The working fluids were R134a, R290/R600a (50/50 by wt %) and R401a. The refrigerant R290/R600a is a zeotropic blend, which is charged in the liquid phase due to its composition shift and temperature glide. Drop-in experiments were carried out without any modifications to the experimental apparatus. The experiment was started with R134a to set up the base reference for further comparisons with the other two refrigerants. The thermal load of the system was changed with an external electrically heated unit.
1.Experimental Results and Discussions
The experimental results obtained from the analysis of R134a, HC mixture (R290/R600A) and R401a are discussed with respect to power consumption per ton of refrigeration effect. Figure 4, 5 and 6 shows the experimental results of the parameters affecting the power consumption of system.
6.1. Capillary diameter v/s Power at pressure 70 lb/in2
a. Inlet water temperature- 23°C
(a)
b. Inlet water temperature- 30°C
(b)
Volume 2, Issue 3, March 2013
Page 121
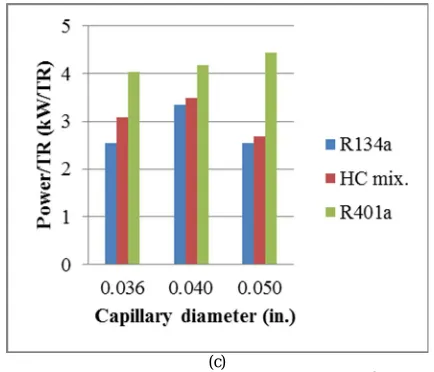
(c)
Figure 4 Power/TR at pressure 70 lb/in2.
6.2. Capillary diameter v/s Power at pressure 75 lb/in2
a. Inlet water temperature- 23°C
(a)
b. Inlet water temperature- 30°C
(b)
Volume 2, Issue 3, March 2013
Page 122
(c)
Figure 5 Power/TR at pressure 75 lb/in2.
6.3. Capillary diameter v/s Power at pressure 80 lb/in2
a. Inlet water temperature- 23°C
(a)
b. Inlet water temperature- 30°C
(b)
Volume 2, Issue 3, March 2013
Page 123
(c)
Figure 6 Power/TR at pressure 80 lb/in2.
At initial refrigerant pressure 70 lb/in2 in the system, figure 4, (a, b and c) indicates that power consumption of R134a is less than other two refrigerants at 23°C and 30°C initial water temperature. Figure 4 also shows that HC mixture having approximately same power consumption as R134a at 0.050 inch capillary diameter.
At other refrigerant pressure 75 lb/in2 in the system, figure 5, (a, b and c) indicates that power consumption of R134a is approximately same as HC mixture but less than R401a at all initial water temperature and capillary diameter conditions.
At last refrigerant pressure 80 lb/in2 in the system, figure 6, (a, b and c) indicates that power consumption of HC mixture is less than R134a and R401a at 0.050 inch capillary diameter.
By all graphs it is indicated that normally R134a has less power consumption than other two refrigerants but HC mixture shows better performance (less power consumption) at capillary diameter 0.050 inch.The power consumption of R401a is very much higher than others.
6. C
ONCLUSIONSAnalysis on a VCRS with the new refrigerant blend as substitute for R134a was made and the following conclusions were drawn.
• Power consumption per ton of refrigeration of HC mixture (R290/R600a) was lower than other two refrigerants at all working pressure and inlet water temperature at capillary diameter 0.050 inch. So it can be used as working medium in air conditioning system.
• Power consumption per ton of refrigeration of R401a is always higher than other two refrigerants, so it is not efficient in use in general purpose.
During the experimental test HC mixture was found to be safe. However care should be taken when using HC mixture in a vapour compression refrigeration system. From the two major environmental impact (ozone layer depletion and global warming) point of view this HC mixture (R290/R600a) can be used as a drop-in replacement refrigerant for R134a.
Nomenclature
Symbol Meaning
COP Coefficient of performance
GWP Global warming potential
ODP Ozone depletion potential
GHG Greenhouse gas
TEWI Total equivalent warming impact
CFC Chlorofluorocarbon
HCFC Hydro Chlorofluorocarbon
HFC Hydrofluorocarbon
HC mixture 50% of R290 and 50% of R600a
R11 Trichlorofluoromethane
Volume 2, Issue 3, March 2013
Page 124
R22 Monochlorodifluoromethane
R32 Methylene Fluoride
R125 Pentafluoroethane
R134a Tetrafluoroethane
R152a Difluoroethane
R290 Propane
R401a 53% of R22, 34% of R124a and 13% of R152a
R407c 23% of R32, 25% of R125 and 52% of R134a
R410a 50% of R32 and 50% of R125
R600 Butane
R600a Isobutane
R717 Ammonia
R744 Carbon Dioxide
R1270 Propylene
mew Mass of water in evaporator (Kg)
ΔTew Temperature difference in evaporator water (K )
Cpw Specific heat of water (KJ/Kg.K)
ID Inner diameter
References
[1] James M. Calm, “Emissions and environmental impacts from air-conditioning and refrigeration systems,” International Journal of Refrigeration 25, pp. 293–305, 2002.
[2] Samira Benhadid-Dib, and Ahmed Benzaoui, “Refrigerants and their environmental impact Substitution of hydro chlorofluorocarbon HCFC and HFC hydro fluorocarbon. Search for an adequate refrigerant,” Energy Procedia 18, pp. 807 – 816, 2012.
[3] Eric Granryd, “Hydrocarbons as refrigerants - an overview,” International Journal of Refrigeration 24, pp. 15-24, 2001.
[4] Y.S. Lee, and C.C. Su, “Experimental studies of isobutane (R600a) as the refrigerant in domestic refrigeration system,” Applied Thermal Engineering 22, pp. 507–519, 2002.
[5] R. Cabello, E. Torrella, and J. Navarro-Esbri, “Experimental evaluation of a vapour compression plant performance using R134a, R407C and R22 as working fluids,” Applied Thermal Engineering 24, pp. 1905–1917, 2004.
[6] Mao-Gang He, Tie-Chen Li, Zhi-Gang Liu, and Ying Zhang, “Testing of the mixing refrigerants HFC152a/HFC125 in domestic refrigerator,” Applied Thermal Engineering 25, pp. 1169–1181, 2005.
[7] Ki-Jung Park, Taebeom Seo, and Dongsoo Jung, “Performance of alternative refrigerants for residential air-conditioning applications,” Applied Energy 84, pp. 985–991, 2007.
[8] Ki-Jung Park, and Dongsoo Jung, “Thermodynamic performance of HCFC22 alternative refrigerants for residential air-conditioning applications,” Energy and Buildings 39, pp. 675–680, 2007.
[9] K. Mani, and V. Selladurai, “Experimental analysis of a new refrigerant mixture as drop-in replacement for CFC12 and HFC134a,” International Journal of Thermal Sciences 47, pp. 1490–1495, 2008.
[10] A.S. Dalkilic, and S. Wongwises, “A performance comparison of vapour-compression refrigeration system using various alternative refrigerants,” International Communications in Heat and Mass Transfer 37, pp. 1340–1349, 2010.
![Figure 1 Pressure-enthalpy graph for vapour compression refrigeration system [10].](https://thumb-us.123doks.com/thumbv2/123dok_us/9728669.1956536/1.595.193.399.539.669/figure-pressure-enthalpy-graph-vapour-compression-refrigeration.webp)