Analytical Method Development and Validation of Tolvaptan in Bulk and Tablet Dosage Form by RP-HPLC
6
0
0
Full text
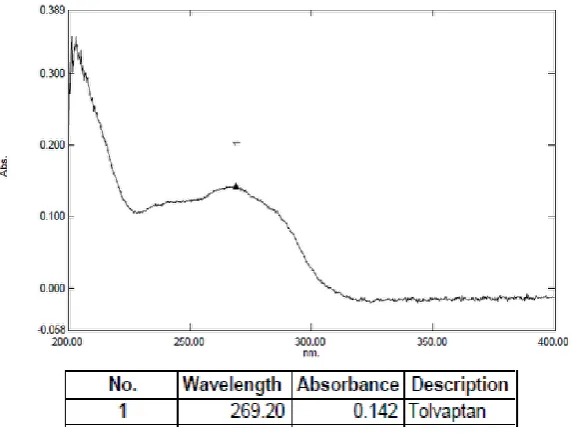
(2) 170 B.Prathyusha, et al / Int. J. of Pharmacy and Analytical Research Vol-2(4) 2013 [169-174]. Figure 1 Chemical structure of Tolvaptan. MATERIALS AND METHODS CHEMICALS AND REAGENTS Samples of tolvpatan was procured from Bio Leo.lab.Pvt.Ltd, Hyderabad, sodium dihydrogen phosphate, (AR grade), Acetonitrile(HPLC Grade) were purchased from Merck Ltd., Worli, Mumbai, India. Tablet formulation (Tolvat) was purchased from the local market.. EQUIPMENT The HPLC system used for method development and method validation was Waters HPLC e 2695 consisting of auto sampler and UV-Vis Detector with PDA. The output signal was monitored and processed using Empower 2 software.. CHROMATOGRAPHIC CONDITIONS The chromatographic column used was C18 Nucleosil, 0.01M sodium dihydrogen phosphate and acetonitrile in the ratio of 60:40 was used as mobile phase. Prior to use the solvent was filtered through a 0.45 μ membrane filter and sonicated, flow rate of 0.6ml/min was maintained. The column temperature was maintained at 450c and wavelength was monitored at 269 nm (Figure 2).. Preparation of mobile phase Prepare 0.01M NaH2PO4 using HPLC grade water(0.312gm dissolved in 200ml water).Buffer solution was then mixed with acetonitrile in the ration of 60:40.Sonicate the resulting solution and degas using 0.45μ membrane filter.. Preparation of standard solution The standard stock solution of Tolvaptan was prepared by accurately weighing 15mg of drug and transfer into a 50ml volumetric flask. To this add few ml of diluent and sonicate to dissolve the drug completely. Finally volume is made up to the mark by adding diluent. From the standard stock pipette out 10ml of the solution and transfer in to a 100 ml. volumetric flask. Add few ml of diluent and sonicate, finally make up to the volume using the same to obtain 30µg/ml concentration of Tolvaptan. Further the resulting solution was filtered through 0.45μ membrane filter.. Preparation of sample solution An accurate quantity of powder equivalent to 15mg of Tolvaptan was weighed and transferred to a 50ml volumetric flask. To this add 25 ml of diluent. sonicate to dissolve for 10 min and dilute to volume with diluent.Further filter the resulting solution through membrane filter. From the stock slution 10 ml was taken in a 100 ml volumetric flask and diluted with methanol and sonicate. This secondary stock sample solution was diluted quantitatively with diluent to obtain suitable working sample solutions for chromatographic measurements.. RESULTS AND DISCUSSION METHOD DEVELOPMENT The aim of this study was to develop a simple, accurate and precise RP-HPLC method for the analysis of Tolvaptan in bulk and tablet dosage form using mobile phase and commonly employed Nucleosil C18 column with PDA detector at 269 nm. The typical chromatogram of Tolvaptan was shown in figure 3.The optimal retention time found to be 3.055 min.. METHOD VALIDATION The aim of method validation was to confirm that the present method was suitable for its intended purpose as prescribed in ICH guidelines8,9 Q2(R1). Linearity Linearity of a detector response for Tolvaptan was demonstrated by preparing solution of Tolvaptan standard over the range of 25%-150% of targeted concentration (dosage). Chromatograms were. www.ijpar.com.
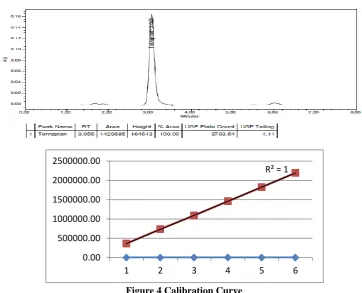
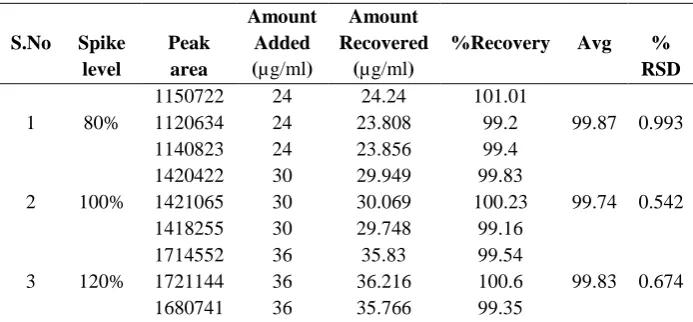
(3) 171 B.Prathyusha, et al / Int. J. of Pharmacy and Analytical Research Vol-2(4) 2013 [169-174]. recorded and the corresponding retention times and peak areas were listed in table 1.A linear relationship between concentration and area was observed in the linearity range, calibration curve was plotted and shown in figure 4.The correlation coefficient was found to be 1.. Precision The repeatability(system precision) of the method was checked by repeated analysis of the formulation for six times with the same concentration. Method precision was done by injecting six repeated injections of the standard with different dilutions. The amount of drug present in the formulation was calculated. Precision data is reported in table 2. The %RSD of the peak area of six replicate injections was found to be 0.773%, and for the method precision studies %RSD was found to be 0.024%. The values of % RSD below 2 % indicate that the method was precise.. Accuracy Accuracy of the test method is demonstrated by %recovery studies performed by spiking sample preparation with known amount of standard at three different concentration levels (80%,100% and 120% of final concentration).Samples were prepared by mixing placebo with Tolvaptan equivalent to about target concentration. Triplicates of sample for each spike level were injected and assay was performed as per the test method. From this “% Recovery” and “% RSD”. were calculated. Global recovery result is enlisted in table 3. The mean recoveries were found in the range of 99.74-99.87% which indicates that the method is accurate.. Specificity The specificity of the test method was demonstrated by studying the interferences from blank, placebo. The blank, placebo and sample solutions were prepared, injected along with the standard preparation and observed for any interference from the blank, placebo and sample solutions at retention time of analyte peak. The chromatograms were identical with nearly same retention time; specificity was confirmed by peak purity. Specificity chromatogram is shown in figure 5.. Robustness Robustness is a measure of capacity of an analytical procedure to remain unaffected by deliberate variations in method conditions. Robustness of a test method is demonstrated by carrying out intentional changes in the mobile phase flow, mobile phase composition and column oven temperature. The sample was analyzed separately by slight changes in the analytical method. Typical variations included under Validation programme were, Flow rate 0.6ml/min ± 0.2ml/min Column temperature 450c ± 50C. The data for robustness studies is reported in table 4.. Fig 2 :UV Spectrum for Tolvaptan www.ijpar.com.
(4) 172 B.Prathyusha, et al / Int. J. of Pharmacy and Analytical Research Vol-2(4) 2013 [169-174]. Fig 3: Chromatogram of standard solution of Tolvaptan.. 2500000.00. R² = 1. 2000000.00 1500000.00 1000000.00 500000.00 0.00 1. 2. 3. 4. 5. 6. Figure 4 Calibration Curve TABLE 1: LINEARITY DATA FOR TOLVAPTAN S.No. %Linearity. 1 2 3 4 5 6. 25% 50% 75% 100% 125% 150%. Pipetted from stock (ml) 2.5 5.0 7.5 10 12.5 15.0. Diluted to volume with diluents(ml) 100 100 100 100 100 100. Concentration(µg/ml) 7.5 15 22.5 30 37.5 45. TABLE 2: PRECISION RESULTS FOR TOLVAPTAN S. No. System precision. Method precision. RT. Area. RT. Area. 1. 3.060. 1421964. 3.061. 1421985. 2. 3.051. 1425199. 3.062. 1421745. 3. 3.054. 1429690. 3.059. 1421634. 4. 3.052. 1431655. 3.062. 1421345. 5. 3.076. 1449901. 3.058. 1421286. 6. 3.069. 1444792. 3.064. 1421274. AVG. 3.0603. 1433867. 3.0610. 1421545. SD. 0.0102. 11095.95. 0.0022. 290.53. %RSD. 0.3324. 0.7738. 0.0716. 0.0204. www.ijpar.com. Peak area 363874 736990 1090734 1459123 2194100 2194100.
(5) 173 B.Prathyusha, et al / Int. J. of Pharmacy and Analytical Research Vol-2(4) 2013 [169-174]. TABLE 3: RECOVERY STUDIES OF TOLVAPTAN BY RP-HPLC METHOD:. S.No. Spike level. 1. 80%. 2. 100%. 3. 120%. Peak area 1150722 1120634 1140823 1420422 1421065 1418255 1714552 1721144 1680741. Amount Added (µg/ml) 24 24 24 30 30 30 36 36 36. Amount Recovered (µg/ml) 24.24 23.808 23.856 29.949 30.069 29.748 35.83 36.216 35.766. %Recovery 101.01 99.2 99.4 99.83 100.23 99.16 99.54 100.6 99.35. Avg. % RSD. 99.87. 0.993. 99.74. 0.542. 99.83. 0.674. FIGURE 5: SPECIFICITY CHROMATOGRAM OF TOLVAPTAN. Table 4 :ROBUSTNESS STUDIES OF TOLVAPTAN Condition. Variation. Flow rate. -0.2ml/min +0.2ml/mim. Temperature. -50C +50C. Retention time(min) 3.342 3.302 2.777 2.756 3.056 3.051 3.030 3.041. %RSD 0.85 0.35 0.11 0.25. CONCLUSION The proposed HPLC method was found to be simple, rapid, precise, accurate and sensitive for the determination of Tolvaptan in bulk and tablet dosage form. Hence, this method can easily and conveniently adopted for routine analysis of Tolvaptan in pure and its tablet dosage form.. ACKNOWLEDGEMENT The authors are thankful to Bio Leo lab. Pvt. Ltd, Hyderabad for providing a gift samples, the authors are also thankful to Department of pharmaceutical analysis, Smt.Sarojini Ramulamma college of pharmacy, Palamuru University, Mahaboobnagar, Andhra Pradesh, India for encouragement.. . www.ijpar.com.
(6) 174 B.Prathyusha, et al / Int. J. of Pharmacy and Analytical Research Vol-2(4) 2013 [169-174]. REFERENCES [1] [2] [3] [4]. [5]. [6]. [7]. [8]. Australian public assessment report for Tolvaptan: 2012. USFDA: Drug safety communications: 2013. European medicines agency (emeA): CHMP assessment report for Tolvaptan: 2009. Chaudhari BG, Patel C. Development and Validation of UV -Spectrophotometric Method for the Estimation of Tolvaptan in Bulk and Tablet Dosage Form International Journal for Pharmaceutical Research Scholars-2012, Vol-1(3). S.Murugan, V.Rajasekharreddy, P. Sirisha, N. Pravallika, K.Chandrakala Method Development and Validation of Tolvaptan in Bulk and Tablet Dosage Form by RP-HPLC Method. International Journal of Research In Pharmaceutical and Nano Sciences-2013, Vol-2(1), P.No-135- 139. Chakravarthy VK, Gowrishankar D. Development and Validation of RP-LC Method for Estimation of Tolvaptan in Bulk and Its Pharmaceutical Formulation, Rasayan J. Chem-2011, Vol-4(1), P.No-165171. Murugan S, Pavan Kumar N, Kiran Kumar C, Syam Sundhar V, Harika S and Anusha P. Method. Development and Validation for Dissolution Method of Tolvaptan in Bulk and Tablet Dosage Form by UV - Spectrophotometry, Indian Journal of Pharmaceutical Science & Research-2013,Vol-3(1), P.No17-19. Validation of Analytical procedures text and methodology Q2 (R1).. [9] ICH:Validation of analytical procedures: Methodology Q2B:1996 *******************************. www.ijpar.com.
(7)
Figure

Related documents
The purposes of this study were three-fold: (1) to evaluate the default performance of existing state-of-the-art deep learning based dependency parsers on clinical text; (2) to
Participants of the present study had to be generally healthy (absence of coronary heart disease, hypertension, diabetes; dyslipide- mia), overweight or obese (defined by a body
This study aimed to develop and pilot test an educa- tional video containing information regarding the in- formed consent process for trauma patients undergoing surgery, develop
suis cells were detected on PAECs incubated with the negative control preparation (Figure 5d).. To assess whether the presence
In this paper we describe how a participatory, multi- method, continuous informed consent process developed by researchers, study participants and community stake- holders during
• The cattle that showed clinical signs before day 16 (early cases) stayed for a long time in the herd, and were culled only after a few days, while cattle that became sick later
Aldous EW, Mynn JK, Banks J, Alexander DJ: A molecular epidemiological study of avian paramyxovirus type 1 (Newcastle disease virus) isolates by phylogenetic analysis of a
This study lends credence to previous work that showed that factors such as perceived fit, perceived individual learning support, perceived usefulness, confirmation, and
