Vol. 9, No. 1, 2017 Article ID IJIM-00899, 8 pages Research Article
Numerical study of heat transfer in fluidized bed dryers by volume of
fluid method
J. Khorshidi ∗†, T. Zarei ‡, H. Davari §
Received Date: 2014-11-19 Revised Date: 2015-06-09 Accepted Date: 2016-04-22 ————————————————————————————————–
Abstract
The purpose of this study is numerical modeling of temperature variation of phases in a two phase regime in fluidized bed dryers including particles belonging to Group D of geldart classification. The mass transfer between phases is not taken into consideration in this modeling which has been assumed in three-dimensional, unsteady, and two-phase regime.To verify the modeling we consider the domain so that we will be able to compare the results with the experimental study has done by khorshidi et al [1]. At first we choose the governing equations according to problem physics and solving method. Then by designing an appropriate grid, we solved the governing equation by the volume of fluid (VOF) method, a suitable method to solve multi-phase problems; finally we obtained thermal variations of gas and solid phase, the contours of temperature, pressure, and volume fraction.The comparison of numerical and experimental study results revealed that there was an appropriate adaptation between them. Also, the temperature contours proved that perfect mixing hypothesis that has been introduced by some researchers is a true one and has adaptation with this research results.
Keywords: Volume of fluid (VOF) method; Heat transfer; Fluidized bed; Two phase flow.
—————————————————————————————————–
1
Introduction
F
othroughout the world in order to keep ther the centuries, drying has been used industrial products, food and agricultural prod-ucts. Drying process is currently one of the prin-cipal methods of storage of perishable materi-als or those which are reactive to high humidity. Moreover, this method is one of the most impor-tant operational units for use in a wide range of industries, particularly the food industry.∗Corresponding author. [email protected] †Department of Mechanical Engineering, Hormozgan
University, Bandarabbas, Iran.
‡Department of Mechanical Engineering, Hormozgan
University, Bandarabbas, Iran.
§Department of Mechanical Engineering, Hormozgan
University, Bandarabbas, Iran.
Drying process is complicated process involving heat, mass and momentum transfer. This process causes destructive and nondestructive irreversible changes in physical, chemical and apparent prop-erties such as color, viscosity and breakdown of hydrocarbons which may reduce the quality of the product. For this reason, it is important to use the best method to dry each product in order to establish minimum quality loss and the opera-tions be performed in minimum time.
One of the most commonly used types of dry-ers in the industry, are fluidized bed drydry-ers in which solid particles are suspended and floated in warm air flow. Due to the high capacity, low manufacturing cost, easy operation and high effi-ciency (high heat and mass transfer coefficients) fluidized bed dryers are used in a wide range of industries.These dryers could be used for
A lot of studies have been done for modeling heat transfer in these dryers; many researchers who conducted these studies have usedequations of equilibrium between phases which are famous for two-phase and three-phase methods. A few numbers of those researchers have done direct so-lution of equation by 3-d modeling and numer-ical methods because solving this equation in a three-phase, unsteady, and porous domain is very complicated. Wildhagen et al [5] used a three-phase model to study heat and mass transfer in a fluidized bed dryer consisted of porous alumina. The solid phase assume perfectly mixed and the bubble phase and interstitial gas phase assume one dimensional. Vitor et al [4] investigated dry-ing process of tapioca belong to Geldart group D particles. Like the previous study, they used three-phase model.
Rizzi et al [3] performed a numerical and ex-perimental modeling of a fluidized bed dryer con-taining low moisture grass seeds which belonged to group D of Geldart classification. In this study Rizzi also considered the heat transfer from bed surfaces. They ignored mass transfer between phases because there was a low percentage of seed moisture.With modification of three-phase model, Khorshidi et al [1] presented a correlation for heat transfer coefficient between solid phase and interstitial gas phase for colza seeds belong-ing to group D of geldart classification.The aim of this research is numerical study of two phase flow regime in fluidized bed dryer using direct so-lution of equations by volume of fluid method. At first, we solve the governing equations of vol-ume of fluid (VOF) method according to initial and boundary conditions and geometry, and then we calculate temperature variation of each phase, pressure, temperature, and volume fraction con-tours.To ensure the correctness of modeling, we consider the conditions and calculating domain such as khorshidi et al. [1] experimental study.
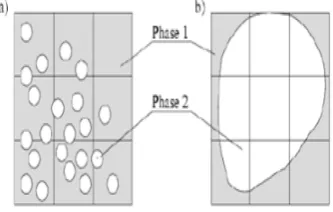
Figure 1: Locating each phase in cells in VOF method
Figure 2: Dimensions of bed
2
Materials and methods
Symptoms:
P: Pressure
V: velocity
E: Energy
T: Temperature
u: Inlet gas velocity
Tg◦: Inlet gas temperature Ts◦: Solid particles temperature. M: mass of particles
L: Fluidization height
F and aq: Locating of each phase in the cells
function
kef f: Effective heat conductivity µ: Dynamic viscosity
V: Cell volume
Uf: Volume flux inputs .
mpq: Mass transfer rate from phase q to phase p saq: Energy source term
2.1 Introducing volume of fluid (VOF) method
re-Figure 3: Generated mesh.
Figure 4: Boundary conditions
searchers to study the multi-phase problems. This method is mostly applicable to free bound-aries problems; besides, volume fraction of each phase in the grids is an effective factor in this method. To this end, a function F is generated for each cell that at any time has one of the values listed in Table 1:
Table 1: Locating of each phase in the cells
F = 0 Cell only contain phase 1
F = 1 Cell only contain phase 2 0< F <1 Cell contain mixture of two
phases
The correct form of locating phases in cells in VOF method is shown in Fig1.
Volume fraction limit: Volume fraction cut-off is a factor to control volume fraction in modeling. So that if volume fraction of one phase in one cell is less than the amount of volume fraction cut-off, the amount of that phase in that cell will be considered zero. In this study we consider this factor as equal as 1-6 less amounts will diverge the solution.
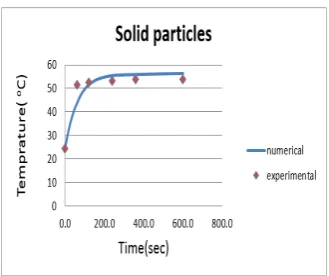
Figure 5: Solid particles temperature comparison (test no.1)
Figure 6: Output air temperature comparison (test no.1)
2.2 Governing equations
Next, we will introduce the governing equation related to VOF method which includes continu-ity, momentum, and energy equations.
Continuity equation:
The relation between phases is obtained by solv-ing continuity equation of volume fraction of phases.
1
ρq
[ ∂
∂qt
(aqρq) +∇.(aqρq⃗vq)
=saq + n
∑
p=1
(m.pq− .
mqp)] (1)
In which m.qp indicates mass transfer from phase
q to p and m.pq mass transfer from p to q. Also
indicates mass source; all of this terms in this study are zero. Discretized form of this equation is presented below:
anq+1anq+1−anqρnq
∆t V +
∑
f
(ρanq+1Ufn+1anqf+1)
= [saq + n
∑
p=1
(m.pq− .
Figure 7: Solid particles temperature comparison (test no.2)
Figure 8: Output air temperature comparison (test no.2)
In which aq is F function, V is cell volume and Ufn+1is volume flux inputs for each cell depending on normal velocity.
Momentum equation (Navier-stokes):
Only one equation will be solved for the whole do-main and obtained velocity field which is common to all phases. The following equation depends on volume fraction, viscosity, and density.
1
ρ⃗v +∇.(ρ⃗v⃗v) =
∇p+∇.[µ(∇⃗v+∇⃗vT) +ρ⃗g+F⃗] (3)
Energy equation:
Energy equation for each phase is as follows:
∂ ∂t
(ρE) +∇.(⃗v(ρE+ρ)) =∇.(kef f∇T) +Sh
(4)
kef f is effective thermal conductivity for each
phase and his the source term.
In volume fluid method, energy and temperature are calculated in mass average form by Eq. 5:
E= ∑n
q=1αqρqEq
∑n q=1αqρq
(5)
Material property:
Figure 9: Mixture phase temprature for test no.1 at 10 second
Figure 10: Mixture phase temprature for test no.1 at 30 second
To achieved properties of each phase such as velocity, density, etc. we use following correlation which calculates properties of each phase in a cell as a function of volume fraction of phase in that cell. For example, for density we use subsequent equation:
ρ=a2ρ2+ (1 +a2)ρ1 (6)
2.3 Modeling process
2.3.1 Grid generation
Figure 11: mixture phase temprature for test no.1 at 30 second
Figure 12: mixture phase temprature for test no.1 at 50 second
Table 2: generated mesh characteristics
Number of cells 324043
Number of plains 658156
Number of nodes 59207
Number of partitions 4
2.3.2 Flow regime characteristics
At first, it is necessary to specify characteristics of flow passed from the bed. According to average velocity of air flow through the bed and its ini-tial dimensions, the Reynolds number is in lam-inar flow range. Since the temperature changes from system start up moment to the moment that flow become steady, we model this problem an unsteady one. Turbulence is one of the most ef-fective factors of heat transfer, that increase the contact surface between gas and solid phase, in this apparatus also, small holes has been created in bed inlet to increase flow turbulence.
2.3.3 Initial condition and phase charac-teristics
Khorshidi et al [1] conducted the study with dif-ferent inlet flow temperature and velocity. We
Figure 13: Mixture phase temprature for test no.1 at 70 second
Figure 14: Mixture phase temprature for test no.1 at 70 second
verify the study by comparing the results with khorshidi experimental study. Initial conditions of two experiments are presented in Table 3. Since colza seeds and dry air produced fluidiza-tion regime in khorshidi study, their character-istics are presented in our study (Tables 4 and 5).
Table 3: Initial conditions of khorshidi et al. experi-ment [1]
Test no u Tg0 Ts0 M L
(m/s) ◦C ◦C (kg) f(m) 1 1.96 56.5 24.1 0.012 0.050 2 1.57 47.5 23 0.012 0.040
2.3.4 Boundary conditions
Figure 15: Mixture phase temprature for test no.1 at 70 second
Figure 16: Static pressure contour for test no.1 (Pascal)
Table 4: Characteristics of solid phase (colza)
(kg/m3)Density 1145.77
(J/kg.K)Specific heat-Cp 20000
(w/m.K)Thermal conduc-tivity
0.0242
(kg/kmol)Molecular 18.0152
(m)Seeds diameter 0.00178
Sphericity coefficient 0.91
Seed humidity content 0.06
Table 5: Gas phase (air) characteristics
(kg/m3)Density 1.225
(J/kg.K) Heat capacity 1006.43
(w/m.K)Thermal conduc-tivity
0.6
(kg/m.sec)Viscosity 1.78×10⁻⁵
(kg/kmol)Molecular mass 28.966
2.3.5 controlling the solution
To solve this problem by VOF method according to the problem conditions and required time for converging the result; further, because we have
Figure 17: Density contour for test no.1 (kg/m3)
Figure 18: Volume fraction of solid phase contour for test no.1
a two-phase model and the number of equations is double, the solution last very much. Time interval between steps considered 0.001 second. Discretizing methods of equations which are cho-sen according to previous experiments and sim-ilar studies are presented in Table 6. Under
re-Table 6: Discretization methods
Equation Method
Pressure velocity Simple Gradient Least square cell
Pressure Presto
Momentum Second order upwind Volume fraction First order upwind
Energy Second order upwind Transient formulation First order implicit
laxation factors: To control solution convergence we must use appropriate under relaxation factors which are shown in Table 7.
2.3.6 Solution process
dif-Figure 19: Volume fraction of gas phase contour for test no.1
Table 7: Under relaxation factors
Variables Under relaxation factor
Pressure 0.3
Density 1
Body force 1
Momentum 0.7
Volume fraction 0.5
Energy 1
ferent internal air temperature and for each case the iteration last almost ten days.Because of high number of iterations, the results were saved every 0.1 seconds. Experimental apparatus in khorshidi study is presented in a way that the outlet gas temperature has been recorded at 12 cm above bottom of bed during the process and the solid particles temperature also measured by perfect mixing assumption; its mean score is a function of time and is constant all over the bed. In this study to validate the solution we measured the gas phase temperature at 12 cm height above the bed bottom and the solid phase temperature also is average of solid particles temperature through-out the bed, in next section the results are pre-sented.
3
Results and discussion
3.1 Grid independence surveying
To study this model we generate three different grids and recognize the answers are grid indepen-dence. At last, grid that was generated by 324043 cells has been studied.
3.2 Diagram of solid particles and out-put gas temperature
The main purpose of modeling is studying the process of two phase’s temperatures changes and comparison with experimental results that are presented in Figs 5-8.
According to Figs 5-8 there is a good adap-tation between experimental and numerical re-sults which shows that VOF method is reliable for modeling this kind of problems; also, the temper-ature changes slope at the beginning of the pro-cess was very high which showed the high heat transfer between phases in this kind of dryers which is as a result of high contact area between them.
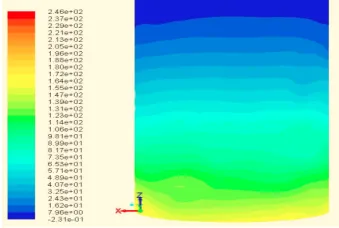
3.3 Contours
In Figs 9-15 temperature of mixture of phases has been shown from the start moment to the moment that temperature become almost steady at test no.1. These contours have been saved at 20 seconds time steps. Because of higher molec-ular mass of solid phase in the bed this phase is lower than gas phase. As one can see the up-per and lower section of the contours of bed are almost homochromatic which indicates that at each moment solid particles have the same tem-perature. It designates the good adaptation with perfect mixing assumption. Also, temperature of bed was constant at each moment and the differ-ence between maximum and minimum temper-ature is lower than centigrade degree indicating good thermal Equilibrium.
In the following, contours of density, static pressure and volume fraction for test no.1 at the moment that temperature become steady have been presented.
4
Conclusion
of the bed, the static pressure decreases sharply which is as a result of the flow porosity and the existence of the particles.As it was expected, the bed density was higher at the lower part of the bed which was as a result of the high weight of solid particles mass; moreover, the volume frac-tion of each phase is different at the lower and upper part of the bed. the volume fraction of solid phase is zero at the top of the bed. As it can be seen in the experiment, solid phase rises only to 5 centimeters height above bottom of the bed.By considering the contours of temperature of solid particles it is obvious that Perfect Mixing Hypothesis which is used to simplify equations in three-phase modeling has a good adaptation with the results of this study.By comparing the results it can be concluded that modeling of this system by Volume of Method (VOF) is a suitable method for solving Problems of these sorts.
References
[1] F. Dehbozorgi, H. Davari, J. Khorshidi,
Modified Three-Phase Modeling of Fluidized Bed Dryer of KOLZA Seeds, International Journal of Chemical and Environmental En-gineering 3 (2012) 25-22.
[2] C. W. Hirt, B. D. Nichols, Volume of fluid (VOF) method for the dynamics of free boundaries, Journal of Computational Physics 32 (1981) 201-225.
[3] JR. Rizzi, M. L. Passos , J. T. Freire,
Modeling and Simulating the Drying of Grass Seeds (Brachiariabrizantha) in Flu-idized Beds: Evaluation of Heat Transfer Co-efficient Brazilian, J. of Chemical Engineer-ing 20 (2002) 525-552.
[4] F. A. Vitor, Joao, C. Biscaia, C. Evaristo, Massarani Giulio,Modeling of Biomass Dry-ing in Fluidized Bed, International Drying Symposium B (2002) 1102-1111.
ment of Mechanical Engineering, University of Hormozgan, and his PhD degree in Chemical Engineer-ingn from Tarbiat Modares Univer-sity, Tehran, Iran. Hes research fo-cuses on experimental and numerical heat and mass transfer and computational fluid dynamics. Also, he published some research papers about Heat transfer modeling in fluidized bed dryer.
Dr. Taleb Zarei was born in Par-sian (Hormozgan), Iran in 1983. He has his BSc degree in Chem-ical Engineering from Shiraz Uni-versity and his MSc and PhD de-gree in process design from Sistan and Baluchestan University. He has been a member of academic staff of Mechani-cal Engineering department of University of Hor-mozgan since 2013. His major research interest is in the field of distillation tray, Heat exchanger and desalination, modeling and simulation using CFD.

![Table 3: Initial conditions of khorshidi et al. experi-ment [1]](https://thumb-us.123doks.com/thumbv2/123dok_us/8876813.1817357/5.595.328.496.71.184/table-initial-conditions-khorshidi-et-al-experi-ment.webp)