Volume 60, 2019, Pages 104–112
Proceedings of 11th International Conference on Bioinformatics and Computational Biology
A New Look at Codon Usage and Protein Expression
Gabriel Wright
1, Anabel Rodriguez
2, Patricia L. Clark
2, and Scott Emrich
21 Department of Computer Science, University of Notre Dame
2
Department of Chemistry & Biochemistry, University of Notre Dame
[arodri26, pclark1]@nd.edu
3
Department of Electrical Engineering & Computer Science, University of Tennessee, Knoxville
Abstract
%MinMax, a model of intra-gene translational elongation rate, relies on codon usage frequencies. Historically, %MinMax has used tables that measure codon usage bias for all genes in an organism, such as those found at HIVE-CUT. In this paper, we provide evidence that codon usage bias based on all genes is insufficient to accurately measure absolute translation rate. We show that alternative “High-φ” codon usage tables, generated by another model (ROC-SEMPPR), are a promising alternative. By creating a hybrid model, future codon usage analyses and their applications (e.g., codon harmonization) are likely to more accurately measure the “tempo” of translation elongation. We also suggest a
High-φalternative to the Codon Adaptation Index (CAI), a classic metric of codon usage bias based on highly expressed genes. Significantly, our new alternative is equally well correlated with empirical data as traditional CAI without using experimentally determined expression counts as input.
1
Introduction
Synonymous codons are triplets of RNA nucleotides that encode the same amino acid. Sub-stitutions of one synonymous codon for another are not always silent. For instance, multiple groups have shown that rare (i.e., relatively infrequent) synonymous codons often occur at the same location among homologous proteins, which could slow down translation elongation and provide additional time for the corresponding protein to fold (see [4]). There are other implications of non-random codon use. For example, some bacteria such asE. coli are used to synthesize proteins from other species. This process, called heterologous expression, can be used to produce human insulin inE. coli to treat diabetics. If codon usage is not considered, poor protein production and/or improper folding may occur [11,19,2].
protein from one species in a different host species is to replace every codon with the most common (plentiful) synonymous codon in the new host. Because common codons should be translated more quickly, this sprint could produce a peptide sequence in a minimal amount of time. However, if specific localized slowdowns are required for proper folding, few copies of these proteins will fold into functional proteins. Alternative computational methods incorporate a mathematical model of “translation tempo” to predict where translation may be relatively faster or slower. For example, we published an approach based on relative codon usage called %MinMax [6, 4]. Similar attempts using other metrics to predict elongation rate have been developed by other groups [10,14,20, 22].
In this paper we take a more holistic approach towards codon bias and protein production. If codon usage is important for regulating the speed of translation elongation, as is apparent from a number of biochemical and computational efforts [5,3], how can we best tune the tables required by many codon usage bias metrics to accurately reflect elongation rates? Historically %MinMax has relied on “ORFeome” codon usage tables, where common codons across all genes are considered “faster” and less common codons are considered “slower”. In contrast the model CAI [18], which is built using a predefined set of “very highly expressed” genes, states that the degree of codon usage bias within these highly expressed genes is a better predictor of elongation rate. CAI is one of the most commonly used codon metrics; however, predefined sets of highly expressed genes are unavailable for many organisms.
For a model of intra-gene elongation rate to be reflective of translation speed, the input codon usage tables must be well correlated with which codons are truly “fast” and “slow” within an organism. The question remains, how best to determine these tables? Given that 1) highly expressed genes are under selective pressure to chose efficiently (quickly) translated codons [9] and 2) that codon usage varies greatly within an ORFeome [3], it follows that a measure of codon usage bias that is best correlated with empirically measured expression levels is likely to be most indicative of individual codon’s translation rates. Note that, as with codon abundance, absolute translation elongation rates are likely to vary between organisms. Here we demonstrate that, although elongation rates predicted using ORFeome codon usage tables have been successfully used to predict the effects of codon substitutions on co-translational folding [16], they are less well correlated with experimental data than our new alternative.
The rest of the paper is structured as follows. In Section II we outline related codon usage efforts and motivate our specific goals. In Section III we outline our framework, specifically which data we consider, metrics we compute, and evaluations we perform. We provide our results in Section IV. Sections V and VI are a discussion and conclusion, respectively.
2
Related work
%MinMax [6] has historically been used as a visualization tool. The working hypothesis was that amino acids encoded with rare codons (defined as codon positions where the %MinMax value goes below zero) would be translated more slowly than other amino acids (values well above zero). Negative %MinMax values could indicate “speed bumps” during translation elongation that could aid in folding the newly translated protein [3].
experi-mental data on overall expression is required (compared with traditional CAI), and the ability to look at codon usage within and between genes (compared to both CAI and ROC-SEMPPR). One of the earliest and most widely used metrics of codon usage bias is the Codon Adaptation Index (CAI), which was initially proposed by Sharp and Li in 1987 [18]. CAI uses a reference set of previously determined “very highly expressed genes” to calculate codon usage frequencies. It then calculates Relative Synonymous Codon Usage (RSCU), which is simply the usage frequency for a codon divided by the average usage frequency of the set of synonymous codons for a given amino acid. This value is then normalized to be between 0 and 1 by dividing each RSCU by the max RSCU among the synonymous codons, called w. The CAI value for a gene is calculated as the geometric mean of thew values for each codon in the sequence. While still commonly used, CAI has a limitation: it requires a relevant set of highly expressed genes, which is not often available outside well-studied model organisms.
An alternative method that addresses this specific CAI weakness is Ribosome Overhead Costs - Stochastic Evolutionary Model of Protein Production Rate (ROC-SEMPPR; [9]). This method uses a Markov Chain Monte Carlo model to estimate gene expression (φ), using any relevant set of gene sequences, e.g., all predicted genes in a genome. In addition to provid-ing expression estimates for each gene, ROC-SEMPPR can produce estimated codon usage at different expression levels (see C++/R package in [12]). Although originally designed for visualization, this last feature allows for easy incorporation with any computational method requiring codon usage tables, such as %MinMax or CAI.
3
Methods
To determine the effects of codon usage bias on protein production, and to inform future mod-eling of such bias, we ran a number of tests on E. coli and S. cerevisiae. Both are popular organisms for fundamental experimental work, which provides an abundance of data for com-paring models, and for producing proteins heterologously. The latter should enable future experimental validation of said models [3].
3.1
Correlation of %MinMax and ROC-SEMPPR
Our underlying hypothesis is that any viable model for estimating translation rate should have at least a modest correlation with experimental expression data. We therefore first calculated a linear correlation between average %MinMax (median and geometric mean produced similar results) and expression estimates (φ) from ROC-SEMPPR [9], with %MinMax integrating the following models of codon usage bias (CUB):
• ORFeome: %MinMax was calculated as before (per [4, 15]), meaning that no weight-ing was performed based on expression (experimental or estimated). Like [15], codon usage tables were obtained from HIVE-CUT [1]. This approach assumes codon bias is meaningful only when measured for the entire ORFeome.
• Dynamic: As a result of ROC-SEMPPR [9], each gene is assigned an estimated expres-sion value. We next considered a new framework where CUB values were recalculated based on this estimate (i.e, log10(φ)) per gene. This approach assumes a bias gradient
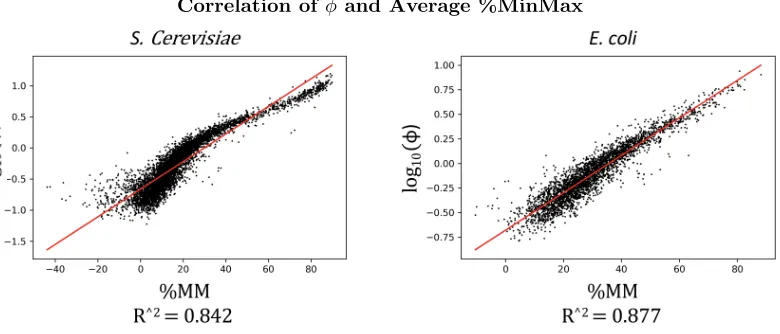
Correlation of φand Average %MinMax
Figure 1: Correlation ofφand Average %MinMax using the High-φcodon tables, withlog10(φ) set to 0.7 forE. coliand 0.74 forS. cerevisiae. The strong correlation between these two metrics under these circumstances is not surprising. Using a High-φ table causes common codons in genes that are estimated to be highly expressed to have higher relative codon usage, therefore pushing up the average %MinMax in genes with corresponding highφestimates.
• High Expression ROC-SEMPPR (High-φ): The codon usage table was calculated only once using ROC-SEMPPR’s estimates at a high log10(φ) value. This approach overcomes the need for experimental training data and assumes codon bias is clearest in highly expressed genes. High-φcodon usage corresponds to the frequencies on the right side of Figure3A.
3.2
Correlation of %MinMax, ROC-SEMPPR, and CAI with
Mea-sured Expression Counts
As a baseline, ROC-SEMPPR (φ), Average %MinMax, and CAI were independently correlated with empirically measured protein counts in the cell for both E. coli and S. cerevisiae. The expression count data was transformed using both a square root transform and a log-transform to manage the wide spread of protein abundances. %MinMax was correlated under the three CUB conditions described above. CAI was calculated usingw values (see Related Work) as per [18], as well as newly calculated w values derived from ROC-SEMPPR’s High-φcodon usage tables.
3.3
Data
Figure 2: R2values for each correlation analysis forE. coli andS. cerevisiae. While theR2for
each ROC-SEMPPR hybrid model is not exceptional, they are comparable to the empirically trained Traditional CAI. Comments on the quality of the correlations of these models with measured expression counts is given in the discussion.
from HIVE-CUT [1]. The genetic sequences for S. cerevisiae were retrieved from the NCBI Genome database, and the FASTA file was mapped to the GenBank genome file using Python. Empirically measured abundance values forE. coli andS. cerevisiae proteins were taken from [17] (Supplemental Table 6) and [8] respectively.
4
Results
ROC-SEMPPR log10(φ) and Average High-φ %MinMax showed a very strong correlation in
both E. coli (r2 =.877 ) andS. cerevisiae ( r2 =.842 ), as shown in Figure 1. These were
the highest correlations between the two models. This strong correlation was to be expected because common codons in the High-φtables are the codons that appear most frequently in the estimated highly expressed genes per ROC-SEMPPR.
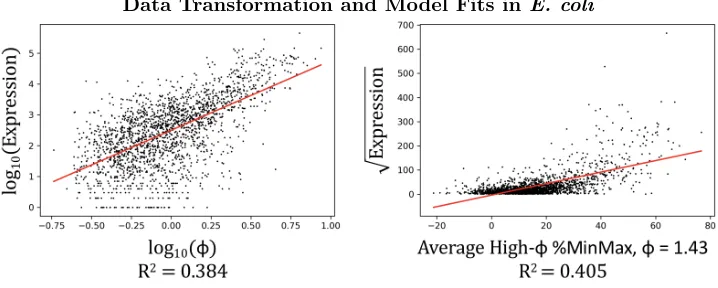
Given the wide distribution of expression data we first performed multiple data transfor-mations to minimize the effect of outliers (see Methods). When a log-transform was applied, ROC-SEMPPR log10(φ) slightly outperformed Average High-φ %MinMax at correlating with
measured expression data, while the %MinMax estimate performed slightly better when given square root transformed data. Neither metric has an exceptional R2 value, with the highest
E. coli and .425 for S. cerevisiae. However, it should be noted that neither model performs much worse than traditional CAI, which was built using empirically measured high expression genes. Comments on why the correlation between the models and empirical expression data is limited are given in the Discussion. Interestingly, ORFeome %MinMax showed almost no corre-lation with the global empirical data, resulting in the worstR2values, and Dynamic %MinMax
performed only slightly better (see Figure2for all results).
Traditional CAI values for each gene [18] were also correlated with the empirical protein measurements, and outperformed both High-φ %MinMax and ROC-SEMPPR log10(φ) in E. coli, withR2values of .413 and .480 for the two different transforms. InS. cerevisiae, CAI was
less well correlated with expression data than High-φ%MinMax for log-transformed expression data, but did better on square root transformed data.
High-φ CAI values outperformed both ROC-SEMPPRlog10(φ) and High-φ %MinMax ex-cept when using log-transformed S. cerevisiae data, making it the most well correlated of the hybrid models. It also compared favorably to traditional CAI in two of the tests, while being tied in a third. High-φCAI also had the highestR2value of any of the tests (.544 on the square
root transformedE. coli data). After close inspection this result can be explained by a compact cluster near a CAI value of 0 for lowly expressed genes, which signals that the geometric mean used to calculate CAI appropriately penalized slower translating codons in this data.
We conclude that codon usage bias in highly expressed genes is the most strongly correlated with empirically measured protein abundance levels for the tests we ran in bothS. cerevisiae and E. coli. This implies that models of translation rate which incorporate such a bias will likely be more accurate than models incorporating other options (e.g., ORFeome codon usage bias). Additionally, ROC-SEMPER-driven models can be competitive with models built using empirically measured data (i.e., traditional CAI) without requiring pre-existing expression data. Model choice for future work relating to codon usage bias should depend on the application, as %MinMax has been used to study patterns locally within a gene while CAI traditionally is used to look globally between genes.
5
Discussion
Both [18] and [9] claim that highly expressed genes are under selective pressure to choose translationally efficient (fast) codons, and that the degree of altered codon usage bias is indica-tive of expression level. This implies that a highly expressed gene is expected to have greater enrichment of said efficient codons than a more lowly expressed gene. Further, the most trans-lationally efficient (fast) synonymous codon for a particular amino acid is not always the most common synonymous codon in the ORFeome (see Figure 3). Therefore, a new codon usage measure that shows the strongest correlation with measured expression counts is likely the best estimator of which codons are actually fast or slow. Here we show that the strong correlation between High-φhybrid models and empirical expression data helps verify the claim in [9] that common codons in High-φtables are more indicative of translation elongation rate than those based solely on ORFeome usage.
CAI, a model that has been around for over 30 years, outperforms High-φ%MinMax and ROC-SEMPPR in three out of the four conditions tested. Note, however, that High-φ CAI showed comparable correlation without requiring experimental data. Also note that traditional ROC-SEMPPR log10(φ) and CAI are global estimates for overall elongation and, as a proxy,
expression. %MinMax is an established local (window-based) estimate, which we were able make into a respectable expression estimate simply by averaging its values based on High-φ
Codon Usage Variation for Phenylalanine in E. coli Modeled by ROC-SEMPPR
Figure 3:A:Predicted codon usage for the amino acid phenylalanine’s two synonymous codons, TTC and TTT, in E. coli using ROC-SEMPPR (solid lines), as opposed to the ORFeome codon usage frequency (dashed lines). Note the codon usage differences between the models, with the “preferred” codon for phenylalanine actually swapping as the estimated expression level increases. This behavior is true for a number of the amino acids in bothE. coli andS. cerevisiae.
B:Histogram of estimated expression levels (log10(φ)) forE. coli genes.
Data Transformation and Model Fits in E. coli
Figure 4: Correlation plots for log10(φ) vs log10(Expression) and Average %MinMax vs
√
Expression.
Because measures like %MinMax allow users to look at specific regions within a gene, we believe these profiles better enable harmonization of genes for improved heterologous expression, which also happens to be an ideal framework for experimental validation. In support of this, at least one recent publication proposed a CAI equivalent of %MinMax profiles for optimizing codon usage in a host species [13]. Although a comparative experimental study of the two models is needed to say which is best at producing the most well-folded proteins, we clearly show that ROC-SEMPPR can easily be combined with either approach.
abundance data, and is not as useful for genes with abundance data (as expression estimates are then no longer needed). A good rule of thumb for choosing a High-φthreshold is to simply set log10(φ) = 1. If this had been done here, theR2 values would have dropped only by an
average of .012 over all of our tests.
Finally, we note that none of the models analyzed here (%MinMax, ROC-SEMPPR φ, and CAI) preform exceedingly well at predicting empirically measured protein levels in the cell, with the highest found R2 value being .544. There are a number of possible reasons
for this observation. One possibility is that the protein measurements are noisy due to high turnover. [21] claims that “approximately one-third of newly synthesized proteins are degraded by proteasomes within minutes of their synthesis,” which could make collecting large-scale and accurate measurements difficult. Another (and equally likely) explanation is that protein production is a complex process, and there are likely other factors (i.e., initiation, nonsense errors) that play a role in overall protein expression and could be modeled in future work.
6
Conclusion
We have outlined evidence supporting the merging of two different codon-usage models, %Min-Max and ROC-SEMPPR, to improve the accuracy of modeling protein elongation rates. We also introduced a ROC-SEMPPR/CAI hybrid alternative to traditional CAI for use in species where no empirical protein expression data are available. Because %MinMax was initially de-signed to look within a gene for rare codon clusters, it is the most local of the models considered. As expected, High-φaverage %MinMax is highly correlated with ROC-SEMPPR expression es-timates, and they are also shown here to be equally correlated with empirical protein levels in the cell. Because ROC-SEMPPR does not require any expression information as input,
High-φ-driven measures do not either. These features make hybrid models (e.g. High-φ %MinMax and High-φCAI) advantageous for species without experimental expression data.
Acknowledgments
We would like to thank Tijana Milenkovic, Jun Li, Michael Gilchrist and their respective re-search groups for helpful discussions. This work was supported by the National Institutes of Health (1R01GM120733).
References
[1] John Athey, Aikaterini Alexaki, Ekaterina Osipova, Alexandre Rostovtsev, Luis V. Santana-Quintero, Upendra Katneni, Vahan Simonyan, and Chava Kimchi-Sarfaty. A new and updated resource for codon usage tables. BMC Bioinformatics, 18(1):391, Sep 2017.
[2] Florian Buhr, Sujata Jha, Michael Thommen, Joerg Mittelstaet, Felicitas Kutz, Harald Schwalbe, Marina V. Rodnina, and Anton A. Komar. Synonymous codons direct cotranslational folding toward different protein conformations. Molecular Cell, 61(3):341 – 351, 2016.
[3] Julie L. Chaney and Patricia L. Clark. Roles for synonymous codon usage in protein biogenesis. Annual Review of Biophysics, 44(1):143–166, 2015.
[5] Fabienne F. V. Chevance, Soazig Le Guyon, and Kelly T. Hughes. The effects of codon context on in vivo translation speed. PLoS Genetics, 10(6):1–14, 06 2014.
[6] Thomas F. Clarke, IV and Patricia L. Clark. Rare codons cluster.PLoS ONE, 3:1–5, 10 2008. [7] Alexander L Cope, Robert L Hettich, and Michael A Gilchrist. Quantifying codon usage in signal
peptides: Gene expression and amino acid usage explain apparent selection for inefficient codons. bioRxiv, 2018.
[8] Sina Ghaemmaghami, Won-Ki Huh, Kiowa Bower, Russell W Howson, Archana Belle, Noah De-phoure, Erin K O’Shea, and Jonathan S Weissman. Global analysis of protein expression in yeast. Nature, 425:737–41, 11 2003.
[9] Michael A. Gilchrist, Wei-Chen Chen, Premal Shah, Cedric L. Landerer, and Russell Zaretzki. Estimating gene expression and codon-specific translational efficiencies, mutation biases, and se-lection coefficients from genomic data alone. Genome Biology and Evolution, 7(6):1559–1579, 2015.
[10] William M. Jacobs and Eugene I. Shakhnovich. Evidence of evolutionary selection for cotransla-tional folding. Proceedings of the National Academy of Sciences, 114(43):11434–11439, 2017. [11] Anton A. Komar, Thierry Lesnik, and Claude Reiss. Synonymous codon substitutions affect
ribosome traffic and protein folding during in vitro translation. FEBS Letters, 462(3):387–391, 1999.
[12] Cedric Landerer, Alexander Cope, Russell Zaretzki, and Michael A Gilchrist. Anacoda: analyzing codon data with bayesian mixture models. Bioinformatics, 34(14):2496–2498, 2018.
[13] Charlotte Mignon, Natacha Mariano, Gustavo Stadthagen, Adrien Lugari, Priscillia Lagoutte, St´ephanie Donnat, Sylvie Chenavas, Cyril Perot, R´egis Sodoyer, and Bettina Werle. Codon har-monization – going beyond the speed limit for protein expression.FEBS Letters, 592(9):1554–1564, 2018.
[14] Sebastian Pechmann and Judith Frydman. Evolutionary conservation of codon optimality reveals hidden signatures of cotranslational folding. Nature structural & molecular biology, 20, 12 2012. [15] Anabel Rodriguez, Gabriel Wright, Scott Emrich, and Patricia L. Clark. %MinMax: A versatile
tool for calculating and comparing synonymous codon usage and its impact on protein folding. Protein Science, 27(1):356–362, 2018.
[16] Ian Sander, Julie L Chaney, and Patricia L Clark. Expanding anfinsen’s principle: Contributions of synonymous codon selection to rational protein design. Journal of the American Chemical Society, 136, 01 2014.
[17] Alexander Schmidt, Karl Kochanowski, Silke Vedelaar, Erik Ahrn´e, Benjamin Volkmer, Luciano Callipo, K`evin Knoops, Manuel Bauer, Ruedi Aebersold, and Matthias Heinemann. The quanti-tative and condition-dependent escherichia coli proteome. Nature biotechnology, 34, 12 2015. [18] Paul M. Sharp and Wen-Hsiung Li. The codon adaptation index-a measure of directional
synony-mous codon usage bias, and its potential applications. Nucleic Acids Research, 15(3):1281–1295, 1987.
[19] Paige S. Spencer, Efra´ın Siller, John F. Anderson, and Jos´e M. Barral. Silent substitutions pre-dictably alter translation elongation rates and protein folding efficiencies. Journal of Molecular Biology, 422(3):328 – 335, 2012.
[20] Tamir Tuller, Asaf Carmi, Kalin Vestsigian, Sivan Navon, Yuval Dorfan, John Zaborske, Tao Pan, Orna Dahan, Itay Furman, and Yitzhak Pilpel. An evolutionarily conserved mechanism for controlling the efficiency of protein translation. Cell, 141:344–54, 04 2010.
[21] Jonathan W. Yewdell. Not such a dismal science: the economics of protein synthesis, folding, degradation and antigen processing.Trends in Cell Biology, 11(7):294 – 297, 2001.