VOLUME 40, ARTICLE 30, PAGES 865
-
896
PUBLISHED 10 APRIL 2019
https://www.demographic-research.org/Volumes/Vol40/30/ DOI: 10.4054/DemRes.2019.40.30
Research Article
Fathers’ involvement with their children in
the United Kingdom: Recent trends and class
differences
Ursula Henz
This publication is part of the Special Collection on “The New Roles of Women and Men and Implications for Families and Societies,” organized by Guest Editors Livia Sz. Oláh, Rudolf Richter, and Irena E. Kotowska. © 2019 Ursula Henz.
This open-access work is published under the terms of the Creative Commons Attribution 3.0 Germany (CC BY 3.0 DE), which permits use, reproduction, and distribution in any medium, provided the original author(s) and source are given credit.
1 Introduction 866
2 Background 867
3 Methodology 870
3.1 Data and samples 870
3.2 Measures of father involvement 871
3.3 Analysis plan 872
3.4 Explanatory and control variables 875
4 Results 876
4.1 Changes in father involvement 876
4.1.1 Changes by type of childcare activity 876 4.1.2 Changes in fathers’ time with children 877
4.1.3 Gross differences by SES 878
4.2 Multivariate analyses 881
5 Discussion 886
6 Conclusion 888
7 Acknowledgements 889
References 890
Fathers’ involvement with their children in the United Kingdom:
Recent trends and class differences
Ursula Henz1
Abstract
BACKGROUND
Many studies of Western societies have documented an increasing involvement of fathers with their children since the 1970s. The trend reflects changes in the meaning of fatherhood and contributes to child well-being and gender equality. New policies in the United Kingdom might have further encouraged father involvement in the new millennium. Differences in father involvement between socioeconomic groups have caused concern since they contribute to inequality in resources available to children.
OBJECTIVES
This paper examines the recent trends and social differences in father involvement with children in the United Kingdom.
METHODS
Data from the UK Time Use Surveys 2000–2001 and 2014–2015 are analysed using regression models.
RESULTS
Fathers’ overall involvement in childcare in the new millennium has been stable but differences emerge when looking at specific childcare activities, in particular on weekend days. In 2014 fathers were less likely to provide interactive care and active fathers provided on average fewer minutes of physical care than in 2000. Fathers from higher SES groups offset some of these trends by increased participation rates in physical care in 2014 compared to 2000.
CONCLUSIONS
The stability of fathers’ involvement signifies a stalling of the transformation of the father role and progress towards gender equality in the home in large parts of the population. Father involvement on weekend days continues to diverge between high and low status groups.
CONTRIBUTION
This is the first comprehensive analysis of trends in father involvement in the new millennium using time-use data. It is the first analysis that finds no further increase of father involvement in the United Kingdom.
1. Introduction
Fathers are no longer simply economic providers for their families. The role of provider through paid work is now, perhaps more than ever, but one component of modern fatherhood. This is partly because mothers are increasingly providing for their families through paid work. But, more than this, there is an expectation that fathers today be involved – emotionally and practically – in the lives and care of their children. In tandem with changing ideas around the role of fathers, time-use research charts strong increases in the time fathers spend with children over a period spanning several decades up to the turn of the millennium (Fisher, McCulloch, and Gershuny 1999; Gauthier, Smeeding, and Furstenberg Jr. 2004; Sayer, Bianchi, and Robinson 2004). These changes likely reflect the influence of two dominant discourses around father involvement that point to the importance of parental time inputs for children’s development and wellbeing and the benefits of father involvement in promoting gender equality. A significant gender gap remains, however.
In addition, research has identified differences between fathers in different socioeconomic groups, which have widened (Sullivan 2010). These differences arguably form part of a more general pattern of divergence between the living conditions of children born into high-status groups and low-status groups (Putnam 2015; Richards, Garratt, and Heath 2016), and unequal levels of father involvement are interpreted as a further dimension of the disadvantage of children from low-status groups.
This paper examines trends in father involvement in the United Kingdom in the new millennium. Based on the strength of past increases one might expect the positive trend to have continued, especially since new policies should have encouraged father involvement in the United Kingdom. However, any trends in father involvement are also affected by the labour market conditions of fathers and their partners. The complexity of these factors makes it hard to predict particular trends in father involvement. In addition, these factors might play out differently for different socioeconomic groups, possibly sustaining past, divergent trends.
regarded as a high-quality source of information on father involvement since it is less affected than other data by recall error or social desirability bias. Many studies have used the UKTUS 2000 data for analyses of fathers’ involvement in childcare (Gracia and Esping-Andersen 2015; Gray 2006; Hook 2012; Hook and Wolfe 2012; Sullivan 2010; Sullivan et al. 2009), but so far only two studies have analysed father involvement with the UKTUS 2014. Altintaş (2016) examines the childcare time of fathers with a child under the age of five. She reports an increase of nearly 20 minutes per day between 2000 and 2014. Henz (2017) analyses the surveys as part of a cross-national study of fathers with at least one child aged 14 or younger. She finds that between 2000 and 2014, fathers’ childcare time has increased significantly both on weekdays and weekend days. By contrast, the time that fathers spent with both their partner and a child (but not doing childcare) decreased.
This paper presents a more comprehensive analysis of father involvement than these two earlier studies. It considers the time that fathers spend with children doing specific childcare activities as well as the time when fathers are with children either as the only parent or together with the mother. Since childcare is often provided in parallel with other activities, the measures capture all reported childcare activities irrespective of whether they were reported as primary or as secondary/other activities. Separate models are presented for participation in childcare and its duration.
The next section presents a review of research on trends and social inequalities in father involvement. This is followed by a description of the methods. The results section reports gross trends and results from multivariate analyses to assess changes between survey years and socioeconomic groups. The last two sections discuss the findings and draw out their implications.
2. Background
Today’s fathers are widely expected to play an active role in sharing the care of their children with mothers (O’Brien 2005). Reflecting this, a host of studies provide evidence that fathers now spend more time on childcare and more time with children than in previous decades (Bianchi 2000; Fisher, McCullogh, and Gershuny 1999; Gauthier, Smeeding, and Furstenberg Jr. 2004; Gershuny 2000; Sandberg and Hofferth 2001; Sayer, Bianchi, and Robinson 2004). Although fathers’ childcare time keeps increasing in most countries, some recent analyses show no increase for the Netherlands (Giminez-Nadal and Sevilla 2012) and the United States (Hook 2006).
child-related activities with children aged between five and fifteen years rose from about 15 minutes per day to 50 minutes per day in the same period (Fisher, McCulloch, and Gershuny 1999). Fathers’ share of all childcare time increased from around 12% to 15% in 1961 to about a third in 1999 (Fisher, McCulloch, and Gershuny 1999). These trends align with the notion that fathers today assume more of a caring and nurturing role, prioritising the quality of their emotional relationship with their children (Dermott 2008; Marsiglio and Roy 2012).
However, studies reveal that a focus on paid work continues to dominate fathers’ perspectives of their role (Brannen and Nilsen 2006; Braun, Vincent, and Ball 2011; Dermott 2008), and research using large, representative time-use data confirms that mothers continue to shoulder a substantially larger burden of the care of children than fathers (e.g., Craig 2007). It is useful to distinguish three main factors that shape fathers’ behaviour: the need for childcare, fathers’ motivation to be involved, and the opportunities to act on or obstacles to acting on these motivations. Fathers’ socioeconomic status (SES), usually measured by occupational class or level of education, plays a central role, since it is related to several of these factors.
SES differences in father involvement are well documented. Quantitative research into class differences in father involvement in the United Kingdom finds that middle-class fathers were less involved in childcare at the turn of the millennium than other fathers (Fisher, McCulloch, and Gershuny 1999; Ferri and Smith 2003), although Gray (2006) reports that fathers with a white-collar job spent more time on childcare than men in manual jobs. Long-term trends in SES differences have been identified from research using education as SES indicator. They show a substantial education gap in father involvement, widening over the last several decades (Sullivan 2010), with more-educated fathers averaging more time with children than those with relatively lower levels of education (Craig 2006a; Hook and Wolfe 2012; Sayer, Gauthier, and Furstenberg Jr. 2004; Yeung et al. 2001).
experience numerous problems when they attempt to be involved fathers, which leads to ambiguous feelings and often a wish to adhere to more traditional gender roles (Plantin, Månsson, and Kearney 2003). Both education and class indicate attitudes towards gender equality, which are also associated with father involvement with children (Bulanda 2004; Crompton 2006).
Not only does class membership reflect certain class-based dispositions towards childrearing, but differences by occupational status may also be linked to differential obstacles to fathers’ childcare, like access to flexible working (Dex and Ward 2007). Options for flexible working might allow fathers in higher-status occupations to sustain higher levels of involvement than other fathers, though Baxter (2011) finds no support for this relationship in her analysis of Australian fathers.
Major factors restricting parents’ availability for care emerge from mothers’ and fathers’ paid-work choices. A substantial body of research highlights the impact of mother’s employment on father’s involvement with children (Monna and Gauthier 2008). Broadly speaking, the more engaged mothers are in paid work, the more equally they share childcare (Craig and Mullan 2011). Therefore, the rise in mothers’ employment rates in the United Kingdom from 66% of mothers of dependent children in 2000 to 70% in 2014 (ONS 2014) and their increased hours of paid work (Connolly et al. 2016) should have led to higher levels of father involvement. However, such a straightforward extrapolation ignores the possible use of other sources of childcare, whether formal or informal. The take-up of formal childcare has increased in the first decade of the new millennium but formal childcare in the United Kingdom is costly outside the limited number of subsidized places (O’Brien et al. 2016). Most couples follow a one-and-a-half-earner model, often trying to arrange mothers’ working hours so that fathers can look after the children during these times.
According to Connolly and her co-authors (2016), fathers’ average working hours decreased between 2000 and 2014, which should have lowered barriers to involved fathering. Despite the recession in 2008/2009, employment levels in 2014 were higher than before the crisis (Coulter 2016). However, the recovery from the recession was characterised by a sharp fall in real wages and increased labour market polarization. Most job creation has been in part-time or insecure jobs. Lower levels of job security might have reduced fathers’ willingness and ability to prioritize involvement in childcare, leading to a decrease in father involvement in childcare after the crisis years.
subsequently expanded. By extending statutory maternity leave it became easier for mothers to return to their previous employment, which might in turn have led to an increase in father involvement.
To conclude, although policy changes should have had a positive effect on father involvement, the complexity of labour market trends makes prediction difficult. Some changes might have affected high-status fathers differently from low-status fathers. For example, it might have been harder for fathers in low-status positions to take advantage of the new policies, and these fathers might also have been hit harder by the recession than high-status fathers. However, in both scenarios it is important to consider that fathers’ involvement might have been moderated by their partners’ adjustment to the policy and labour market changes.
3. Methodology
3.1 Data and samples
The study draws on the UKTUS 2000 and UKTUS 2014 surveys to examine fathers’ involvement with their children. Both surveys employ complex two-stage cluster-stratified sample designs. To make sure that the estimated gross trends reflect those in the UK population, post-estimation weights are applied to fully align the distribution of the number of children and the age of the youngest child to those from the 2000 and 2015 UK Labour Force Surveys.
The analysis sample comprises all men who live with a female partner2 and self-identify as a birth, adoptive, step, or foster parent or guardian of a co-resident child aged 0–14 years. In UKTUS 2000 a total of 1,456 fathers meet these selection criteria, but 393 of these fathers did not complete any adult time-diary. Excluding father diaries for which there is no matching partner diary on the same day and also poor-quality diaries leaves 1,012 fathers for the analyses. In UKTUS 2014 a total of 935 fathers meet the initial selection criteria, but 201 did not fill in any diary. Excluding all diary days without a matching partner diary on the same day as well as poor-quality diaries reduces the analysis sample to 674 fathers. The analyses of time with children are based on smaller samples, because not all eligible children completed child diaries on the same day as the father. The 1,012 fathers in UKTUS 2000 contribute 966 diaries for weekdays and 925 diaries for weekend days. The corresponding numbers for UKTUS 2014 are 635 and 638, respectively.
3.2 Measures of father involvement
The analysis draws on a well-established conceptualisation of father involvement, centred on the nature of the time fathers spend with children. Lamb et al. (1985) distinguished between fathers’ direct interactions with children, the time they are available to their children, and the degree of responsibility they have for their children. The first two of these have since become known as ‘engagement’ and ‘availability’ and have been widely operationalized using time-diary data (Pleck and Stueve 2001). Engagement refers to times when fathers are performing childcare or engaging in shared leisure activities, and thus focuses on what fathers are doing. Availability focuses more on co-presence or proximity to children rather than on activities with children, and can be thought of as supervisory childcare. The presence of the mother can change the nature of fathers’ co-presence with their children from times when they are responsible for the child as the only available parent to ‘family time’ when parents and children spend time together.
In both surveys, for every 10-minute slot respondents recorded their main activity and any secondary/other activity, people that were co-present, and their location. I use this information to derive a range of measures of fathers’ engagement with and availability to their children. Because both surveys followed the conventions of International Time Use surveys, identical measures can be derived for most concepts. There are, however, a few exceptions. One difference between the surveys is that the 2000 survey collected information about a secondary activity, whereas the 2014 survey asked about all other activities. If any of these other activities was a childcare activity, for this analysis it is coded as a secondary childcare activity. Only 64 diaries mention childcare as a second or third other activity. Another difference relates to how parents report being ‘with’ a child in their diaries. UKTUS 2000 includes two indicators, one for children under age 10 and one for children aged 10 to 14, whereas UKTUS 2014 only provides a single indicator for children aged seven years or younger. This will be further discussed below.
A first set of measures of father involvement focuses on fathers’ engagement in specific childcare activities. I distinguish between engagement in care activities such as feeding and bathing (‘physical care’); reading, playing or talking to a child (‘interactive care’); time spent teaching a child; and time accompanying a child. Since fathers reported very low amounts of time teaching their children, interactive care and teaching are combined into a single category in the multivariate models. Fathers’ time spent in childcare activities includes all times when they reported childcare as a primary or secondary/other activity.3
3 Episodes of childcare as secondary/other activity are only counted when childcare was not reported as
A second set of measures concentrates on the time that fathers spend with children net of specific childcare activities by the father. The surveys offer two different ways of measuring this time: by drawing on the indicators about co-presence during an activity or by comparing the locations that parents and older children reported in their diaries. The location-based measure is more ‘objective’ than reports of ‘being with’ a child. However, the location-based measure relies on parents and children reporting exactly the same location, which can be challenging for unusual or ambiguous situations.
In both surveys the information about being with a child younger than 8 years old is taken from the parent diary information,4 and for children aged 10 or older the information is obtained by comparing the locations reported in parents’ and children’s diaries. For children aged 8 or 9 years old the two surveys do not provide the same measures; UKTUS 2000 only gives the indicator in parents’ diaries and UKTUS 2014 only the locations reported in parents’ and children’s diaries. To ensure comparability of the analyses, fathers with children aged 8 or 9 years old are excluded from the analyses of fathers’ time with children. The information is used to calculate father’s time alone with a child and time with a child and mother. Co-presence with the mother is calculated from both parents’ reported locations.
3.3 Analysis plan
The paper first presents the gross trends in father involvement; that is, the participation rates and the times that active fathers spent providing childcare of various types in each survey, as well as gross trends for different SES groups. The term ‘active fathers’ refers to fathers who reported positive amounts of time in the respective childcare activity. I use the term ‘father involvement’ as an umbrella term for fathers’ childcare activities and their time with children. The second part of the analysis estimates multivariate models to establish trends and social differences net of child composition and other circumstances of the fathers.
Analyses of the minutes of childcare time typically draw on linear regression models. This paper applies a different strategy. It separately analyses fathers’ participation in childcare activities and the minutes of childcare provided by the active fathers, that is, the fathers who reported positive amounts of time in the respective childcare activity. Thus, it is possible to distinguish between factors associated with fathers not being involved at all and factors associated with the childcare time of involved fathers.
4 To achieve consistency with UKTUS 2014, co-presence is not considered at times when the parent is at
One reason for choosing this two-step approach is that it enables us to observe any polarisation of father involvement over time. For example, in the later survey year fewer fathers might be involved, but those who are involved might be involved in childcare for longer durations. Such a trend might not be detected in an analysis of the average minutes of all fathers. If a ‘polarisation’ only occurred because low-involved fathers moved between not caring and caring for short durations, the distinction between non-involved and low-involved fathers might not matter. However, the UKTUS data actually suggests changes both at the low and the high end of care durations.
The two-step approach can also address the issue that fathers who did not report any childcare engagement might represent a special group. Interestingly, the vast majority of the about 30% of fathers who were not engaged with their children on a diary day still spent time with their (partner and) children – on average, three hours on weekdays and even longer on weekend days. Only about 7% of fathers reported no involvement at all on weekdays, and even fewer, no involvement on weekend days. That fathers did not engage with their children despite being together with them suggests that these fathers might not subscribe to the new ideal of involved fatherhood. Whereas these fathers might need encouragement to become engaged at all, the active fathers might need support for extending the time that they allocate to fathering.
The multivariate models include interaction terms between father’s SES and survey year to test for trends and possible widening gaps in father involvement between SES groups. The literature provides arguments for measuring SES both by class and by education. Since including both measures simultaneously blurs the results, the analysis focuses on findings from models for social class. In addition, the main findings for education are included in the Appendix. This strategy was chosen for two reasons.
First, class and education are related factors, but their influence on father involvement with children entails different implications for the understanding of the underlying processes that potentially motivate father involvement with children. Explanations of the education effect are strongly tied to individualised perspectives of human behaviour, emphasising personal attitudes to gender equality and parenting practices. Occupation, however, is more directly associated with social class and thus foregrounds explanations premised on the likely impact of class-based cultures of child-rearing grounded in the social, material, and cultural conditions of life in different social-economic groups.
Second, despite their similarities, the two analyses might not show the same trends of SES differences over time. The distribution of father’s level of education changed considerably between surveys, but not the distribution of father’s class.5 It could be
5 The distributions of both variables in UKTUS correspond well to the respective distributions in the UK
argued that if high education is the main driver of increasing father involvement, father involvement should have strongly increased between the survey years, whereas if father’s class is the main driver it should have remained more stable. Perhaps this argument is built on a too narrow interpretation of the effect of education, but any failure to diagnose a strong increase in father involvement suggests that it is not the intellectual experience of having a high level of education alone that matters for increasing father involvement.
Table 1: Descriptive statistics: individual, family, and child characteristics
2000 2014
N unweighted % unweighted % weighted N unweighted % unweighted % weighted
Total 1,012 100 100 674 100 100
Weekday 966 635
Weekend day 925 638
Manager/professional*
Yes 405 40.0 40.9 277 41.1 41.8
No 542 53.6 51.7 390 57.9 57.0
Missing 65 6.4 7.4 7 1.0 1.2
Highest qualification*
Degree or higher 167 16.5 17.5 201 29.8 29.7
Higher education 97 9.6 9.7 112 16.6 17.8
A-level of equivalent 156 14.3 14.1 118 17.5 16.9
Secondary/None 563 55.6 54.0 224 33.2 32.8
Missing 40 4.0 4.6 19 2.8 2.9
Household employment*
Male breadwinner 234 23.1 24.3 190 28.2 28.8
1.5 earner 391 38.6 38.1 229 34.0 34.0
Dual FT earner 230 22.7 21.5 205 30.4 30.5
Father not in paid work 85 8.4 8.4 47 7.0 6.5
Missing 72 7.1 7.8 3 0.5 0.2
Number of children
One child 440 43.5 38.8 271 40.2 41.5
Two children 403 39.8 44.0 310 46.0 44.1
Three or more children 169 16.7 17.2 93 13.8 14.4
Age of youngest child*
0–1 years 206 20.3 22.3 175 25.9 24.4
2–3 years 159 15.7 17.0 127 18.8 18.7
4–7 years 237 23.4 23.9 162 24.0 25.8
8–9 years 124 12.2 11.6 54 8.0 9.2
10–14 years 286 28.3 25.2 156 23.2 21.8
Flexible working
arrangements: Yes* 80 7.9 8.5 152 22.6 22.3 Working long hours: Yes* 301 29.7 30.2 141 20.9 20.6
Mean Mean (weighted) Std. Dev. Mean Mean (weighted) Std. Dev.
Fathers age (years)* 38.7 38.6 0.23 39.9 39.8 0.30
Source: UKTUS 2000, 2014
3.4 Explanatory and control variables
The multivariate regression models control for child composition in terms of the number of children and the age of the youngest child. To measure father’s occupational class, I create a dichotomous variable indicating whether or not the father holds a professional or managerial occupation.6 Father’s highest level of education is measured by an indicator for the father having a tertiary degree. Father’s age had no significant effect in any model and was dropped from the analyses.
The models also control for different couple employment configurations with a categorical variable identifying male-breadwinner families (reference group), 1.5 earner families, dual-full-time earner families, and families where the father is not in paid employment. Finally, I use two dummy variables to indicate, respectively, long working hours of 50 hours or more per week and flexible working arrangements in father’s main job. An indicator for whether the father worked on the diary day did not change any effects of interest and was dropped from the models (Hook 2012). Multiple imputation is used to deal with a limited number of missing values for father’s class, education, and the couple employment configuration.
Table 1 gives descriptive statistics relating to individual, household, and child characteristics. About 42%–43% of fathers with valid information about their occupation were professionals or managers. Fathers in 2014 were considerably better educated than those in 2000; the proportion of fathers with a degree increased from 18% in 2000 to 30% in 2014 and the proportion of fathers with higher secondary educational qualifications but no tertiary degree increased from a quarter to 34%. The 1.5-earner model (father full-time or part-time, mother part-time) was the most common employment configuration in both years but declined by about 4% over time, whereas the proportion of dual full-time earner couples increased. In the UKTUS sample the proportion of male-breadwinner couples increased by several percentage points, which differs from statistics based on the Labour Force Survey, where the proportion remained largely stable.7 A smaller proportion of fathers were not in paid work in 2014 compared to 2000. There was no significant difference in fathers’ number of children in the two surveys. Fathers in the 2014 survey were more likely than fathers in the 2000 survey to have a very young child and less likely to have a youngest child aged 10 to 14 years old. In 2014 it was more common for fathers to report that they had flexible working arrangements. A smaller proportion of them reported working 50
6 These occupations are identified by the National Statistics Socio-Economic Classification (NS-SEC) codes
1 and 2.
7 I derived alternative post-estimation weights to test whether the findings were sensitive to the
hours per week or more in 2014 compared to 2000. Finally, fathers were on average about one year older in 2014 compared to 2000.
4. Results
4.1 Changes in father involvement
4.1.1 Changes by type of childcare activity
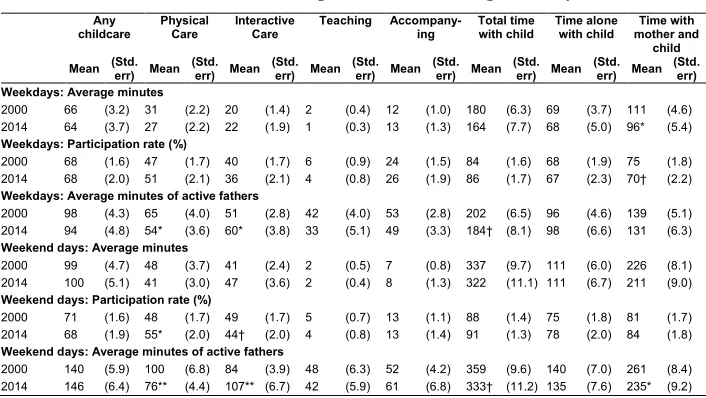
Table 2 reports the average number of minutes on weekdays and weekend days that fathers spent in different childcare activities, recorded either as primary or secondary/other activity.8 In addition, it shows the proportion of fathers who reported a positive amount of time in a childcare activity, referred to as the participation rate, and the average minutes of care provided by these active fathers.
Table 2: Average minutes and participation rates in different childcare activities: fathers in couples with children aged 0–14 years
Any
childcare PhysicalCare InteractiveCare Teaching Accompany-ing Total timewith child Time alonewith child mother andTime with child Mean (Std.err) Mean (Std.err) Mean (Std.err) Mean (Std.err) Mean (Std.err) Mean (Std.err) Mean (Std.err) Mean (Std.err)
Weekdays: Average minutes
2000 66 (3.2) 31 (2.2) 20 (1.4) 2 (0.4) 12 (1.0) 180 (6.3) 69 (3.7) 111 (4.6) 2014 64 (3.7) 27 (2.2) 22 (1.9) 1 (0.3) 13 (1.3) 164 (7.7) 68 (5.0) 96* (5.4)
Weekdays: Participation rate (%)
2000 68 (1.6) 47 (1.7) 40 (1.7) 6 (0.9) 24 (1.5) 84 (1.6) 68 (1.9) 75 (1.8) 2014 68 (2.0) 51 (2.1) 36 (2.1) 4 (0.8) 26 (1.9) 86 (1.7) 67 (2.3) 70† (2.2)
Weekdays: Average minutes of active fathers
2000 98 (4.3) 65 (4.0) 51 (2.8) 42 (4.0) 53 (2.8) 202 (6.5) 96 (4.6) 139 (5.1) 2014 94 (4.8) 54* (3.6) 60* (3.8) 33 (5.1) 49 (3.3) 184† (8.1) 98 (6.6) 131 (6.3)
Weekend days: Average minutes
2000 99 (4.7) 48 (3.7) 41 (2.4) 2 (0.5) 7 (0.8) 337 (9.7) 111 (6.0) 226 (8.1) 2014 100 (5.1) 41 (3.0) 47 (3.6) 2 (0.4) 8 (1.3) 322 (11.1) 111 (6.7) 211 (9.0)
Weekend days: Participation rate (%)
2000 71 (1.6) 48 (1.7) 49 (1.7) 5 (0.7) 13 (1.1) 88 (1.4) 75 (1.8) 81 (1.7) 2014 68 (1.9) 55* (2.0) 44† (2.0) 4 (0.8) 13 (1.4) 91 (1.3) 78 (2.0) 84 (1.8)
Weekend days: Average minutes of active fathers
2000 140 (5.9) 100 (6.8) 84 (3.9) 48 (6.3) 52 (4.2) 359 (9.6) 140 (7.0) 261 (8.4) 2014 146 (6.4) 76** (4.4) 107** (6.7) 42 (5.9) 61 (6.8) 333† (11.2) 135 (7.6) 235* (9.2)
Note: Sample sizes: ‘Active’ fathers are fathers who participate in the respective activity. ‘Any childcare’ includes 55 cases that report ‘unspecified caring.’ The statistics for the ‘Times with’ variables are calculated for fathers who do not have an 8- or 9-year-old child. Weighted data. ‘**’ 2014 estimate is significantly different from 2000 estimate, p<0.01; ‘*’ p<0.05; ‘†’ p<0.10
8 If a father reported two childcare activities for a time slot, one as a primary activity and one as a secondary
The first data column of Table 2 reports fathers’ minutes and participation rates in any childcare activity by year and day of the week. On weekdays in 2000, fathers spent about 66 minutes doing childcare – 68% of fathers participated and each of these active fathers provided about 98 minutes of childcare. In 2000, fathers cared for their children for 99 minutes on weekend days on average, about half an hour longer than on weekdays. The proportion of fathers who were involved in childcare is slightly higher on weekends than on weekdays. Fathers who were involved on weekend days spent 140 minutes doing childcare on average. There was no significant difference in any of these numbers between the two survey years.
The next columns in Table 2 provide an overview of fathers’ involvement in different types of childcare. The two dominant categories are physical care (feeding, bathing, watching children) and interactive care, which together account for about three-quarters of fathers’ childcare time on weekdays and nearly nine-tenths of his childcare time on weekend days. On average, fathers spent 12 or 13 minutes accompanying a child on weekdays, reduced to 7 or 8 minutes on weekend days. Only every 20th father reported teaching a child, reflecting that some fathers have no school-age children and that some fathers reported on their involvement during school holidays. On weekend days fathers spent an additional 30 minutes on physical and interactive childcare, but time spent accompanying children was lower than on weekdays.
Despite the overwhelming stability of fathers’ total childcare time between the two surveys, there are several changes at the level of particular childcare activities. On weekdays there is a decrease in minutes of physical care (from 65 to 54) among fathers who provided such care, and an increase in minutes of interactive care (from 51 to 60) among fathers who provided interactive care. A higher percentage of fathers were involved in providing physical care on weekend days in 2014 than in 2000, but the minutes of physical care provided by involved fathers dropped significantly. The participation rate in interactive care decreased slightly, but the minutes of interactive care provided by involved fathers increased strongly between the two years.
4.1.2 Changes in fathers’ time with children
On average, fathers spent 69 minutes with a child on a weekday without the mother being present and without doing childcare, a duration that increased to 111 minutes on weekend days. Only about two-thirds of fathers spent any time alone with their children on weekdays, a proportion that increased to three-quarters on weekend days. There was no significant change between the survey years in father’s time alone with a child.
Fathers spent much more time together with the mother and a child – on average 111 minutes on weekdays and 226 minutes on weekend days in 2000. In 2014 the average father enjoyed less of this ‘family time’ on weekdays than in 2000. Fathers who spent time with their partner and children on weekend days reported nearly half an hour less of this time than the corresponding fathers in 2000. Despite these changes, the total time that fathers spent with their children (net of childcare activities) did not significantly change between the two survey years at standard levels of significance.
To conclude, the overall level of father involvement – whether measured by average minutes of childcare per father, childcare participation rate, minutes of care provided by active fathers, total time that fathers were available for their children, or time that they were the only available parent – was surprisingly stable between the two survey years. Looking at particular childcare activities, more fathers were involved in physical care, but the active fathers provided fewer minutes on average. Slightly fewer fathers were involved in interactive care but the active fathers provided interactive care for longer durations. The data also shows a decrease in family time, confirming the finding by Henz (2017), which was based on more subjective measures of co-presence.
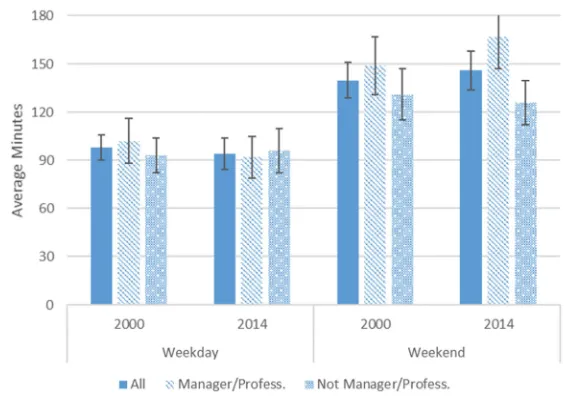
4.1.3 Gross differences by SES
Figure 1: Fathers’ childcare involvement by survey year, type of day, and occupational class: average minutes (panel a), participation rates (panel b) and minutes provided by active fathers (panel c)
a) Average minutes
Figure 1: (Continued)
c) Average minutes provided by active fathers
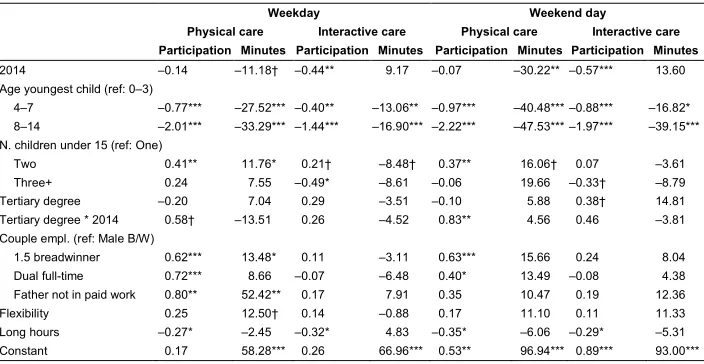
Figure A-1 gives the corresponding figures for fathers with and without a tertiary degree. The trends are very similar to those for class, although fewer differences in the year 2000 are statistically significant, partly because a smaller number of fathers held a tertiary degree in 2000. The corresponding analyses (not shown) of class differences in fathers’ total time with children (net of childcare activities) did not show any significant class differences.
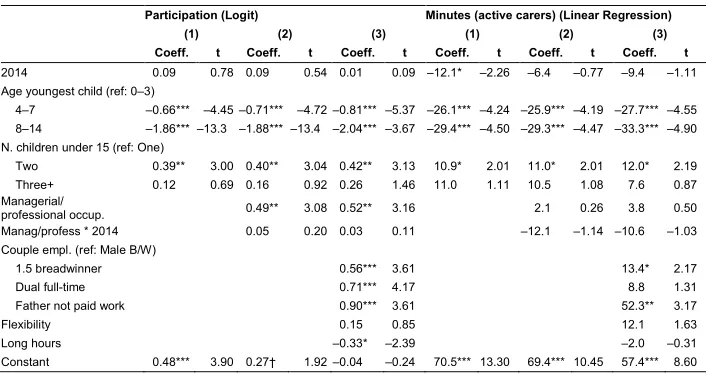
4.2 Multivariate analyses
Tables 3 to 6 give the results from logit models for participation in childcare and linear regression models for the minutes of active fathers’ involvement. Separate models are presented for physical care and interactive care/teaching on weekdays and weekend days. The tables show three models for each situation: the first model only controls for the survey year, the number of children, and the age of the youngest child; the second model adds father’s class and an interaction effect between class and survey year; and the third model adds the couple employment configuration and other selected aspects of father’s job. The first models roughly reproduce the gross differences in physical care that showed up in the gross statistics in Table 2. The patterns related to interactive care change somewhat because in the multivariate models interactive care has been combined with teaching. This leads to a decrease in fathers’ participation in interactive care/teaching both on weekdays and weekend days and a more modest increase in the minutes of active fathers on weekend days. Linear regression models (not shown) of the time that fathers spent alone with a child or together with the mother and a child do not show any significant differences between survey years or by social class on weekdays or weekend days.
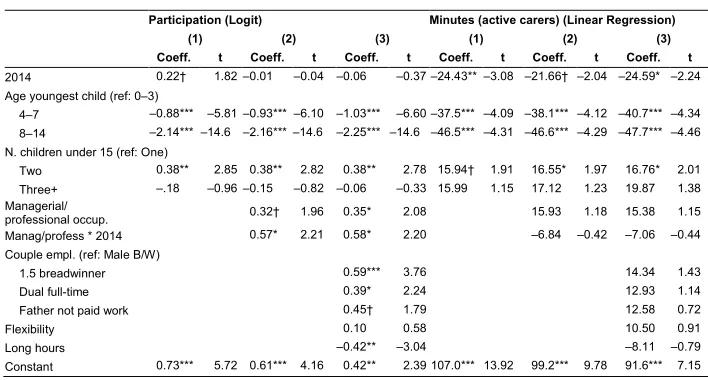
The second and third models examine the effects of class and their change over time. The key estimates from the full models for participation and minutes of care are combined in Figure 2.9 In these graphs the horizontal line gives the participation rates and the vertical line the average minutes provided by active fathers. The dark lines refer to fathers in managerial or professional occupations and the grey lines to all other fathers. The solid lines refer to the year 2000 and the dashed lines to 2014. Panel (a) presents the estimated effects for physical care on weekdays. There is a gap in the participation rates between high-status fathers and other fathers, but similar average minutes of care in the two groups. In 2014 both groups provided fewer minutes of care, but these differences are not statistically significant. Panel (b) shows the corresponding figures for interactive care/teaching on weekdays. Again, there is a gap in the participation rate between high-status fathers and other fathers, and in both groups the rates dropped by about 6% or 7% in 2014. There were no differences in the minutes of care provided by the active fathers. The lower two panels of Figure 2 illustrate the effects of survey year and class on weekend days. For physical care (panel c) the participation rates of low-status fathers remained stable. Those of high-status fathers were higher in the year 2000 and further increased in 2014. For both groups the minutes of care provided by active fathers decreased by about 25 minutes. Regarding interactive
9 The estimated effects on participation rates are taken from linear regression models for participation rates
care on weekend days (panel d), high-status fathers had higher participation rates than other fathers but both groups provided about the same minutes of care in 2000. Whereas the participation rates declined for both groups, the active high-status fathers increased their minutes of care in 2014, though the effect is only significant at the 10% level. The minutes of interactive care by low-status fathers remained unchanged.
The main changes over time can be condensed into two main observations. First, the involvement of low-status fathers was stable or decreased: their participation in interactive care decreased on all days and the minutes of physical care on weekend days. Second, these negative changes also apply to high-status fathers, but these also reported some increases, for example, in the minutes of interactive care and especially in the participation in physical care on weekend days. In terms of the gap between SES groups, it increased with regard to participating in physical care on weekend days and in the minutes of interactive care on weekend days (weakly significant).
Table 3: Multivariate analyses of physical care on weekdays
Participation (Logit) Minutes (active carers) (Linear Regression)
(1) (2) (3) (1) (2) (3)
Coeff. t Coeff. t Coeff. t Coeff. t Coeff. t Coeff. t
2014 0.09 0.78 0.09 0.54 0.01 0.09 –12.1* –2.26 –6.4 –0.77 –9.4 –1.11 Age youngest child (ref: 0–3)
4–7 –0.66*** –4.45 –0.71*** –4.72 –0.81*** –5.37 –26.1*** –4.24 –25.9*** –4.19 –27.7*** –4.55 8–14 –1.86*** –13.3 –1.88*** –13.4 –2.04*** –3.67 –29.4*** –4.50 –29.3*** –4.47 –33.3*** –4.90 N. children under 15 (ref: One)
Two 0.39** 3.00 0.40** 3.04 0.42** 3.13 10.9* 2.01 11.0* 2.01 12.0* 2.19 Three+ 0.12 0.69 0.16 0.92 0.26 1.46 11.0 1.11 10.5 1.08 7.6 0.87 Managerial/
professional occup. 0.49** 3.08 0.52** 3.16 2.1 0.26 3.8 0.50 Manag/profess * 2014 0.05 0.20 0.03 0.11 –12.1 –1.14 –10.6 –1.03 Couple empl. (ref: Male B/W)
1.5 breadwinner 0.56*** 3.61 13.4* 2.17
Dual full-time 0.71*** 4.17 8.8 1.31
Father not paid work 0.90*** 3.61 52.3** 3.17
Flexibility 0.15 0.85 12.1 1.63
Long hours –0.33* –2.39 –2.0 –0.31
Constant 0.48*** 3.90 0.27† 1.92 –0.04 –0.24 70.5*** 13.30 69.4*** 10.45 57.4*** 8.60
Table 4: Multivariate analyses of interactive care or teaching on weekdays
Participation (Logit) Minutes (active carers) (Linear Regression)
(1) (2) (3) (1) (2) (3)
Coeff. t Coeff. t Coeff. t Coeff. t Coeff. t Coeff. t
2014 –0.28* –2.31 –0.30† –1.89 –0.34* –2.08 5.60 1.25 6.97 1.18 7.79 1.29 Age youngest child (ref: 0–3)
4–7 –0.39** –2.66 –0.41** –2.80 –0.41** –2.78 –13.72** –2.78 –13.87** –2.79 –13.29** –2.65 8–14 –1.46*** –10.3 –1.46*** –10.3 –1.44*** –9.95 –17.3*** –3.79 –17.3*** –3.77 –17.3*** –3.72 N. children under 15 (ref: One)
Two 0.23† 1.80 0.23† 1.81 0.22† 1.69 –8.29† –1.67 –8.21 –1.64 –8.29 –1.62 Three+ –0.50* –2.59 –0.48* –2.48 –0.50* –2.50 –6.89 –1.09 –6.78 –1.06 –8.05 –1.24 Managerial/
professional occup. 0.23 1.50 0.27† 1.70 2.67 0.48 3.26 0.58 Manag/profess * 2014 0.07 0.30 0.05 0.20 –2.89 –0.32 –1.68 –0.18 Couple empl. (ref: Male B/W)
1.5 breadwinner 0.07 0.50 –3.35 –0.62
Dual full-time –0.09 –0.52 –6.69 –1.14
Father not paid work 0.20 0.86 9.03 1.01
Flexibility 0.15 0.85 –2.29 –0.43
Long hours –0.34* –2.45 4.42 0.78
Constant 0.27* 2.16 0.16 1.18 0.22 1.30 65.6*** 11.81 64.3*** 9.93 65.0*** 7.83
Note:+p < 0.10,*p < 0.05,**p < 0.01,***p < 0.001.
Table 5: Multivariate analyses of physical care on weekend days
Participation (Logit) Minutes (active carers) (Linear Regression)
(1) (2) (3) (1) (2) (3)
Coeff. t Coeff. t Coeff. t Coeff. t Coeff. t Coeff. t
2014 0.22† 1.82 –0.01 –0.04 –0.06 –0.37 –24.43** –3.08 –21.66† –2.04 –24.59* –2.24 Age youngest child (ref: 0–3)
4–7 –0.88*** –5.81 –0.93*** –6.10 –1.03*** –6.60 –37.5*** –4.09 –38.1*** –4.12 –40.7*** –4.34 8–14 –2.14*** –14.6 –2.16*** –14.6 –2.25*** –14.6 –46.5*** –4.31 –46.6*** –4.29 –47.7*** –4.46 N. children under 15 (ref: One)
Two 0.38** 2.85 0.38** 2.82 0.38** 2.78 15.94† 1.91 16.55* 1.97 16.76* 2.01 Three+ –.18 –0.96 –0.15 –0.82 –0.06 –0.33 15.99 1.15 17.12 1.23 19.87 1.38 Managerial/
professional occup. 0.32† 1.96 0.35* 2.08 15.93 1.18 15.38 1.15 Manag/profess * 2014 0.57* 2.21 0.58* 2.20 –6.84 –0.42 –7.06 –0.44 Couple empl. (ref: Male B/W)
1.5 breadwinner 0.59*** 3.76 14.34 1.43
Dual full-time 0.39* 2.24 12.93 1.14
Father not paid work 0.45† 1.79 12.58 0.72
Flexibility 0.10 0.58 10.50 0.91
Long hours –0.42** –3.04 –8.11 –0.79
Constant 0.73*** 5.72 0.61*** 4.16 0.42** 2.39 107.0*** 13.92 99.2*** 9.78 91.6*** 7.15
Table 6: Multivariate analyses of interactive care or teaching on weekend days
Participation (Logit) Minutes (active carers) (Linear Regression)
(1) (2) (3) (1) (2) (3)
Coeff. t Coeff. t Coeff. t Coeff. t Coeff. t Coeff. t
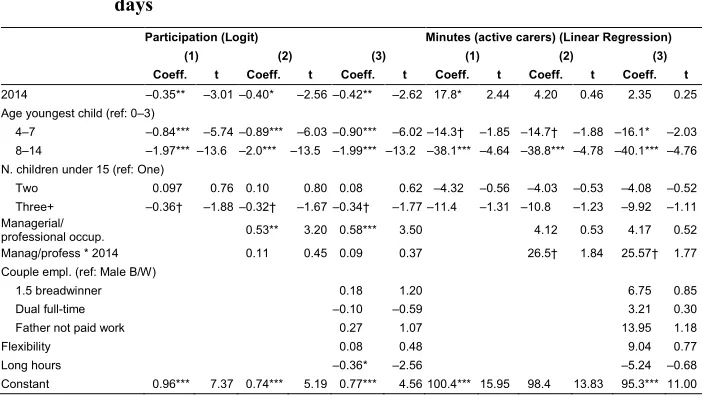
2014 –0.35** –3.01 –0.40* –2.56 –0.42** –2.62 17.8* 2.44 4.20 0.46 2.35 0.25 Age youngest child (ref: 0–3)
4–7 –0.84*** –5.74 –0.89*** –6.03 –0.90*** –6.02 –14.3† –1.85 –14.7† –1.88 –16.1* –2.03 8–14 –1.97*** –13.6 –2.0*** –13.5 –1.99*** –13.2 –38.1*** –4.64 –38.8*** –4.78 –40.1*** –4.76 N. children under 15 (ref: One)
Two 0.097 0.76 0.10 0.80 0.08 0.62 –4.32 –0.56 –4.03 –0.53 –4.08 –0.52 Three+ –0.36† –1.88 –0.32† –1.67 –0.34† –1.77 –11.4 –1.31 –10.8 –1.23 –9.92 –1.11 Managerial/
professional occup. 0.53** 3.20 0.58*** 3.50 4.12 0.53 4.17 0.52 Manag/profess * 2014 0.11 0.45 0.09 0.37 26.5† 1.84 25.57† 1.77 Couple empl. (ref: Male B/W)
1.5 breadwinner 0.18 1.20 6.75 0.85
Dual full-time –0.10 –0.59 3.21 0.30
Father not paid work 0.27 1.07 13.95 1.18
Flexibility 0.08 0.48 9.04 0.77
Long hours –0.36* –2.56 –5.24 –0.68
Constant 0.96*** 7.37 0.74*** 5.19 0.77*** 4.56 100.4*** 15.95 98.4 13.83 95.3*** 11.00
Note:+p < 0.10,*p < 0.05,**p < 0.01,***p < 0.001.
The control variables show some expected patterns as well as some interesting differences between involvement in physical and interactive care. All forms of father involvement decreased with the age of the youngest child. Fathers of two children tended to be more engaged in physical care than fathers with only one child, and fathers of three children were less likely to be involved in interactive care than fathers with only one child. The couple employment pattern matters mainly for participation in physical care on weekdays and weekend days, and, less strongly, for minutes of physical care on weekdays. Notably, the couple employment pattern affects neither fathers’ participation in nor their minutes of interactive care. Finally, long working hours tended to reduce fathers’ participation rates in childcare but not so much the minutes of active carers, highlighting the value of applying a two-step modelling approach.
fathers on weekend days in 2014 is not reproduced. This could either result from genuine differences between the two SES measures or caution against relying on weakly significant findings.
Figure 2: Estimated effects of class and survey year on father involvement (participation rates and minutes by active fathers)
(a) Involvement in physical care on weekdays (b) Involvement in interactive care/ teaching on weekdays
(c) Involvement in physical care on weekend days (d) Involvement in interactive care /teaching on weekend days
5. Discussion
This paper presents an analysis of fathers’ involvement with their children in the United Kingdom, focusing on change over time and differences between SES groups. Only fathers in intact families are included in the analysis; i.e., fathers living together with a partner. A large body of research has shown a strong increase in father involvement during the last decades of the 20th century, in the United Kingdom and elsewhere. The findings of this study suggest that the increase of father involvement has come to a halt in the United Kingdom. The average father’s time in childcare – on weekdays and on weekend days – was roughly the same in 2014 as in 2000. In the same vein, there was no statistically significant change in the time that fathers spent with their children net of childcare.
The finding of overall stability of father involvement contradicts the earlier findings of Altintaş (2016) and Henz (2017). A closer inspection of the analyses reveals that the main reason for the discrepancy is the different measurement of childcare activities.10 Both Altintaş and Henz only analyse childcare reported as a primary activity, whereas this paper counts as childcare all instances where a father reported childcare as a primary or secondary/other activity. Fathers in UKTUS 2014 reported more childcare as a primary activity and less childcare as a secondary/other activity than fathers in UKTUS 2000. For example, on average fathers in UKTUS 2000 reported 58 minutes of weekend childcare as a primary activity and another 41 minutes of childcare as a secondary activity. In UKTUS 2014, childcare as primary activity significantly increased to 76 minutes on weekend days, whereas the additional time in childcare as a secondary activity significantly decreased to 24 minutes, leading to a stable level of the combined measure of around 99 minutes in both years.
It is not possible to fully ascertain the reasons for the increased reporting of childcare as a primary activity and the reduced reporting of childcare as a secondary activity in the UKTUS 2014. One possible way of thinking about the change is to take it as a sign of the higher subjective importance of childcare for fathers in 2014 than for those in 2000, which in turn might reflect increased societal expectations about father involvement. Other possible explanations are that fathers prioritized childcare activities in 2014 compared to 2000 when these competed with other activities, or that some aspects of the data collection encouraged different reporting in the two survey years.11
Scholars have debated whether and how secondary activities should be treated in time-use research (Budig and Folbre 2004; Ironmonger 2004). On the one hand,
10 Differences in the samples of fathers also contribute to the disparities.
11 The instructions in the diaries for reporting secondary/other activities in UKTUS 2000 were “What else
arguments against taking secondary activities into account refer to the problem of how to calculate the durations during which people are involved in multiple activities, and to possible issues of comparability between surveys. On the other hand, researchers agree that ignoring secondary activities underestimates total childcare time (Bianchi 2000; Budig and Folbre 2004; Craig 2006b; Giminez-Nadal and Sevilla 2012) and ignores that “child care is often multitasked or involves passively being ‘on call’” (Hook 2006: 647).12 Because of the close similarity of both surveys, I include secondary activities in the measures of fathers’ childcare. Treating secondary activities in the same way as primary activities reduces the risk of underestimating the total amount of time that fathers are involved with their children. Assigning them the same number of minutes as primary childcare activities is particularly appropriate for supervisory activities, which will last for the full duration of the time slot even if other activities are carried out in parallel. However, the chosen strategy could overestimate fathers’ childcare time, especially in UKTUS 2000. If the time in secondary activities needs to be discounted by some fraction, one would actually conclude that fathers’ childcare time increased between the survey years.
The study examines different types of father involvement. Despite the stability of fathers’ time with their children at the aggregate level, the data shows a decrease in the time that fathers spent together with their partner and children. This decrease not only indicates a decrease in this form of father involvement but also endorses concerns about a weakening cohesion of today’s families.
The multivariate analyses of different childcare activities depict three broad trends: a weaker involvement of fathers with lower-status occupations, a move towards fathers with a higher SES ‘specializing’ in interactive care and ‘spreading’ physical care on weekend days, and a continuing divergence between high-SES fathers and other fathers. The stronger involvement of high-SES fathers compared to other fathers supports concerns about the inequality of resources available to children from different SES groups. These SES differences widened between 2000 and 2014 in terms of participation in physical childcare on weekend days. Since there is only weak evidence for a widening SES gap in interactive care, the analyses only partially support concerns about a divergence of opportunities for children from different SES backgrounds.
The models offer no explanations for the lower and decreasing involvement of fathers from lower SES groups. The differences persist after controlling for fathers’ work flexibility and working hours. Fathers’ long working hours reduced fathers’ childcare participation rates, highlighting the importance of structural constraints for father involvement in childcare. Future research should examine whether changes in the
12 Ignoring secondary activities also assumes a hierarchy in the importance of activities, which might not
labour market after the Great Recession have imposed particular time pressures on fathers with lower SES, reducing these fathers’ scope for engagement.
For high-status fathers the findings are mixed and only partially support the dominant narratives. The decreased participation rate in interactive care runs counter to narratives of involved fatherhood among middle-class fathers who try to develop their children’s skills (Lareau 2012), or perceptions of fathers’ childcare as an ‘investment’ in the human capital of the child. It would be interesting to further tease out the characteristics of the most involved fathers, but the size of the sample does not permit a further disaggregation of social class.
The findings are also ambivalent regarding the idea that gender equality is associated with higher father involvement. The widening of the population of high-SES fathers who provide physical care on weekends could indicate increasing gender equality in these couples because physical care is more strongly associated with mothering than interactive care. However, the reduction of the minutes of physical care provided by active fathers on weekend days in 2014 compared to 2000 should then be taken as evidence against increased gender equality in this group. Furthermore, these analyses do not fully capture the relationship between father involvement and the division of childcare in couples. A proper assessment requires a close examination of both the father’s and the mother’s time spent on childcare.
The study’s main findings were not affected by the chosen measure for SES. The stability of father involvement questions the importance of intrinsic aspects of education as the main driver of father involvement. Since fathers were much better educated in 2014 than in 2000, father involvement should have increased in 2014. Instead, the findings suggest that class and education are both associated with a complex set of circumstances that affect fatherhood ideals or fathers’ abilities to realise their aspirations of involved fatherhood.
Finally, the findings do not lend any support to the hypothesized positive effects of recent policy changes. It would be premature to conclude that the policy changes were without effect because such effects might have been cancelled out by parallel changes in other domains. However, the study suggests that policies that encourage father involvement need to be strengthened if discernible changes in fathers’ behaviour are to be achieved.
6. Conclusion
transformation of the father role and of progress towards gender equality in the home in large parts of the population.
More detailed analyses reveal some heterogeneity in fathers’ involvement with children. They identify mostly negative trends among low-status fathers. Identifying potential barriers to their involvement should be a pressing issue for future research. For high-status fathers a more mixed picture emerges. Some of these fathers increased time spent in physical care on weekend days, which could indicate a step towards increased gender inequality. However, to fully analyse the implications of the findings for gender equality, mothers’ childcare involvement would have to be included in the analysis.
The research confirms earlier findings that fathers from higher SES groups are more involved with their children than other fathers. The analysis found some evidence of further divergence between fathers from different SES groups on weekend days, but only for physical childcare. Thereby, the analyses only partly support narratives of a further divergence of opportunities of children from different SES backgrounds, but it confirms continuing social inequalities in the resources that are available to children.
7. Acknowledgements
The research received funding from the European Union’s Seventh Framework Programme (FP7/2007–2013) under grant agreement no. 320116 for the research project FamiliesAndSocieties. The data were obtained through the UK Data Service where they were deposited by Ipsos-RSL and the UK Office for National Statistics (United Kingdom Time Use Survey 2000; https://beta.ukdataservice.ac.uk/ datacatalogue/doi/?id=4504) and Jonathan Gershuny and Oriel Sullivan (2014–2015;
References
Altintaş, E. (2016). Are British parents investing less time in their children? Oxford: Nuffield College (Centre for Social Investigation Briefing Note 27).
Baxter, J. (2011). Flexible work hours and other job factors in parental time with children.Social Indicators Research 101(2): 239–242. doi:10.1007/s11205-010-9641-4.
Bianchi, S.M. (2000). Maternal employment and time with children: Dramatic change or surprising continuity? Demography 37(4): 401–414. doi:10.1353/dem.2000. 0001.
Brannen, J. and Nilsen, A. (2006). From fatherhood to fathering: Transmission and change among British fathers in four-generation families.Sociology 40(2): 335– 352.doi:10.1177/0038038506062036.
Braun, A., Vincent, C., and Ball, S.J. (2011). Working-class fathers and childcare: The economic and family contexts of fathering in the UK. Community, Work and Family 14(1): 19–37.doi:10.1080/13668803.2010.506028.
Budig, M.J. and Folbre, N. (2004). Measuring parental childcare time. In: Bittman, M. and Folbre, N. (eds.). Family time: The social organization of care. London: Routledge: 51–68.
Bulanda, R.E. (2004). Paternal involvement with children: The influence of gender ideologies. Journal of Marriage and Family 66(1): 40–45. doi:10.1111/j.0022-2455.2004.00003.x.
Connolly, S., Aldrich, M., O’Brien, M., Speight, S., and Poole, E. (2016). Britain’s slow movement to a gender egalitarian equilibrium: Parents and employment in the UK 2001–12. Work, Employment and Society 30(5): 838–857.doi:10.1177/ 0950017016638009.
Coulter, S. (2016). The UK labour market and the ‘great recession’. In: Myant, M., Theodoropoulou, S., and Piasna, A. (eds.).Unemployment, internal devaluation and labour market deregulation in Europe. Brussels: European Trade Union Institute: 197–227.
Craig, L. (2006a). Parental education, time in paid work and time with children: An Australian time-diary analysis. British Journal of Sociology 57(4): 553–575.
Craig, L. (2006b). Does father care mean fathers share? A comparison of how mothers and fathers in intact families spend time with children. Gender and Society 20(2): 259–281.doi:10.1177/0891243205285212.
Craig, L. (2007). Contemporary motherhood: The impact of children on adult time. Aldershot: Ashgate Publishing.
Craig, L. and Mullan, K. (2011). How mothers and father share childcare: A cross-national time-use comparison. American Sociological Review 76(6): 834–861.
doi:10.1177/0003122411427673.
Crompton, R. (2006). Employment and the family: The reconfiguration of work and family in contemporary societies. Cambridge: Cambridge University Press.
doi:10.1017/CBO9780511488962.
Dermott, E. (2008).Intimate fatherhood: A sociological analysis. London: Routledge. Dex, S. and Ward, K. (2007). Parental care and employment in early childhood.
London: Equal Opportunities Commission (Equal Opportunities Working Paper No. 57).
Ferri, E. and Smith, K. (2003). Family life. In: Ferri, E., Bynner, J., and Wadsworth, M. (eds.).Changing Britain, changing lives: Three generations at the turn of the century. London: Institute of Education: 133–147.
Fisher, K., McCulloch, A., and Gershuny, J. (1999). British fathers and children: A report for Channel 4 ‘Dispatches’. Colchester: University of Essex, Institute for Social and Economic Research.
Gauthier, A.H., Smeeding, T.M., and Furstenberg Jr., F.F. (2004). Are parents investing less time in children? Trends in selected industrialized countries.Population and Development Review 30(4): 647–671.doi:10.1111/j.1728-4457.2004.00036.x. Gershuny, J. (2000). Changing times: Work and leisure in postindustrial society.
Oxford: Oxford University Press.
Gershuny, J. and Sullivan, O. (2017). United Kingdom Time Use Survey, 2014–2015 [data collection]. Colchester: UK Data Service.https://beta.ukdataservice.ac.uk/ datacatalogue/doi/?id=8128.
Gracia, P. and Esping-Andersen, G. (2015). Fathers’ child care time and mothers’ paid work: A cross-national study of Denmark, Spain, and the United Kingdom. Family Science 6(1): 270–281.doi:10.1080/19424620.2015.1082336.
Gray, A. (2006). The time economy of parenting.Sociological Research Online 11(3): 1–15.doi:10.5153/sro.1393.
Henz, U. (2017). Father involvement in the UK: Trends in the New Millennium. Stockholm: University of Stockholm (FamiliesAndSocieties Working Paper 70). Hook, J.L. (2006). Care in context: Men’s unpaid work in 20 countries, 1965–2003.
American Sociological Review 71(4): 639–660. doi:10.1177/00031224060710 0406.
Hook, J.L. (2012). Working on the weekend: Fathers’ time with family in the United Kingdom.Journal of Marriage and Family 74(4): 631–642. doi:10.1111/j.1741-3737.2012.00986.x.
Hook, J.L. and Wolfe, C.M. (2012). New fathers? Residential fathers’ time with children in four countries. Journal of Family Issues 33(4): 415–550.doi:10.11 77/0192513X11425779.
Ipsos-RSL, Office for National Statistics (2003). United Kingdom Time Use Survey, 2000 [data collection]. Colchester: UK Data Archive.https://beta.ukdataservice. ac.uk/datacatalogue/doi/?id=4504.
Ironmonger, D. (2004). Bringing up Bobby and Betty: The inputs and outputs of childcare time. In: Folbre, N. and Bittman, M. (eds.). Family time: The social organization of care. London and New York: Routledge: 93–109.
Kohn, M.L. (1963). Social class and parent-child relationships: An interpretation. American Journal of Sociology 68(4): 417–480.doi:10.1086/223403.
Lamb, M.E., Pleck, J.H., Charnov, E.L., and Levine, J.A. (1985). Paternal behaviour in humans.American Zoologist 25(3): 883–894.doi:10.1093/icb/25.3.883.
Lareau, A. (2012). Unequal childhoods: Class, race, and family life. Berkeley: University of California Press.
Marsiglio, W. and Roy, K. (2012).Nurturing dads: Social initiatives for contemporary fatherhood. New York: Russell Sage Foundation.
O’Brien, M. (2005). Shared caring: Bringing fathers into the frame. Manchester: Equal Opportunities Commission (Equal Opportunities Commission Working Paper No. 18).
O’Brien, M., Connolly, S., Speight, S., Aldrich, M., and Poole, E. (2016). The United Kingdom. In: Adler, M.A. and Lenz, K. (eds.).Father involvement in the early years. Bristol: Policy Press: 157–191.doi:10.2307/j.ctt1t897nx.10.
ONS (2014). Families in the labour market, 2014 [electronic resource]. Newport: Office for National Statistics. https://webarchive.nationalarchives.gov.uk/2016010804 0741/http://www.ons.gov.uk/ons/rel/lmac/families-in-the-labour-market/2014/ rpt---families-in-the-labour-market.html (accessed February 1, 2019)
Plantin, L., Månsson, S.-A., and Kearney, J. (2003). Talking and doing fatherhood: On fatherhood and masculinity in Sweden and England. Fathering 1(1): 3–26.
doi:10.3149/fth.0101.3.
Pleck, J.H. and Stueve, J.L. (2001). Time and paternal involvement. Contemporary Perspectives in Family Research 3: 205–226. doi:10.1016/S1530-3535(01)800 30-3.
Putnam, R.D. (2015).Our kids: The American dream in crisis. New York: Simon and Schuster.
Richards, L., Garratt, E., Heath, A.F., Anderson, L., and Altintaş, E. (2016). The childhood origins of social mobility: Socioeconomic inequalities and changing opportunities. London: Social Mobility Commission (Report).
Sandberg, J.F. and Hofferth, S.L. (2001). Changes in children’s time with parents: United States, 1981–1997.Demography 38(3): 423–436.doi:10.1353/dem.2001. 0031.
Sayer, L.C., Bianchi, S.M., and Robinson, J.P. (2004). Are parents investing less in children? Trends in mothers’ and fathers’ time with children.American Journal of Sociology110(1): 1–43.doi:10.1086/386270.
Sayer, L.C., Gauthier, A.H., and Furstenberg Jr., F.F. (2004). Educational differences in parents’ time with children: Cross-national variations.Journal of Marriage and Family 66(5): 1152–1169.doi:10.1111/j.0022-2445.2004.00084.x.
Sullivan, O. (2010). Changing difference by educational attainment in fathers’ domestic labour and child care. Sociology 44(4): 716–733. doi:10.1177/0038038510369 351.
Appendix
Figure A-1: Fathers’ childcare involvement by survey year, type of day, and tertiary degree: average minutes (panel a), participation rates (panel b) and minutes provided by active fathers (panel c)
(a) Average minutes
Figure 1: (Continued)
(c) Average minutes provided by active fathers
Table A-1: Full models for fathers’ involvement in physical and interactive care/teaching with SES measured by having a tertiary degree
Weekday Weekend day
Physical care Interactive care Physical care Interactive care Participation Minutes Participation Minutes Participation Minutes Participation Minutes
2014 –0.14 –11.18† –0.44** 9.17 –0.07 –30.22** –0.57*** 13.60 Age youngest child (ref: 0–3)
4–7 –0.77*** –27.52*** –0.40** –13.06** –0.97*** –40.48*** –0.88*** –16.82* 8–14 –2.01*** –33.29*** –1.44*** –16.90*** –2.22*** –47.53*** –1.97*** –39.15*** N. children under 15 (ref: One)
Two 0.41** 11.76* 0.21† –8.48† 0.37** 16.06† 0.07 –3.61 Three+ 0.24 7.55 –0.49* –8.61 –0.06 19.66 –0.33† –8.79 Tertiary degree –0.20 7.04 0.29 –3.51 –0.10 5.88 0.38† 14.81 Tertiary degree * 2014 0.58† –13.51 0.26 –4.52 0.83** 4.56 0.46 –3.81 Couple empl. (ref: Male B/W)
1.5 breadwinner 0.62*** 13.48* 0.11 –3.11 0.63*** 15.66 0.24 8.04 Dual full-time 0.72*** 8.66 –0.07 –6.48 0.40* 13.49 –0.08 4.38 Father not in paid work 0.80** 52.42** 0.17 7.91 0.35 10.47 0.19 12.36 Flexibility 0.25 12.50† 0.14 –0.88 0.17 11.10 0.11 11.33 Long hours –0.27* –2.45 –0.32* 4.83 –0.35* –6.06 –0.29* –5.31 Constant 0.17 58.28*** 0.26 66.96*** 0.53** 96.94*** 0.89*** 93.00***