Ames Laboratory Publications
Ames Laboratory
3-20-2014
H2 Desorption from MgH2 Surfaces with Steps
and Catalyst-Dopants
J. M. Reich
University of Illinois at Urbana-Champaign
Lin-Lin Wang
Ames Laboratory, [email protected]
Duane D. Johnson
Iowa State University, [email protected]
Follow this and additional works at:
http://lib.dr.iastate.edu/ameslab_pubs
Part of the
Catalysis and Reaction Engineering Commons
,
Materials Science and Engineering
Commons
, and the
Physical Chemistry Commons
The complete bibliographic information for this item can be found at
http://lib.dr.iastate.edu/
ameslab_pubs/272
. For information on how to cite this item, please visit
http://lib.dr.iastate.edu/
howtocite.html
.
H2 Desorption from MgH2 Surfaces with Steps and Catalyst-Dopants
Abstract
Light-metal hydrides, like MgH2, remain under scrutiny as prototypes for reversible H-storage materials. For MgH2, we assess hydrogen desorption/adsorption properties (enthalpy and kinetic barriers) for stepped, catalyst-doped surfaces occurring, e.g., from ball-milling in real samples. Employing density functional theory and simulated annealing in a slab model, we studied initial H2 desorption from stepped surfaces with(out) titanium (Ti) catalytic dopant. Extensive simulated annealing studies were performed to find the dopant’s site preferences. For the most stable initial and final (possibly magnetic) states, nudged elastic band (NEB) calculations were performed to determine the H2-desorption activation energy. We used a moment-transition NEB method to account for the dopant’s transition to the lowest-energy magnetic state at each image along the band. We identify a dopant-related surface-desorption mechanism that reloads via bulk H diffusion. While reproducing the observed bulk enthalpy of desorption, we find a decrease of 0.24 eV (a 14% reduction) in the activation energy on doped stepped surface; together with a 22% reduction on a doped flat surface, this brackets the assessed 18% reduction in kinetic barrier for ball-milled MgH2 samples with low concentration of Ti from experiment.
Keywords
Materials Science and Engineering
Disciplines
Catalysis and Reaction Engineering | Materials Science and Engineering | Physical Chemistry
Comments
Reprinted with permission fromJ. Phys. Chem. C.2014. 118(13), pp. 6641–6649, doi:10.1021/jp412826u. Copyright 2014 American Chemical Society.
H
2
Desorption from MgH
2
Surfaces with Steps and Catalyst-Dopants
J. M. Reich,
†,‡Lin-Lin Wang,
‡and Duane D. Johnson
*
,‡,§,∥†Department of Chemistry, University of Illinois, 505 South Matthews, Urbana, Illinois 61801, United States ‡Ames Laboratory, U.S. Department of Energy, Ames, Iowa 50011-3020, United States
§Department of Materials Science & Engineering, Iowa State University, Ames, Iowa 50011-2300, United States
∥Department of Materials Science & Engineering, University of Illinois, 1304 West Green Street, Urbana, Illinois 61801, United States
*
S Supporting InformationABSTRACT: Light-metal hydrides, like MgH2, remain under scrutiny as prototypes for reversible H-storage materials. For MgH2, we assess hydrogen desorption/adsorption properties (enthalpy and kinetic barriers) for stepped, catalyst-doped surfaces occurring, e.g., from ball-milling in real samples. Employing density functional theory and simulated annealing in a slab model, we studied initial H2desorption from stepped surfaces with(out) titanium (Ti) catalytic dopant. Extensive simulated annealing studies were performed to find the dopant’s site preferences. For the most stable initial andfinal (possibly magnetic) states, nudged elastic band (NEB) calculations were performed to determine the H2-desorption
activation energy. We used a moment-transition NEB method
to account for the dopant’s transition to the lowest-energy magnetic state at each image along the band. We identify a dopant-related surface-desorption mechanism that reloads via bulk H diffusion. While reproducing the observed bulk enthalpy of desorption, wefind a decrease of 0.24 eV (a 14% reduction) in the activation energy on doped stepped surface; together with a 22% reduction on a dopedflat surface, this brackets the assessed 18% reduction in kinetic barrier for ball-milled MgH2samples with low concentration of Ti from experiment.
I. INTRODUCTION
Interest continues in MgH2 as a prototype of on-board hydrogen (H) storage material. This study, and others,1−6 reflects the continuous efforts to improve the H2 charge/
discharge thermodynamics and kinetics. The poor thermody-namics and less-than-desirable kinetics of MgH2 keep this promising material from being used as a commercially viable automobile fuel-cell material for on-board H storage, especially when metal-hydrides with higher H gravimetric density7−9 (includes mass of the storage system) are more desirable. As with most storage materials, catalysts are needed at the surface of MgH2 to reduce the high activation energy of H2 desorption.10−21
Thus, MgH2is an ideal prototype to study catalytic doping
and its affect on kinetics. To improve surface-desorption kinetics of MgH2, it is critical to study mechanisms with model structures that replicate those relevant to experiment. In particular, defected surfaces with steps and kink sites are present in nonideal MgH2surfaces addressed in experiment,
21
and should be properly incorporated into models to accurately predict or reproduce experimental results.
Recently, density functional theory (DFT) results were validated to show that the energetics of H2 adsorption/
desorption in MgH2, including the kinetic activation energies, agree with experimental assessments.22−26Here we develop a
framework for studying desorption from a catalyst-doped surface of MgH2with a (110)×(1̅10) stepped surface defect, one of the low-energy steps found in our studies. Using a large terrace, we model systems with low dopant content needed to keep a high gravimetric density for the storage material. We did an exhaustive search for the most stable Ti sites and found low-energy configurations with Ti dopant on the terrace, step edge, or kink sites. We then performed nudged elastic band (NEB) calculations27,28 to explore H2-desorption mechanisms.
A moment-transition NEB (MTNEB), an extension of our previous work,13is used to account for transition of dopants to the lowest-energy magnetic state at each image along the band, and determine H2-desorption barriers. We identify a dopant-related desorption mechanism that reloads via bulk H diffusion. For a single Ti dopant in our supercell, we present decreases in barriers from 5 to 15% relative to the undoped MgH2,
depending on dopant configuration. For example, one highly favored barrier of 1.53 eV on the stepped surface with Ti gives a 0.24 eV (or 14%) reduction from that for pure MgH2. For aflat
MgH2(110) surface, Wang and Johnson13found the desorption
activation energy went from 1.83 to 1.42 eV when a Ti dopant
Received: December 31, 2013
Revised: March 3, 2014
Published: March 10, 2014
Article
pubs.acs.org/JPCC
© 2014 American Chemical Society 6641 dx.doi.org/10.1021/jp412826u|J. Phys. Chem. C2014, 118, 6641−6649
Downloaded by IOWA STATE UNIV on September 2, 2015 | http://pubs.acs.org
was added (a 0.41 eV, or 22%, reduction due to Ti). These results bracket the experimentally observed 18% reduction in activation energy for low-energy ball-milled MgH2 samples
mixed with low concentration Ti.21 Thus, our DFT results predict well both the thermodynamics and kinetic barriers associated with H2adsorption/desorption.
II. COMPUTATIONAL DETAILS
We perform DFT total-energy calculations using the Vienna Ab-initio Simulation Package (VASP)29−32 that employs a plane-wave basis with 250 eV kinetic-energy cutoff and projector augmented wave (PAW) basis-set.33We used a 1× 1×1k-point mesh (Γ-point only) for calculations on the large 450-atom supercell to model a (110)×(1̅10) stepped surface of MgH2. The total energy changed by less than 1 meV when a
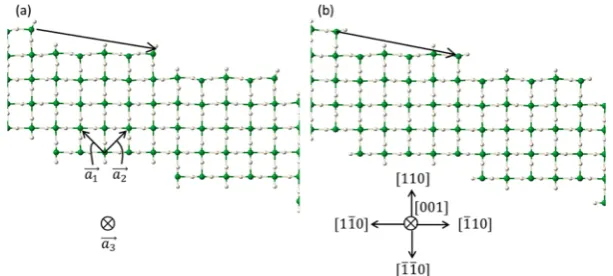
2×2×1k-point mesh was tested. Figure 1 shows the supercell of the stepped surfaces highlighted with the translation vector that connects neighboring step edges. The supercell dimensions are 18.1 Å×16 Å in the plane of the step (with a 3.2 Å step face), and 28.7 Å in the direction normal to the step. The vacuum direction is normal to the step plane and the vacuum spans ∼13 Å. The stepped slab was made five trilayers deep with 4 Mg rows making the terrace, each row consisting of 6 Mg atoms. Except for the bottom trilayer atoms frozen to bulk positions, all atoms are allowed to relax until the absolute magnitude of force is less than 0.02 eV/ Å. The choice of where to place the (110)×(1̅10) step is not unique. In Figure 1a the kink Mg are below atop H (greater distance in thez-direction to the attached H), while in Figure 1b the kink Mg are below bridging H. Figure 1a shows the three primitive lattice vectors
⎯
→ ⎯→ ⎯a, a ,→a
1 2 3 of the bulk MgH2 rutile unit cell. Rutile has a
tetragonal lattice; all three of the primitive lattice vectors are mutually orthogonal. Because the frozen atoms at the bottom of the slab with a step break the symmetry of the bulk rutile structure, we have explicitly defined viewing directions in Figure 1b (in terms of→ ⎯→ ⎯⎯a1, a2,→a3) to aid the description of the
movements in the reaction mechanisms that follow. All mechanisms will be described in the same viewing orientation presented in Figure 1 (with surrounding atoms not shown for clarity).
Calculations were performed with and without spin-polar-ization as detailed in the results. Perdew−Wang generalized gradient approximation (PW91)34was used for the exchange-correlation functional; the same has been used to predict hydrogen-storage reactions35and structure36that are in good
agreement with experiments. For kinetic barrier study of H2
desorption, zero-point energy is largely canceled between initial and final states, and does not affect the relative changes of barrier heights.22
To implement simulated annealing and explore the large configurational space for possible low-energy structures, we performed ab initio molecular dynamics (MD) for 200 steps with a time step of 10 fs using the Nose−Hoover thermostat at system-dependent temperatures high enough to explore configurations of different hydrogen coordination numbers but low enough to prevent the loss of the dopant site (here 1000 K, 700 K, and/or 400 K). All atomic masses were set to the same (195 au) to explore coordinate arrangements efficiently. Low-energy candidate configurations obtained from the potential energy versus time were fully relaxed via conjugate gradient at 0 K. Low-energy configurations were either found to be sufficiently stable at this point or used as input for the next iteration, which provides reliable convergence toward lowest-energy structures.37
For the NEB calculations, we used thequick-minoptimizer to move the system under the NEB forces toward the minimum energy path (MEP).28The climbing image algorithm was also used with the NEB calculations to move the highest energy image toward the saddle point along the reaction coordinate.27 Eleven images in total were used to explore the potential energy surface along the MEP. A spring force constant of 5 eV/ Å2was used. Forces were converged below 0.05 eV/Å. It has been found that [activation] energy changes within a tenth of DFT error when improving the force convergence criterion from 0.05 eV/ Å to 0.02 eV/Å.13
[image:4.625.159.466.67.205.2]To include the direct effects of changing magnetization along a MEP, we developed a MTNEB formalism whereby the influence of the magnetic moment of the atoms participating in the mechanism on energy is included directly for each image along the trajectory.13 Our MTNEB routine calls for (1) explicit constrained moment NEB runs for low-energy magnetic states, followed by (2) a so-called MTNEB run, where each NEB image along the reaction coordinate is initialized to have the lowest-energy configuration for that step with the associated moment (from the moment-constrained NEB results). For this MTNEB run, the moment is no longer constrained, and the system relaxes to the MEP with each image reaching the most stable magnetic state along the path.
Figure 1.MgH2(110)×(1̅10) stepped surfaces, with (001̅) cross section shown. Green (white) corresponds to Mg (H). Mg at the intersection of
the terrace and step face has (a) atop H and (b) bridging H’s above (along [110]), as seen from the (a) long or (b) short distance to the H above the Mg. One supercell translation vector is shown (step to step).
The Journal of Physical Chemistry C Article
dx.doi.org/10.1021/jp412826u|J. Phys. Chem. C2014, 118, 6641−6649
6642
Downloaded by IOWA STATE UNIV on September 2, 2015 | http://pubs.acs.org
III. RESULTS
III-A. Unique Catalytic Dopant Sites.Table 1 shows the results of simulated annealing on the stepped surfaces (the site labels in thefirst column of Table 1 are defined in Figure 2)
and the NEB results with constrained magnetic moments on low-energy configurations. Each unique site for the catalytic dopant was treated with a separate simulated annealing routine. The results are compared in Table 1 (see table caption for the definition of each structure name from thefirst column). The list appears in ascending order of energy (see column three, “Initial State”) starting with the lowest-energy structure used as the energy zero reference. The total magnetic moment of the 450-atom supercell is given in the second column. The activation energy and final state energy for the desorption mechanism of a H2 leaving from the Ti catalyst with a constrained magnetic moment are given for all cases that have a sufficiently low-energy initial state. We found that Ti prefers to be on the surface or in a kink site and so desorption mechanisms for subsurface Ti were not considered. A Ti-doped MgH2(110) surface has the lowest energy with the total
moment of 0μBor 2μB, because Ti only has twod-electrons.13 So here we focus on these two magnetic states.
For the mechanisms studied, we show below that there are either one or zero transition states with energies that are on the same order of the difference between the initial andfinal state. Therefore, for clarity, only the largest barrier along the reaction coordinate is reported for each mechanism in Table 1.
The 10 unique sites (Figure 2) for a dopant in the (110)× (1̅10) single-stepped structure were studied for site preference for low at % dopant. Figure 2 gives the naming convention used for each site. Simulated annealing showed that the structure is most stable with Ti on the surface, on the step edge or at a kink site. Wefind cases where Ti is below the surface (in the second trilayer) are higher in energy. Stable Ti sites demonstrate a total moment of 2μBfor the supercell in all but two cases, where 0
μBis preferred (Table 1).
III-B. Electronic Structure Surrounding Catalytic Dopant.With a Ti dopant accessing two magnetic states (0 and 2μBmoments) along a transition pathway, we establish via
the electronic structure the spatial extent of the magnetization and what role it plays in H2 desorption. Spin-polarized,
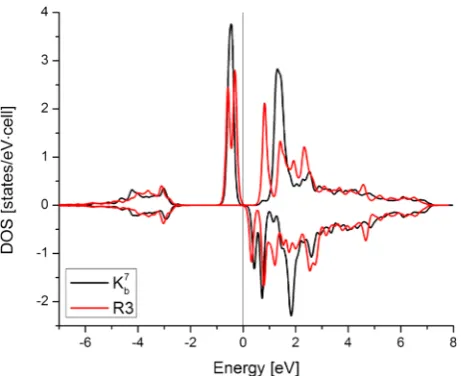
site-projected density of states (DOS) in Figure 3 shows a contribution to the moment from the Ti 3d-orbitals peaks just below the Fermi level. From the DOS, Ti inKb7clearly has a slightly larger moment than that inR3. This can be seen clearly by viewing the localized spin density on the Ti of Kb7 in the cross-section shown in Figure 4 relative to the more delocalized spin density of R3m (R3-like structure) in the cross-section shown in Figure 5. The vacancies left by the in-plane H from the second trilayer of the R3-like structure contribute to the moment.
[image:5.625.65.568.84.284.2]From spin-density isosurfaces and cross sections for the supercell, we confirm that moments are centralized around the Ti dopant, and there will be a need for MTNEB to explore the influence of the magnetic moment on energy and the H in the vicinity of Ti during desorption. The spin density in Figure 4 shows that the largest contribution to the moment in the Kb7 configuration comes from the volume surrounding the Ti.38 Table 1. Simulated Annealing Results with Ti at Unique Sites (*M= Total Moment of Cell)a
most stable magnetic state higher energy magnetic state
site M*[μB] initial state [eV]
activation energy
[eV] final state [eV] M*[μB] initial state [eV]
activation energy
[eV] final state [eV]
Kb7 2 0 7 2.03 6 1.64 6 0 0.47 7 1.58 6 1.58 6
K 2 0.07 7 2.17 6 1.71 6 0 0.32 8 1.99 6 1.71 6
R3m 0 0.17 8 1.56 6 1.55 6 2 1.43 8 0.75 8 −0.06 6
R3 2 0.29 7 1.87 5 1.38 6 0 0.32 8 n.b. - 1.77 6
R1 2 0.32 6 1.96 4 1.56 5 0 0.47 8 1.75 6 1.74 6
S′ 2 0.41 7 1.55 5 1.55 5 0 0.49 7 n.b. - 1.57 5
S″ 2 0.41 7 1.62 5 1.60 5 0 0.49 7 n.b. - 1.86 5
R4 2 0.40 6 - - -
-B4 2 0.49 6 - - -
-B2 2 0.50 6 - - -
-B1 2 0.53 6 - - -
-B3 2 0.54 6 - - -
-R2 2 0.56 6 - - -
-Sb 2 0.68 6 - - - - 0 1.24 6 - - -
-Kb8 0 0.93 8 1.51 6 1.11 7 2 1.08 8 1.93 6 0.85 6
aSite labels are given in Figure 2. Step and kink sites from Figure 1b are denoted by a“b”subscript;“m”subscript refers to a manually built structure.
A numerical superscript signifies different hydrogen coordination number (HCN) of Ti for multiple results with Ti at the same site. When multiple studies were done for a given site with differences in the choice of H removed, the cases are distinguished by prime/double prime, etc. The energy of
Kb7with the most stable magnetic state (M= 2μB) is−1320.72 eV for the 450-atom supercell (the reference for all initial states). Activation energy
andfinal state are referenced to each site’s initial state for a given moment. Ti’s HCN is shown at the right of each energy. No barrier (“n.b.”) means thefinal state has the largest energy along the path.
Figure 2. Unique sites for Ti catalytic dopant within the top two trilayers of Figure 1a.
The Journal of Physical Chemistry C Article
dx.doi.org/10.1021/jp412826u|J. Phys. Chem. C2014, 118, 6641−6649
6643
Downloaded by IOWA STATE UNIV on September 2, 2015 | http://pubs.acs.org
[image:5.625.73.293.412.513.2]For the R3m structure (Figure 5), the spin density and its isosurfaces viewed along the [001] direction show a larger moment closest to Ti (dark purple surface at 0.02 e/Å3). Further out, we find spin density isosurface at 0.005 e/Å3,
located at vacancies in the second trilayer in-plane H sites where (as discussed later) 2 H diffused upward to be closer to Ti. A very small spin density is even visible on the bridging H of the third trilayer. In Figure 5, we see a cross section of spin density that reinforces that the highest spin density (0.05 e/Å3) is closest to Ti.
We have shown that the magnetic moment is mostly on Ti and only slightly spilled over to the H and H-vacancies surrounding the Ti. Thus, whenever a moment is present, it will interact with the H desorbing from the Ti [catalytically active] site. Therefore, it is necessary to test all relevant magnetic states for low-energy configurations along the reaction coordinate. Next, we present the results of MTNEB tofind the MEP along the potential energy surface, exploring the transition of the possible magnetic states found.
III-C. Catalyzed Reaction Mechanisms and Activation Energies.Extensive testing was done on the relative stability of
final states (by choosing different desorbing H pairs) to inform which mechanism had the smallest lower bound on the activation energy. This provided us with highly relevant NEB
[image:6.625.66.297.66.254.2]final states.
Figure 6 shows snapshots of the mechanism for H2
desorption from R3m. In the initial configuration (see close up embedded in graph in Figure 6; H’s are blue, Ti is red), the Ti has an HCN of 8, and the H’s are in positions reminiscent of the vertices of a square antiprism. The surface of R3m has rearranged so the two bridging H’s and the two in-plane H’s around the Ti all become equal participants in the top square of the square antiprism (one easy way to see that the four H’s are not equivalent is to note that there is a step face in the [11̅0] direction and a step cliffin the [1̅10] direction).
The initial state (image 0), transition state (image 5), and
final state (image 12) for H2desorption fromR3mare shown in the right panels in Figure 6, as well as image 2 to highlight that early in the mechanism H coordinated to Ti rotate counter-clockwise along the [001̅] axis (normal to the page) to accommodate the upward movement of H.I (see Roman numeral labels infigure for H coordinated to the Ti). H.I and H.VIII were in-plane H from the second trilayer that migrated to the surface (see initial state). This is clearly a precursor to desorption as we observe that the H nearby diffuse toward the Ti to replace the H that desorbed. In addition, this completed the square antiprism-like arrangement of H around the Ti.
Starting with image 5, the transition state (after the desorbing H’s have broken their bond with Ti), we see H.VI, H.VII, and H.VIII begin a clockwise rotation. Here H.VI and H.VII begin replacing vacancies left by the desorbed H. Note that H.I continues to migrate upward throughout the entire transition pathway, alsofilling in part of the vacancy left by the desorbing H. This mechanism is how Ti reloads its H-coordination during desorption, requiring only bulk diffusion with its small diffusion barrier (approximately half the barrier for desorption from surface). This mechanism is in line with the concerted motion of surface H2-desorption and H bulk
diffusion reported in our previous study.13Here with a larger cell and more degrees of freedom to relax, we are able to show that the complete creation of two H vacancies underneath a Ti catalytic site is indeed preferred. Such a mechanism is not restricted to Ti. A similar process where H is repopulated via diffusion at a Fe site in MgH2, after Fe loses H to desorption,
was found in a recent theoretical work.39
[image:6.625.75.568.571.720.2]Figure 3.Spin-polarized, site-projected DOS on Ti 3d-orbitals forKb7 andR3 configurations, showing majority (minority) spin manifolds on the positive (negative) vertical axis. Fermi level is shifted to 0 for both systems. Peaks at −0.5 eV have no minority spin complement producing a moment (both are 2μBper cell).
Figure 4.ForKb7structure viewed along [001], (left) spin density cross section using a linear color map ranging from 0.05 (red) to 0 e/Å3(dark blue) (shown above 0.002 e/Å3; dark blue at zero not shown), and (right) spin density isosurfaces: dark purple is for 0.02 e/Å3, light blue is for 0.002
e/Å3, and pink for−0.002 e/Å3.
The Journal of Physical Chemistry C Article
dx.doi.org/10.1021/jp412826u|J. Phys. Chem. C2014, 118, 6641−6649
6644
Downloaded by IOWA STATE UNIV on September 2, 2015 | http://pubs.acs.org
The desorption mechanism for S′ shown in Figure 7 is endothermic; however, the energy increases at every step (from images 7 to 8 there was a decrease, but within DFT error) so there is no barrier. Nonetheless, we are still interested in the MEP the atoms took while an H2molecule was formed, as this
is relevant for determining the effect Ti has on shuttling the H during H2-desorption.
[image:7.625.155.471.68.209.2]Notice at the initial state we see H.VI and H.V reaching toward the vacuum tofill“vacancies”that would befilled by in-plane H if the terrace continued. In this reaction, H.III and
[image:7.625.94.534.240.426.2]Figure 5.ForR3mstructure viewed along the [001], (left) spin density cross section, and (right) spin density isosurfaces. Color maps are same as in Figure 4, but the cross section ends at 0.005 e/Å3(left) and light blue now 0.005 e/Å3(right).
Figure 6.DFT-based MEPs forR3mwith 0μB/2μBlow-energy total moment (M) states constrained (black/red curve) and the MEP from MTNEB
(blue curve). Roman numerals on H (left) show numbering of H used on states (right), which show MTNEB results for the desorption of 2 H’s from the catalytic site ofR3m. The MTNEB moments are 0μBfor images 0 through 5 and 2μBfor images 6 through 12. Green spheres are Mg;
white and blue spheres are both H (blue is for the H bonded to Ti).
Figure 7.NEB results for S′with 0μB/2μBlow-energy total moment (M) states enforced (black/red curve) and total moment free to relax (blue
curve). The MTNEB magnetic moments are 2μBfor all images. The color scheme is the same as Figure 6.
The Journal of Physical Chemistry C Article
dx.doi.org/10.1021/jp412826u|J. Phys. Chem. C2014, 118, 6641−6649
6645
Downloaded by IOWA STATE UNIV on September 2, 2015 | http://pubs.acs.org
[image:7.625.87.566.475.669.2]H.IV move toward [1̅10] to fill in the space created by desorption and H.II moves upward tofill in the space left by H.III and H.IV. One other key feature of the mechanism is that the in-plane surface H.I moves down to be closer to Ti. This again shows theflux of H toward the catalyst after desorption from the site begins. All of these effects can be seen in this straightforward mechanism shown in Figure 7 by comparing the initial andfinal states.
A mechanism with the same initial configuration as Figure 7 for S′ is shown in Figure 8 for S″. Here H.V and H.VI are
removed (see inset on graph of Figure 7). For S″, there is not a barrier providing a transition state upon which to focus. For that reason and to note that S′ and S″ are simply different choices of H pairs for desorption, we mention (without adding clutter to Figure 8) that S′′desorption is a very straightforward mechanism where H.I, H.III, and H.IV (see Figure 7 inset) all drift toward [1̅10] to compensate for the “vacancies” left by H.V and H.VI (H.III, and H.IV move just to the [1̅10] side of the step face, and H.I moves along [1̅10] to a point above the initial positions of H.III, and H.IV).
For the MTNEB study, we down selected from Table 1 to only low-energy initial state structures with a HCN higher than 6, which excludes R1. Also we screened out K because the barrier for both constrained moment runs is too high; otherwise, all kink and step sites were studied to explore the full set of surface defects. Table 2 shows that the lowest activation energy, 1.53 eV, found for desorption from a Ti site on the (110) × (1̅10) stepped surface in the R3m structure. (We neglect the Kb8 case with its 1.50 eV barrier because its
initial state is up to 0.93 eV higher than the more stable initial states of the other structures). As discussed, after initial constrained moment NEB tests, we down selected the ones that had lower activation barriers for MTNEB testing. Nonetheless, we report in Table 1 the initial state energy of all of our structures so it can be seen that the MTNEB provided are on systems with thermodynamically relevant initial states.
We also tested desorption of H from the (110) × (1̅10) stepped surface supercell but with Mg put back in place of the Ti dopant (i.e., the pure MgH2stepped surface). We created the stepped surface cut from ideal bulk positions, relaxed the
structure, and then performed desorption of a bridging H and a contiguous in-plane H near a terrace site. Thefirst image of the pure MgH2NEB gave the minimum along the reaction path
(−0.008 eV). Image 4, the highest energy image, was 1.77 eV above the energy from thefirst image. Taking this activation energy of 1.77 eV from our pure MgH2stepped surface relative to ourR3mbarrier of 1.53 eV for the doped system, we see a decrease of 0.24 eV by adding a single Ti dopant in the cell, a 14% reduction. We use the activation energy of 1.77 eV from our pure MgH2 stepped surface, as described above, for the undoped reference for all cases determining the extent of barrier changes with the addition of Ti. ForS″andR3 we see, respectively, a 9% and 5% decrease in the barrier. The outlier casesKb8andK
b
7(upon adding a Ti, theK b
8barrier decreases by
15% and theKb7actually undergoes an increase in barrier) will be discussed below; we will see that the former has a highly unstable initial state contributing to its low barrier, and the latter is a highly stable structure with a high barrier for desorption.
These results can be compared to the study by Wang and Johnson,13where they used a smaller slab to mimic aflat MgH2
(110) surface. For that work, the desorption activation energy went from 1.83 eV for removal of a bridging H and a contiguous in-plane H in the pure MgH2case, to 1.42 eV for desorption after Ti was added. The decrease of the activation energy by 0.41 eV is a 22% reduction.
Experimentally, an 18% reduction in activation energy was assessed for ball-milled MgH2 mixed with 1 atom % Ti.21 Hence, clearly, our DFT results predict well both the thermodynamics and kinetic barriers associated with H2 adsorption/desorption. From experiment, a 0.46 eV reduction of barrier from 2.58 to 2.12 eV was found. Lu et al. discuss that they have activation energies on the high end possibly due to their use of low-energy ball milling. Our theoretical results in the reduction of kinetic barrier for H2 desorption due to Ti
dopant on stepped and flat surfaces bracket the experimental reduction in activation energy at low Ti concentration in MgH2.
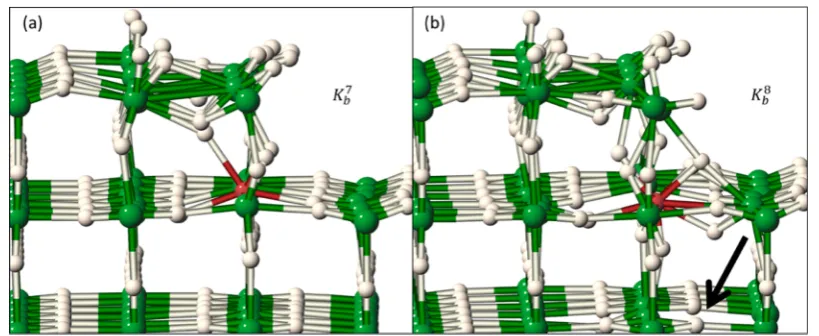
The last two MTNEB runs, Figures 10 and 11, will show the desorption mechanisms for Kb7 and Kb8. However, there is an interesting trade-offat play in these two systems which we will highlight (Figure 9) before discussing the mechanisms in Figures 10 and 11.
Recall from Table 1 thatKb7andKb8are the lowest and highest energy structures found, respectively; and in Table 2 it showed thatKb7andKb8have the highest and lowest activation energies, respectively. Figure 9a shows that the stability of Kb7 can be
[image:8.625.64.292.183.366.2]understood in terms of the reconstruction (in the absence of two bulk-nearest-neighbor directions) that the step-atoms are free to undergo to stabilize the Ti site. However, it is clear that
Figure 8.NEB results for S″with 0μB/2μBlow-energy total moment
(M) states enforced (black/red curve) and total moment free to relax (blue curve). The MTNEB magnetic moments are 0μBfor image 2
and 2μBfor images 0, 1, and 3−12.
Table 2. Activation Energies for the MTNEB Runsa
site R3m S′ S″ R3 Kb8 K b 7
MTNEB initial state [eV] 0.17 0.41 0.41 0.29 0.93 0 MTNEB activation
energy [eV]
1.53 n.b. 1.61 1.69 1.50 1.95
MTNEBfinal state [eV] 1.21 1.55 1.60 1.38 0.99 1.64 final−initial [eV] 1.04 1.14 1.19 1.09 0.06 1.64 aAs in Table 1, the initial states are all reported relative toK
b 7, but the
activation energy andfinal state for a given site is relative to the initial state for that site.“n.b.”means“no barrier”; energy increases after each step (any decrease within DFT error). See figure caption for each mechanism for detail on the magnetic moment at each step along the MEP.
The Journal of Physical Chemistry C Article
dx.doi.org/10.1021/jp412826u|J. Phys. Chem. C2014, 118, 6641−6649
6646
Downloaded by IOWA STATE UNIV on September 2, 2015 | http://pubs.acs.org
Kb8, Figure 9b, is perturbed from equilibrium rutile sites considerably more (note the arrow pointing to a vacancy site in the subtrilayer providing an extra H around the Ti) causing the energy of the initial state to go up. The higher coordination number and lower stability ofKb8allows for the lower activation
barrier for H2desorption from that structure.
Figure 10 shows the Kb7NEB results. The lowest activation
energy we found for this case involves one of the H (H.VIII from Figure 10) coming from Mg. The other H to leave was H.IV. Briefly, the activity locally around the Ti was such that at image 1 Ti moves up and H.VIII moves down creating a bond with Ti (which temporarily has a HCN of 8). At image 2, H.VII goes below the surface to accommodate H.VIII as it continues to move downward. And atom H.I moves up toward [110] and H.II to the [1̅10] direction. For image 3, H.VIII and H.IV leave and H.III immediately moves tofill the″vacancy″as does H.VII by moving back up to its original location. At image 4, H.III moves back toward [11̅0]. For image 5 (not shown), H.II moves toward [11̅0] and H.I moves back to its original in-plane location. After image 5, the H do not rearrange much. At the
end of the mechanism, the two Mg’s that H.VIII was bonded to have moved closer to the Ti.
The initial configuration of the mechanism in Figure 11 (i.e., Kb8) is actually quite close to that ofR3
m: the Ti has a HCN of 8 and the H are in positions reminiscent of the vertices of a square antiprism, although, understandably, the distortion here is more pronounced with the Ti being on a kink site. After the
[image:9.625.108.518.66.234.2]first step of the mechanism (see image 1), H.VII has moved up toward [110] in order to allow H.VIII to do the same so that H.VIII has a clear trajectory to the vacuum space. H.VI moves toward [001̅] to make room. At image 2, H.VI has taken the space originally held by H.VIII and at image 3 H.VII and H.VIII have moved into the vacuum. After the transition state, the mechanism shows very little movement other than H.VI moving in the [110] direction tofill in vacancy left by the H that desorbed. Note that by the transition state, Ti has a HCN of 6, giving an octahedral-like geometry around the Ti.
[image:9.625.100.522.266.459.2]Figure 9.(a,b) Comparison of (Kb7/K8b). There is noticeably more distortion around the Ti in Kb8 in addition to the subtrilayer vacancy inKb8 indicated by the arrow. Green, Mg; white, H; red, Ti.
Figure 10.Kb7NEB results with 0μB/2μBlow-energy total moment (M) states enforced (black/red curve) and total moment free to relax (blue
curve). Here we show image 0 only in the enlarged inset-image on the graph. Images 1−4 are shown to the right. The MTNEB moments are 0μBfor
images 1−3 and 2μBfor images 0 and 4−12. Note: A structure essentially identical toKb7but 0.03 eV lower in energy was produced during a NEB but gave a high activation energy (2.24 eV) for a different choice of H for desorption. So,Kb7is still used as the zero of energy; the atoms in the new structure undergo a fairly rigid shift, leaving the bonding motif unchanged. The color scheme is the same as Figure 6, but here black shows H’s not bonded to Ti but involved in desorption.
The Journal of Physical Chemistry C Article
dx.doi.org/10.1021/jp412826u|J. Phys. Chem. C2014, 118, 6641−6649
6647
Downloaded by IOWA STATE UNIV on September 2, 2015 | http://pubs.acs.org
IV. CONCLUSION
To theoretically investigate how to improve the poor kinetics of MgH2, we have studied the enthalpy and barriers controlling
the H adsorption and desorption in MgH2. We have detailed the role of Ti catalyst dopants in reducing the energy barrier for desorption. We created a defected surface (step and kink sites) to model practical nonideal MgH2surface, as found in
balled-milled samples.
Through simulated annealing, we found that the (110) × (1̅10) stepped surface of MgH2 structure is lowest in energy
when Ti is on the terrace, step edge or step kink site. Following annealing, a detailed electronic structure analysis was performed to determine the origin for stability and magnetic moment formation; in the cases shown, the moment resides in the area immediately surrounding Ti and therefore any desorption of H bonded to Ti will be affected by the moment in this system.
To account for magnetism effects on kinetic barriers related to the catalyst-dopant, we extended the NEB method to include moment transitions at each image along the band (a so-called Moment Transition NEB). The MTNEB enforces the most stable magnetic moments throughout separate NEB runs, and then used the lowest energy structure with its associated magnetic moment from each image to initialize a new NEB run where the moments are free to relax. We showed that MTNEB typically led to a lower energy MEP and/or lower activation energy than that for the moment constrained runs.
Although the calculated complete H2desorption enthalpy for
doped MgH2agrees well with experiment, such thermodynamic
energies do not reveal the initial desorption mechanism and its associated barriers. Here, wefind a range of barrier reductions (5% to 15%) depending on step and doping configurations; a barrier even went up for one configuration. From MTNEB, we found a decrease of 0.24 eV in the activation energy for the most favored desorption mechanism (a 14% reduction), whereas a 22% reduction was found previously on a perfect terrace. Our results compare well and bracket the experimental
finding of an 18% reduction in barrier for ball-milled MgH2 with 1% Ti.21The key dopant-related desorption mechanism identified shows two H’s desorb near the dopant at the MgH2
terraces and steps, and these H’s are continually “reloaded” from the subsurface via bulk H diffusion.
■
ASSOCIATED CONTENT*
S Supporting InformationDetails on implementing the Moment Transition Nudged Elastic Band are included in the Supporting Information. This material is available free of charge via the Internet at http:// pubs.acs.org.
■
AUTHOR INFORMATIONCorresponding Author
*E-mail: [email protected]. Notes
The authors declare no competingfinancial interest.
■
ACKNOWLEDGMENTSOur work was supported by the U.S. Department of Energy, Office of Basic Energy Sciences under contracts DEFC36-05GO15064 (Sandia Metal-Hydride Center of Excellence for J.M.R.), and DE-FG02-03ER15476 (Chemical Sciences, Geo-sciences, and Biosciences for L.L.W. and D.D.J.) and at Ames Laboratory (Complex Hydrides for D.D.J.). Ames Laboratory is operated for the U.S. DOE by Iowa State University under Contract DE-AC02-07CH11358. We also acknowledge collab-orations with experimental efforts of Ian Robertson (MHCoE), and Ralph Nuzzo (catalysis) at Illinois, and Vitalij Pecharsky (ball-milling and desorption) at Ames Laboratory. We thank Nikolai Zarkevich from our group who used VESTA (Momma, K.; Izumi, F.J. Appl. Crystallogr.2011, 44, 1272) to turn data we provided him into the spin density plots seen here.
■
REFERENCES(1) Fan, X. L.; Xiao, X. Z.; Chen, L. X.; Wang, X. H.; Li, S. Q.; Ge, H. W.; Wang, Q. D. High Catalytic Efficiency of Amorphous TiB2and
NbB2Nanoparticles for Hydrogen Storage Using the 2LiBH4-MgH2
System.J. Mater. Chem. A2013,1, 11368.
(2) Xiao, X. Z.; Shao, J.; Chen, L. X.; Kou, H. Q.; Fan, X. L.; Deng, S. S.; Zhang, L. T.; Li, S. Q.; Ge, H. W.; Wang, Q. D. Effects of NbF5
Addition on the De/Rehydrogenation Properties of 2LiBH4/MgH2
[image:10.625.133.496.59.253.2]Hydrogen Storage System.Int. J. Hydrogen Energy2012,37, 13147.
Figure 11.Kb8NEB results with 0μB/2μBlow-energy total moment (M) states enforced (black/red curve) and total moment free to relax (blue
curve). The MTNEB magnetic moments are 0μBfor images 0 through 3 and 2μBfor images 4 through 12. The color scheme is the same as that in
Figure 6.
The Journal of Physical Chemistry C Article
dx.doi.org/10.1021/jp412826u|J. Phys. Chem. C2014, 118, 6641−6649
6648
Downloaded by IOWA STATE UNIV on September 2, 2015 | http://pubs.acs.org
(3) Luo, W. F.; Stavila, V.; Klebanoff, L. E. New Insights into the Mechanism of Activation and Hydrogen Absorption of (2LiNH2
-MgH2).Int. J. Hydrogen Energy2012,37, 6646.
(4) Zhou, S. X.; Chen, H. P.; Ding, C.; Niu, H. L.; Zhang, T. H.; Wang, N. F.; Zhang, Q. Q.; Liu, D.; Han, S. N.; Yu, H. G. Effectiveness of Crystallitic Carbon from Coal as Milling Aid and for Hydrogen Storage During Milling with Magnesium.Fuel2013,109, 68.
(5) Song, M. Y.; Kwak, Y. J.; Lee, S. H.; Song, J.; Mumm, D. R. Enhancement of Hydrogen-Storage Performance of MgH2by Mg2Ni
Formation and Hydride-Forming Ti Addition.Int. J. Hydrogen Energy
2012,37, 18133.
(6) Jain, P.; Lang, J.; Skryabina, N. Y.; Fruchart, D.; Santos, S. F.; Binder, K.; Klassen, T.; Huot, J. MgH2 as Dopant for Improved
Activation of Commercial Mg Ingot.J. Alloys Compd.2013,575, 364. (7) Zhou, C.; Fang, Z. Z.; Lu, J.; Zhang, X. Thermodynamic and Kinetic Destabilization of Magnesium Hydride Using Mg−In Solid Solution Alloys.J. Am. Chem. Soc.2013,135, 10982.
(8) Sabitu, S. T.; Goudy, A. J. Dehydrogenation Kinetics and Modeling Studies of MgH2 Enhanced by NbF5 Catalyst Using
Constant Pressure Thermodynamic Forces. Int. J. Hydrogen Energy
2012,37, 12301.
(9) Tao, S. X.; Kalisvaart, W. P.; Danaie, M.; Mitlin, D.; Notten, P. H. L.; van Santen, R. A.; Jansen, A. P. J. First Principle Study of Hydrogen Diffusion in Equilibrium Rutile, Rutile with Deformation Twins and Fluorite Polymorph of Mg Hydride.Int. J. Hydrogen Energy2011,36, 11802.
(10) Du, A. J.; Smith, S. C.; Yao, X. D.; Sun, C. H.; Li, L.; Lu, G. Q. The Role of V2O5 on the Dehydrogenation and Hydrogenation in
Magnesium Hydride: An Ab Initio Study.Appl. Phys. Lett.2008,92, 163106.
(11) Du, A. J.; Smith, S. C.; Yao, X. D.; Lu, G. Q. Ab Initio Studies of Hydrogen Desorption from Low Index Magnesium Hydride Surface.
Surf. Sci.2006,600, 1854.
(12) Du, A. J.; Smith, S. C.; Lu, G. Q. First-Principle Studies of the Formation and Diffusion of Hydrogen Vacancies in Magnesium Hydride.J. Phys. Chem. C2007,111, 8360.
(13) Wang, L.-L.; Johnson, D. D. Hydrogen Desorption from Ti-Doped MgH2(110) Surfaces: Catalytic Effect on Reaction Pathways
and Kinetic Barriers.J. Phys. Chem. C2012,116, 7874.
(14) Reilly, J. J.; Wiswall, R. H. Reaction of Hydrogen with Alloys of Magnesium and Copper.Inorg. Chem.1967,6, 2220.
(15) Bogdanovic, B.; Spliethoff, B. Active MgH2−Mg-Systems for
Hydrogen Storage.Int. J. Hydrogen. Energy1987,12, 863.
(16) Ivanov, E.; Konstanchuk, I.; Stepanov, A.; Boldyrev, V. Magnesium Mechanical Alloys for Hydrogen Storage.J. Less-Common Met.1987,131, 25.
(17) Nagai, H.; Tomizawa, H.; Ogasawara, T.; Shoji, K. Hydriding Characteristics of Mg-Xwt % LaNi5 Sintered Alloys.J. Less-Common Met.1990,157, 15.
(18) Liang, G.; Huot, J.; Boily, S.; Van Neste, A.; Schulz, R. Catalytic Effect of Transition Metals on Hydrogen Sorption in Nanocrystalline Ball Milled MgH2-Tm (Tm = Ti, V, Mn, Fe and Ni) Systems.J. Alloys
Compd.1999,292, 247.
(19) Oelerich, W.; Klassen, T.; Bormann, R. Metal Oxides as Catalysts for Improved Hydrogen Sorption in Nanocrystalline Mg-Based Materials.J. Alloys Compd.2001,315, 237.
(20) Ma, L. P.; Wang, P.; Cheng, H. M. Improving Hydrogen Sorption Kinetics of MgH2by Mechanical Milling with TiF3.J. Alloys
Compd.2007,432, L1.
(21) Lu, H. B.; Poh, C. K.; Zhang, L. C.; Guo, Z. P.; Yu, X. B.; Liu, H. K. Dehydrogenation Characteristics of Ti- and Ni/Ti-Catalyzed Mg Hydrides.J. Alloys Compd.2009,481, 152.
(22) Reich, J. M.; Wang, L. L.; Johnson, D. D. Surface and Particle-Size Effects on Hydrogen Desorption from Catalyst-Doped MgH2.J.
Phys. Chem. C2012,116, 20315.
(23) Pozzo, M.; Alfe, D. Structural Properties and Enthalpy of Formation of Magnesium Hydride from Quantum Monte Carlo CalculationsPhys. Rev. B2008,77.
(24) Wu, Z. G.; Allendorf, M. D.; Grossman, J. C. Quantum Monte Carlo Simulation of Nanoscale MgH2Cluster Thermodynamics.J. Am.
Chem. Soc.2009,131, 13918.
(25) Hector, L. G.; Herbst, J. F.; Kresse, G. Ab Initio Thermodynamic and Elastic Properties of Alkaline-Earth Metals and Their Hydrides.Phys. Rev. B2007,76, 014121.
(26) Wolverton, C.; Siegel, D. J.; Akbarzadeh, A. R.; Ozolins, V. Discovery of Novel Hydrogen Storage Materials: An Atomic Scale Computational Approach.J. Phys.: Condens. Matter2008,20, 064228. (27) Henkelman, G.; Uberuaga, B. P.; Jonsson, H. A Climbing Image Nudged Elastic Band Method for Finding Saddle Points and Minimum Energy Paths.J. Chem. Phys.2000,113, 9901.
(28) Sheppard, D.; Terrell, R.; Henkelman, G. Optimization Methods for Finding Minimum Energy Paths. J. Chem. Phys. 2008,
128, 163106.
(29) Kresse, G.; Hafner, J. Ab Initio Molecular-Dynamics for Liquid-Metals.Phys. Rev. B1993,47, 558.
(30) Kresse, G.; Furthmuller, J. Efficiency of Ab-Initio Total Energy Calculations for Metals and Semiconductors Using a Plane-Wave Basis
Set.Comput. Mater. Sci.1996,6, 15.
(31) Kresse, G.; Furthmuller, J. Efficient Iterative Schemes for Ab Initio Total-Energy Calculations Using a Plane-Wave Basis Set.Phys.
Rev. B1996,54, 11169.
(32) Kresse, G.; Hafner, J. Ab Initio Molecular-Dynamics Simulation of the Liquid-Metal−Amorphous-Semiconductor Transition in Germanium.Phys. Rev. B1994,49, 14251.
(33) Kresse, G.; Joubert, D. From Ultrasoft Pseudopotentials to the Projector Augmented-Wave Method.Phys. Rev. B1999,59, 1758.
(34) Perdew, J. P.; Wang, Y. Accurate and Simple Analytic Representation of the Electron-Gas Correlation-Energy.Phys. Rev. B
1992,45, 13244.
(35) Ozolins, V.; Majzoub, E. H.; Wolverton, C. First-Principles Prediction of Thermodynamically Reversible Hydrogen Storage Reactions in the Li-Mg-Ca-B-H System. J. Am. Chem. Soc. 2009,
131, 230.
(36) Akbarzadeh, A. R.; ; Wolverton, C.; Ozolins, V. First-Principles Determination of Crystal Structures, Phase Stability, and Reaction Thermodynamics in the Li-Mg-Al-H Hydrogen Storage SystemPhys.
Rev. B2009,79.
(37) Wang, L. L.; Johnson, D. D. Density Functional Study of Structural Trends for Late-Transition-Metal 13-Atom Clusters.Phys.
Rev. B2007,75, 235405.
(38) Momma, K.; Izumi, F. VESTA 3 for Three-Dimensional Visualization of Crystal, Volumetric and Morphology Data.J. Appl.
Crystallogr.2011,44, 1272.
(39) Larsson, P.; Araujo, C. M.; Larsson, J. A.; Jena, P.; Ahuja, R. Role of Catalysts in Dehydrogenation of MgH2 Nanoclusters. Proc.
Natl. Acad. Sci. U. S. A.2008,105, 8227.
The Journal of Physical Chemistry C Article
dx.doi.org/10.1021/jp412826u|J. Phys. Chem. C2014, 118, 6641−6649
6649
Downloaded by IOWA STATE UNIV on September 2, 2015 | http://pubs.acs.org

![Figure 5. For R3m structure viewed along the [001], (left) spin density cross section, and (right) spin density isosurfaces](https://thumb-us.123doks.com/thumbv2/123dok_us/8126179.240983/7.625.87.566.475.669/figure-structure-viewed-density-cross-section-density-isosurfaces.webp)