Biogeosciences, 12, 3301–3320, 2015 www.biogeosciences.net/12/3301/2015/ doi:10.5194/bg-12-3301-2015
© Author(s) 2015. CC Attribution 3.0 License.
Emergence of multiple ocean ecosystem drivers in a large ensemble
suite with an Earth system model
K. B. Rodgers1, J. Lin2, and T. L. Frölicher3
1Program in Atmospheric and Oceanic Sciences, Princeton University, Princeton, USA 2Dept. of Computer Science, Princeton University, Princeton, USA
3Environmental Physics, Institute of Biogeochemistry and for Pollutant Dynamics, ETH Zürich, Switzerland
Correspondence to: K. B. Rodgers ([email protected])
Received: 6 December 2014 – Published in Biogeosciences Discuss.: 21 December 2014 Revised: 22 April 2015 – Accepted: 23 April 2015 – Published: 3 June 2015
Abstract. Marine ecosystems are increasingly stressed by human-induced changes. Marine ecosystem drivers that con-tribute to stressing ecosystems – including warming, acidi-fication, deoxygenation and perturbations to biological pro-ductivity – can co-occur in space and time, but detecting their trends is complicated by the presence of noise asso-ciated with natural variability in the climate system. Here we use large initial-condition ensemble simulations with an Earth system model under a historical/RCP8.5 (representa-tive concentration pathway 8.5) scenario over 1950–2100 to consider emergence characteristics for the four individual and combined drivers. Using a 1-standard-deviation (67 % confidence) threshold of signal to noise to define emergence with a 30-year trend window, we show that ocean acidifica-tion emerges much earlier than other drivers, namely during the 20th century over most of the global ocean. For biolog-ical productivity, the anthropogenic signal does not emerge from the noise over most of the global ocean before the end of the 21st century. The early emergence pattern for sea sur-face temperature in low latitudes is reversed from that of subsurface oxygen inventories, where emergence occurs ear-lier in the Southern Ocean. For the combined multiple-driver field, 41 % of the global ocean exhibits emergence for the 2005–2014 period, and 63 % for the 2075–2084 period. The combined multiple-driver field reveals emergence patterns by the end of this century that are relatively high over much of the Southern Ocean, North Pacific, and Atlantic, but rel-atively low over the tropics and the South Pacific. For the case of two drivers, the tropics including habitats of coral reefs emerges earliest, with this driven by the joint effects of acidification and warming. It is precisely in the regions with
pronounced emergence characteristics where marine ecosys-tems may be expected to be pushed outside of their comfort zone determined by the degree of natural background vari-ability to which they are adapted. The results underscore the importance of sustained multi-decadal observing systems for monitoring multiple ecosystems drivers.
1 Introduction
interior (Frölicher et al., 2009; Keeling et al., 2010), caus-ing a loss of oxygen there modulated by solubility-driven oxygen changes. The magnitude of these global drivers will likely continue to grow, given current trends in fossil fuel CO2emissions and the strong inertia within the global com-munity with respect to efforts to decarbonize (Friedlingstein et al., 2014).
The detection of secular trends in driver fields on regional to global scales is complicated by the presence of natural variability in the climate system, as has been shown for dis-solved oxygen by Frölicher et al. (2009). The presence of background natural variability motivates the introduction of the concept of emergence to identify where the signal (the secular trend) becomes larger than the noise (the background natural variability). Identifying and understanding when and where the secular trends in ocean drivers emerge above the noise is important for two reasons. The first is that emer-gence characterizes when the secular trend becomes evident or perceptible locally relative to the background variability for an observer. This is intended as a predecessor step to considering perceptible changes for the ecosystems them-selves, as emergence or perceptible change to an observer will be a necessary but not sufficient condition for percepti-ble change being experienced by ecosystems. For example, most organisms are not very sensitive to O2levels as long as the O2concentrations are sufficient. However below a criti-cal threshold (e.g., hypoxia) many organisms start to suffer from several physiological stresses (e.g., Vaquer-Sunyer and Duarte, 2008). The value of Earth system models is that they can characterize perceptible change from the vantage point of an observer. The second reason is that understanding of the emergence of multiple drivers will be important for op-timizing the design of the global ocean observing system. Inferring trends in drivers from Repeat Hydrography is com-plicated by natural variability in the ocean (Rodgers et al., 2009), and natural variability can also complicate trend de-tection using time series data (Henson et al., 2014).
Previous studies exploring the concept of emergence have largely focused on physical state variables of the atmosphere and ocean, such as temperature, precipitation and sea level (e.g., Diffenbaugh and Scherer, 2011; Hawkins and Sut-ton, 2012; Mahlstein et al., 2012; Mora et al., 2013; Lyu et al., 2014). Mora et al. (2013), for example argued that the tropics, which hold the worlds greatest diversity of marine species, will exhibit emergence in ocean warming 10 years earlier than any of the other global ocean regions. Far less attention has been devoted to date to signal-to-noise ratios in ocean biogeochemistry, a notable exception being the study of Keller et al. (2014).
Here we introduce a new suite of large initial-condition ensemble simulations using an Earth system model to un-derstand the local emergence characteristics of the ocean ecosystem drivers sea surface temperature (SST), sea wa-ter saturation state with respect to aragonite (arag), a min-eral phase of calcium carbonate, oxygen levels (O2), and
net primary productivity (NPP) over an interdecadal (30-year) timescale. The ocean state as expressed in SST ex-hibits pronounced decadal-to-interdecadal variability (Zhang et al., 1997), and variations on this timescale are well doc-umented for oxygen (Emerson et al., 2004; Mecking et al., 2008; Kouketsu et al., 2010; Takatani et al., 2012). This has also been considered for the case of phytoplankton in the study of Martinez et al. (2009).
In opting to use a suite of large initial-condition ensem-ble simulations, we emphasize in particular the uncertainty in estimates of emergence due to natural variability inher-ent in the climate system. Deconvolving the signature of the forced response from the background natural variability with one coupled model requires large initial-condition ensem-ble simulations. Only with a sufficiently large number of ensemble members can the effects of natural variability be removed by averaging over the ensemble members. With a single model run of a coupled climate model, one is forced to estimate noise either from simulated pre-industrial vari-ability or through high-pass filtering of a scenario run (e.g., Deser et al., 2014). The problem is that the forced response is in general imbedded in a stochastic dynamical system that exhibits variability on all timescales. Additionally, the ampli-tude of major modes of variability such as El Niño-Southern Oscillation (ENSO) is not stationary in their amplitude over climate change timescales (Timmermann et al., 1999). The ensemble approach to coupled modelling thereby offers an important opportunity when applied to the case of ecosystem drivers (Frölicher et al., 2009).
2 Methods
2.1 Model and simulations
We conducted 30 ensemble simulations over the 1950–2100 period following historical and RCP8.5 concentration path-ways (van Vuuren et al., 2011). RCP8.5 is the “business-as-usual” member of the intergovernmental Panel on Cli-mate Change (IPCC) representative concentration pathways (RCPs) over the 21st century. All 30 ensemble members are run with the same coupled Earth system model developed at the Geophysical Fluid Dynamics Laboratory (Dunne et al., 2012, 2013): GFDL’s ESM2M. The physical state model underlying ESM2M is the updated version of the coupled model CM2.1 (Delworth et al., 2006), consisting of the 1-degree version of the MOM4p1 ocean model (Griffies, 2009) coupled to an approximately 2-degree configuration of the AM2 atmospheric model (Anderson et al., 2004). The ocean biogeochemical model is Tracers of Ocean Phytoplankton and Allometric Zooplankton code version 2 including 30 tracers to represent cycles of carbon, oxygen, and the major macronutrients and iron (Dunne et al., 2010).
atmo-K. B. Rodgers et al.: Emergence of multiple ocean ecosystem drivers 3303 sphere/land/ocean/sea ice components of the Earth system
model. This was accomplished by using model state snap-shots for the ends of days 1–29 in January 1950 as the ini-tial model states for 1 January 1950 for each of the ensem-ble members 2–30. As has been shown by Wittenberg et al. (2014) using significantly smaller initial perturbations to the ocean component only with nearly the same underlying physical coupled model, our initial condition perturbations lead to a randomization of the ENSO state amongst the indi-vidual ensemble members within 5 years. Given that decadal modulations of ENSO are the most pronounced driver of Tropical Pacific Decadal variability in the underlying phys-ical coupled model (Wittenberg, 2009), decadal variability emanating from the tropics will be randomized amongst the individual ensemble members.
The four drivers considered in this study are (i) surface
arag, (ii) SST, (iii) subsurface O2vertically integrated from 100 to 600 m, and (iv) NPP vertically integrated over the top 100 m. Our focus on subsurface O2concentrations is in-tended to characterize regimes ranging from oxygen mini-mum zones to the main thermocline of polar and circumpolar regions.
2.2 Confidence intervals and detection of time of emergence
In order to quantify emergence characteristics, it is neces-sary to specify a timescale over which trends are calculated. We use decadal trends considered over 30-year intervals on a gridpoint-by-gridpoint basis to quantify signal-to-noise ra-tios for each of the four drivers. The signal is the linear trend obtained using the ensemble mean, and the noise is the stan-dard deviation of the 30-year trends for the individual en-semble members. The signal-to-noise ratio is thereby calcu-lated as the ratio of these two terms, and thereby associated with this specific 30-year timescale. The choice of a 30-year trend window is motivated by the approximate length of rel-atively continuous elements of the global observing system and by the timescale of important natural variability phe-nomena such as the Pacific Decadal Oscillation. Given that our model runs span 1950–2100, and our choice of 30-year trends, signal to noise can effectively be calculated over each year, spanning the period 1965–2085.
Central to our analysis is the model-derived quantifica-tion of confidence intervals for trend detecquantifica-tion. We assume that the 30-year trends for the 30 individual ensemble mem-bers are normally distributed. For a given time-window (30 years), the signal-to-noise ratio (SNR) is calculated using the relationship between the ensemble mean TREND and the standard deviation (σnoise) of the trends of the various en-semble members, which we denote as NOISE:
SNR=TREND/NOISE. (1)
Here we focus on a threshold of 1 for SNR, representing a confidence interval of 67 % for emergence. In other words,
the threshold of 1 is used to characterize when the “signal” of anthropogenic climate change rises above the “noise” of natural background variability. However, the sensitivity to a choice of two (95 % confidence) for the threshold will also be considered. We choose two time intervals over which we consider average confidence intervals: the first is for the most recent decade 2005–2014, and the second is the decade 2075–2084 towards the end of the 21st century. The confi-dence intervals are calculated using 30-year trends year by year over each of the 10-year intervals before considering 10-year averages over the respective intervals. An averaging interval of 10 years was sufficient to remove noise present in analysis for individual years in the confidence intervals, pre-sumably due to the fact that even with 30 ensemble members the modes of variability are not sufficiently randomized.
Additionally, we also consider the sensitivity of the confi-dence intervals to the choice of the width of the trend win-dow. To that end, confidence intervals are also considered for the case of a 10-year window. From the spectral SST charac-teristic of the underlying coupled (atmosphere/ocean) model, it has been shown in Fig. 2 in Wittenberg (2009) and Fig. 7 in Dunne et al. (2012) that SST variability is more pronounced over 10-year timescales than over 30-year timescales. Thus one may well expect that the signal-to-noise ratio character-istics for the ecosystem drivers reflect these underlying dy-namical drivers of variability, at least in the equatorial Pa-cific. Thus our sensitivity analysis is intended to offer insight into both of our primary interests described in the Introduc-tion, namely identification of perceptible changes for an ob-server and optimization of the observing system.
Our analysis also includes diagnostics of time of emer-gence (ToE). In contrast to the confidence interval diagnostic for fixed time intervals, ToE requires that we first specify a fixed threshold (here we choose 67 %) for confidence inter-vals and then calculate the time (year) at which that is sat-isfied on a gridpoint-by-gridpoint basis for each driver. For consistency, a 30-year trend window is used here as well in the calculation of ToE.
3 Results
3.1 Temporal hierarchy of global and regional emergence of individual drivers
We start the analysis with the temporal hierarchy of emer-gence for the globe as well as for various regions, such as the Southern Ocean (90–45◦S), the southern subtropics
Figure 1. Time series of (area weighted) averages of signal-to-noise ratio (SNR) for four marine ecosystem drivers, considered over a number of ocean regions: (a) Global, (b) 90–45◦S, (c) 45–15◦S, (d) 15◦S–15◦N, (e) 15–45◦N, and (f) 45–90◦N. The four drivers arearag, SST, O2inventories, and NPP. For each driver, trends have been calculated individually on a gridpoint-by-gridpoint basis using a 30-year trend window, and the SNR was subsequently calculated. The vertical axis has a logarithmic scale (non-dimensional) representing the SNR. The 1-standard-deviation threshold is shown as a solid horizontal line, and the 2-standard-deviation threshold is shown as a dashed line in each panel.
(Fig. 1a), with arag (gray line in Fig. 1a) already having risen above the 1-standard-deviation threshold (67 %, black solid vertical axis in Fig. 1a) by the beginning of the pe-riod considered (by 1965). This is followed by SST (orange line in Fig. 1a), which globally emerges from the 67 % confi-dence level by the year 2000. O2inventories rising above the 67 % confidence interval by approximately 2060 (blue line in Fig. 1a), whereas NPP remains below the 67 % confidence level over the entire time period (purple line in Fig. 1a).
The regional behavior of the four drivers is shown in Fig. 1b–f. Overall, the hierarchy found in the global analy-sis tends to be reproduced on a regional scale but with a few notable exceptions. First, the Southern Ocean differs from the other regions in that the O2inventories (blue solid line in Fig. 1b) are more detectable than SST (orange line in Fig. 1b) over the full period. Additionally, the subtropical SST tends to emerge from the 67 % confidence interval by 1990–2010 (orange lines in Fig. 1c–e), with this not being the case for the Southern Ocean and the Northern subpolar/Arctic regions
(orange lines in Fig. 1b, f). The commonality is thataragis above the 67 % confidence interval in all regions for the du-ration of the analysis period, whereas the NPP signal remains below the 67 % confidence level for the duration of the anal-ysis period in all regions, with the exception of the southern subtropics for the period post-2070.
3.2 Local emergence confidence intervals for individual drivers
K. B. Rodgers et al.: Emergence of multiple ocean ecosystem drivers 3305
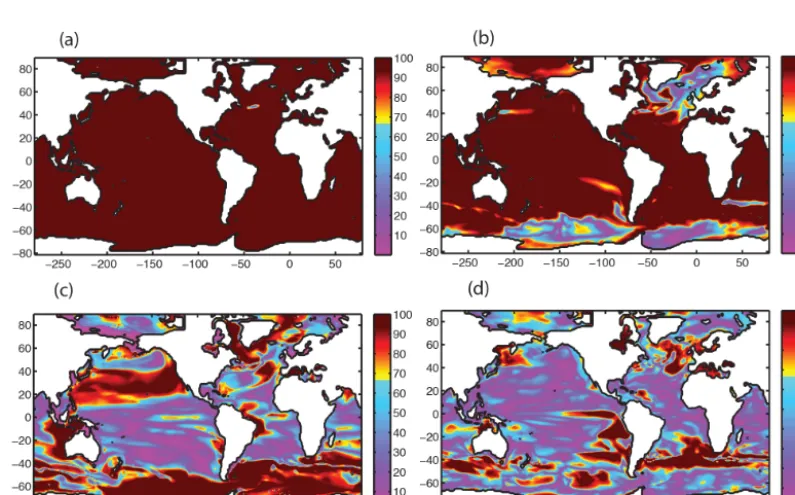
Figure 2. Confidence interval maps averaged over 2005–2014 for (a)arag, (b) SST, (c) O2inventories, and (d) NPP. For each case, a 30-year window has been used to calculated trends gridpoint by gridpoint for each 30-year between 2005 and 2014. An average over 10 30-years was considered to remove shorter timescale fluctuations in the signal-to-noise ratio. Note that the color scheme here is chosen such that saturation occurs (maroon color) above the 67 % confidence interval. Warm colors indicate confidence intervals ranging from 67–100 % (more than one standard deviation), and cool colors span the range 0–67 % (less than 1 standard deviation).
[image:5.612.99.497.387.634.2]that changes in surface aragare mainly dictated by the in-crease in surfacepCO2, which closely follows atmospheric
pCO2 trends (e.g., Keller et al., 2014). For SST (Fig. 2b), 74.8 % of the global surface ocean has emerged with 67 % certainty from the noise. In particular the lower latitudes tend to have emerged with high confidence by 2005–2014, whereas the Southern Ocean south of 45◦S and the northern subpolar and Arctic regions reveal relatively little confidence of emergence by 2005–2014. For O2 inventories, 22.6 % of the global ocean has emerged with 67 % certainty from the noise (Fig. 2c). For NPP, only 14.8 % of the global ocean has emerged with 67 % certainty over 2005–2014 (Fig. 2d). In-terestingly, the pattern for the O2inventories shown in Fig. 2c reveals emergence over important parts of the Pacific and At-lantic sectors of the Southern Ocean (defined as the region to the south of 45◦S), in contrast to what is seen in SST. The
lower latitudes reveal relatively little emergence by 2005– 2014, but there are small areas within the subtropics of the North Pacific with emergence. For the case of NPP (Fig. 2d), there is very little evidence of emergence by 2005–2014 over most of the global domain, although the equatorial Pacific cold tongue regions, parts of the equatorial Atlantic, and the Agulhas regions show marginal emergence. This indicates that even with complete 30-year time series for global NPP, it would not be possible in most regions to identify a significant secular trend.
Next we consider in Fig. 3 the confidence intervals calcu-lated over 2075–2084. The patterns shown in Fig. 3 largely reinforce what was seen in Fig. 2, although clearly the emergent structures have expanded. Not surprisingly, arag (Fig. 3a) now stands emerged over 100 % of the global sur-face area with 67 % certainty at the end of the 21st century, consistent with what was shown over 2005–2014. For SST (Fig. 3b), 90.9 % of the global ocean has emerged with 67 % certainty, clearly having expanded beyond the limits from 2005–2014. This includes expansion into the North Atlantic, and the high latitudes over the Southern Ocean. For O2 inven-tories (Fig. 3c), with 42.3 % of the globe has emerged with 67 % certainty, the Southern Ocean shows an increasing trend towards emergence at the end of the century, and the North Pacific subtropics have emerged with high confidence. For the case of NPP (Fig. 3d), with 23.7 % of the globe emerged with 67 % certainty, there continues to be only weak emer-gence over most of the globe, the exceptions being a coher-ent structure spanning the southern subtropics and subtropi-cal front regions of the southern Indian Ocean, the equatorial Pacific upwelling region, and then patchy regions over the Southern Ocean, the eastern mid-latitude and subpolar North Atlantic.
Taken together, the results here indicate that the four drivers are not advancing in unison with the same patterns and rates of their detectability over the globe.aragemerges first, consistent with what has been found in previous mod-eling studies (Friedrich et al., 2012), NPP emerges last, and then O2inventories and SST have their own contrasting
pat-terns of emergence. Stated differently, random uncertainty associated with natural decadal variability poses significantly more important challenges to secular trend detection for NPP than forarag, with O2inventories and SST falling between NPP andarag.
3.3 Local emergence confidence intervals for the multi-driver mean
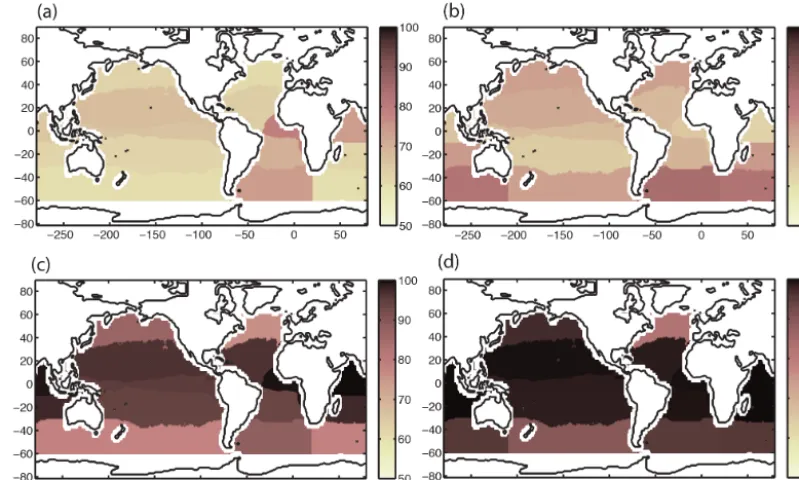
We now consider an average across the four ecosystem drivers of the confidence intervals for the same time inter-vals 2005–2014 (Fig. 4a) and 2075–2084 (Fig. 4b). To facil-itate presentation and interpretation, we calculated averages within 14 static biomes as defined by Henson et al. (2010). The biome definition separates the regions where phyto-plankton growth is seasonally light limited (for mid to high latitudes), regions where the ocean is gaining heat (equatorial regions) and oligotrophic regions.
For the 2005–2014 interval (Fig. 4a), the multi-driver con-fidence intervals have already risen above the threshold of 1 standard deviation (67 % confidence interval) in the equato-rial Atlantic, the South Atlantic, and the Arabian Sea. The Indian and Pacific sectors of the Southern Ocean weigh in at 60 % confidence intervals, thereby below 1 standard devia-tion. With the exception of the South Atlantic, subpolar re-gions are minimum rere-gions for confidence intervals. For the case of the equatorial Atlantic, where in fact O2inventories are increasing (Gnanadesikan et al., 2012; Cocco et al., 2013) (Fig. A1e), it is important to acknowledge that emergent O2 inventories are thereby not to be understood as a driver. In-terestingly, the hemispheric asymmetry between the northern and southern subtropics of the Pacific is the reverse of the asymmetry found in the Atlantic.
K. B. Rodgers et al.: Emergence of multiple ocean ecosystem drivers 3307
Figure 4. Confidence intervals for two 10-year intervals, namely 2005–2014 (left column), and 2075–2084 (right column). The confidence intervals for (a) the four drivers (arag, SST, O2inventories, and NPP) over 2005–2014 are taken as the average over the fields shown in Fig. 2, and (b) the confidence intervals shown for the four drivers over 2075–2084 are taken as the average of the fields shown in Fig. 3. This is then considered for the case of the dominant two drivers in (c) for the period 2005–2014, and in (d) for the period 2075–2084. Finally, the confidence intervals averaged for the dominant two drivers are shown in (e) over 2005–2014 and (f) over 2075–2084.
gridpoint. Subsequently, area-weighted spatial averages were considered. For the earlier period (2005–2014), 40.9 % of the global ocean exhibits emergence with 67 % confidence. By 2075–2084, 62.5 % of the global ocean exhibits emergence with 67 % confidence.
Next we consider the emergence characteristics for the two drivers with highest emergence confidence intervals (rather than all four drivers) in the subsequent two panels. This is shown for the time interval 2005–2014 in Fig. 4c, and for the time intervals 2075–2084 in Fig. 4d. For each case, the fields presented in Figs. 2 and 3 were considered gridpoint by gridpoint to find the two maximum drivers, and these were then averaged over the same biome regions. As is revealed in the structures of locally maximum and minimum confidence intervals, the dominant influences over most of the global ocean are arag and SST in setting the even higher confi-dence intervals. For the time interval 2005–2014, 97.94 % of the global ocean is above the 67 % confidence interval. For the time interval 2075–2084, this has risen to 99.92 % of the global ocean having risen above the 67 % confidence inter-val.
Taken together, the four panels in Fig. 4 reveal a strong sensitivity to the number of drivers used to characterize multiple-driver emergence. For the case of emergence over 2075–2084, it is interesting to note that the patterns are dif-ferent. For four drivers, the Southern Ocean has the strongest
emergence, whereas with two drivers the equatorial band has the strongest emergence.
3.4 Sensitivity of confidence intervals to length of decadal trend window
Next we consider the sensitivity of our confidence interval calculation for the period 2005–2014 (Fig. 2) to the length of the window over which trends are calculated. The sensitiv-ity of the confidence intervals over 2005–2014 to the width of the window is considered in Fig. 5, where a window of 10 years has been used instead of the 30-year window used in Fig. 2. We show that for all four drivers, the choice of a 10-year trend window results in important decreases in the confidence intervals for emergence over the global domain relative to a 30-year trend window.
Figure 5. The confidence intervals for emergence of each of the drivers for the time period 2005–2014, using a 10-year window for calculating trends. The analysis here is otherwise identical to that shown in Fig. 2, except that there a 30-year window was chosen. The panels show the distributions for (a)arag, (b) SST, (c) O2inventories, and (d) NPP. This analysis reveals significantly lower confidence intervals for the 10-year window than for the 30-year window for each of the four drivers.
For SST as well, the pattern obtained with a 10-year win-dow (Fig. 5b) reveals large differences from the pattern ob-tained with a 30-year window (Fig. 2b). The relatively ele-vated values throughout much of the equatorial regions and the subtropics for the case of a 30-year window have now disappeared for the case of a 10-year window, revealing rela-tively weak confidence intervals over global domain. A sim-ilar loss of confidence is found for O2inventories (Fig. 5c) and for NPP (Fig. 5d). In fact for SST, O2inventories, and NPP, using a 10-year window results in very weak confidence nearly everywhere over the global domain.
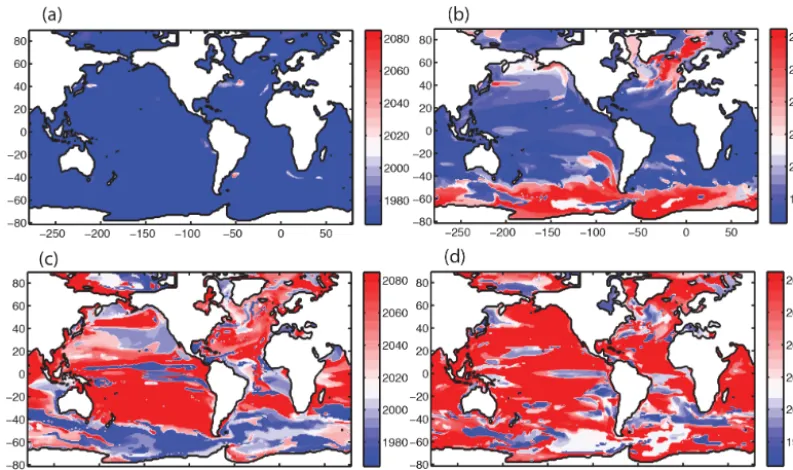
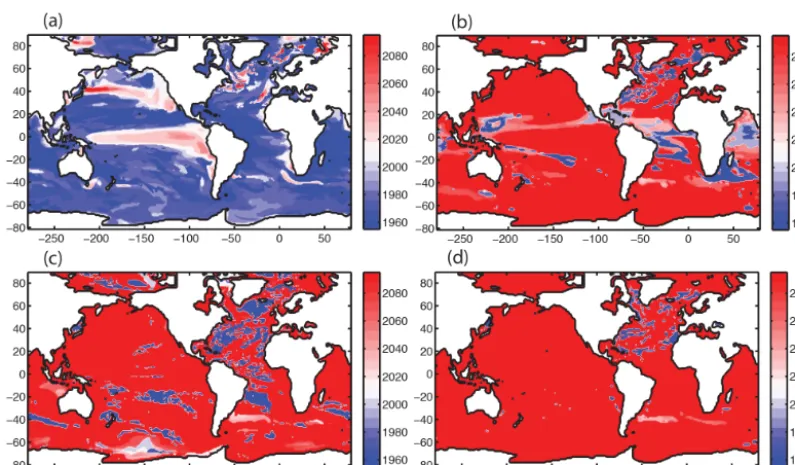
3.5 Time of emergence in individual ecosystem drivers Next we consider time of emergence (ToE) in Fig. 6. Here, we use a 1-standard-deviation threshold to define ToE, and our intention is to represent another dimension to the emer-gence question, namely that of time. A 10-year tolerance window with a robust Loess filter has been applied to the fields in Fig. 6, as described in Appendix B. We begin with a consideration of arag (Fig. 6a), which reveals that most of the emergence has already occurred by the start of the analysis period (before 1965), consistent with what was seen in the confidence interval analysis. The only exceptions are relatively high dynamical variability zone within the equato-rial Pacific, and certain high variability structures associated with western boundary current regions. For SST (Fig. 6b), the ToE is within the 20th century for much of the equatorial band, with a tendency for this ToE to shift to the 21st
cen-tury for much of the subtropical and subpolar regions. For much of the high-latitude Southern Ocean region, there is no emergence during the analysis period (before 2085). This is also true for important sectors of the northern North Atlantic. For O2inventories (Fig. 6c) an early ToE is evident for the Southern Ocean as well as the eastern equatorial Atlantic, largely consistent with what was seen in Fig. 2. Alternating zonal structures of early and late ToE are seen in the equa-torial Pacific, and a patchwork of structures with very differ-ent ToE is in evidence over much of the ocean away from the Southern Ocean. In fact, the patchwork-like structures are in even stronger evidence for NPP (Fig. 6d). Consistent with what was seen in Fig. 2d, relatively early ToE is in ev-idence for both the Agulhas and the equatorial Pacific cold tongue regions. Otherwise there are alternating bands of sat-uration for both early (pre-1965) and late (post-2085) ToE. The adjacent early and late saturation regions are the conse-quence of choosing a threshold for ToE. Thus the boundaries between such regions may not in general be reflecting real biome structures in the model domain. This is addressed in more detail in the Appendix (Figs. A3 and A4).
4 Discussion
4.1 Interpretation of main results
K. B. Rodgers et al.: Emergence of multiple ocean ecosystem drivers 3309
Figure 6. Time of emergence (ToE), calculated using a threshold of 1 standard deviation (67 % confidence) for (a)arag, (b) SST, (c) O2inventories, and (d) NPP. The color scheme has been chosen to distinguish between relative to the present (2014) with shades of blue indicating a ToE post-2014 and shades of red indicating a ToE pre-2014.
NPP) of marine ecosystems, with two questions driving this investigation. The first motivation stems from an interest in identifying when the secular trend in drivers becomes ev-ident or perceptible for an observer relative to the natu-ral background decadal variability. This is precisely what large initial-condition ensemble simulations with Earth sys-tem models can provide, and it is our intention that this will add value to more ambitious efforts to identify when the secular trend becomes a perceptible change that can stress ecosystems. Identifying perceptible change for an observer is a necessary but not sufficient condition for identifying per-ceptible change for an ecosystem, as is evident for example in the fact that many organisms are not sensitive to O2 con-centrations until they fall below a particular threshold (e.g., Vaquer-Sunyer and Duarte, 2008).
The second motivation pertains to the optimization of the ocean biogeochemical observing system, and the application of models to advance this optimization through iterative com-munication with the community of researchers evaluating network design. Building on the previous work of Frölicher et al. (2009), this was pursued using a suite of large initial-condition ensemble simulations, as it is only with this ap-proach that one can infer the secular trend (ensemble mean) for a model by filtering natural variability through an averag-ing procedure. The averagaverag-ing procedure operates on not only patterns of climate modes such as ENSO (Wittenberg et al., 2014), but also on natural variability on smaller scales associ-ated with variations in gyre boundaries that are not correlassoci-ated to climate modes. Importantly, with this large ensemble
ap-proach, one does not need to assume that variability in the system is stationary in time.
Our main result is that there is a temporal hierarchy in the emergence of the four ocean ecosystem drivers above the level of background natural variability. This is strongly ev-ident in Fig. 1.arag emerges earliest, NPP emerges latest, and both O2inventories and SST fall between the two. Ad-ditionally, three (SST, O2inventories, and NPP) of the four drivers considered here exhibit large regions where detection of secular trends is significantly complicated by the presence of natural decadal variability in the climate system. Our re-sults also revealed very pronounced differences in the pat-terns for the confidence intervals for the emergence of SST and O2 inventories (Fig. 2). For SST, the Southern Ocean emerges relatively late (post-2014) and the equatorial region emerges rather early (pre-2014), in line with earlier studies (Mora et al., 2013). For O2 inventories, on the other hand, the Pacific and Atlantic sectors of the Southern Ocean ex-hibit regions of relatively early emergence (pre-2014) and the equatorial region emerges rather late (post-2014). The coalescence of the different global drivers in certain regions is already creating a number of hot spots (Fig. 4), with the Southern Ocean and more generally the high latitudes pro-jected to increase in importance by 2075–2084.
reasons. First, for the four ecosystem drivers the saturation characteristics of the ToE analysis (emergence before 1965 or after 2085) are widespread, complicating interpretation. Second, and perhaps more importantly, ToE diagnostics re-quire a specification of a threshold of signal to noise that is somewhat arbitrary (here we have considered both 1 and 2 standard deviations, but have chosen to emphasize the less conservative value of 1 in Fig. 6).
The quantification of signal to noise at the center of our analysis relies on a suite of large initial-condition ensemble simulations using an individual Earth system model (GFDL’s ESM2M). However, previously published analyses indicate that the collection of Earth system models developed by dif-ferent modeling centers exhibit disparate amplitudes for the secular trends in individual drivers (Bopp et al., 2013). For example, different ESMs are likely to differ more in their projected changes in NPP than they are inaragor SST, since at least witharagor SST the ESMs are largely consistent in the sign of their response (Bopp et al., 2013, Steinacher et al., 2010, Cocco et al., 2013). In high latitudes, ESMs are generally consistent in simulating decreasing ocean O2 in-ventories under 21st century climate change (Cocco et al., 2013). However, it is worth noting that in GFDL ESM2M global NPP changes by only 2 % under the historical/RCP8.5 scenario, whereas global NPP tends to decrease by approx-imately 7 % for a multi-model of CMIP5 ESMs under the same scenario (Laufkötter et al., 2015). Additionally, differ-ent Earth system models exhibit differdiffer-ent noise or underly-ing natural variability characteristics for individual drivers (Keller et al., 2014). Such inter-model differences strongly suggest that the temporal and spatial characteristics of emer-gence should be model-dependent, as has been shown for the case of surface air temperature by Hawkins and Sut-ton (2011). Alternative emissions scenarios may also lead to changes in both the signal and the noise. An investigation of the sensitivity of our results to alternative scenarios for an-thropogenic emissions and other model projections is left as a subject for future investigation.
4.2 Mechanistic interpretation
Although our analysis has been focused on statistical ques-tions (namely confidence intervals and time of emergence di-agnostics), it is also important to consider the mechanisms that control emergence timescales. The most important con-trast seen in our results is in evidence in Fig. 2, namely the early (late) emergence of SST in the equatorial band (South-ern Ocean), and the late (early) emergence of O2 invento-ries in the equatorial band (Southern Ocean) with the 30-year window. For SST, the contrast between the equatorial band and the Southern Ocean in Fig. 2 identified with a 30-year window is largely reflecting the small amplitude of the SST trend over the Southern Ocean relative to the equatorial band. In fact, the contrast between the tropics and the South-ern Ocean is more generally representative of most of the rest
of the global surface ocean (except in the northern North At-lantic) relative to the Southern Ocean (Fig. A1c). The lack of SST warming reflects large-scale interhemispheric asymme-tries in the mean ocean circulation. The strong upwelling in the Southern Ocean nearly anchors sea surface temperature at pre-industrial level (Stouffer et al., 1989; Marshall and Speer, 2012; Frölicher et al., 2015) under transient global warming. For the equatorial band, the secular trend is sufficiently large over a 30-year window to be more important than the natural decadal variability, but consistent with the spectral characteristics of ENSO for the underlying physical model (Wittenberg, 2009). This is no longer true for the case of a 10-year window in the equatorial band. For the case of O2 inventories, the reverse holds. In the Southern Ocean, deoxy-genation is much larger than natural variability due to the stratification-induced reduced supply of O2from the surface into the ocean interior acting in conjunction with solubility-driven O2increases (Frölicher et al, 2009; Gnanadesikan et al., 2012). In contrast, almost no O2 changes are projected to occur in the low O2 regions of the equatorial and sub-tropical thermocline. This is due to the fact that reduced biological production and export of organic matter in the overlying near-surface waters are then associated with re-duced O2demand in the ocean interior (Gnanadesikan et al., 2012; Steinacher et al., 2010), which is nearly compensated by solubility- and ventilation-driven O2changes there. How-ever, the confidence of the O2projections in the low latitudes may be deemed to be low, as the GFDL ESM2M has bi-ases in its representation of today’s observed O2distribution (Gnanadesikan et al., 2012), a feature nevertheless common to the current generation of Earth system models (Cocco et al., 2013). What is clear, however, is that anthropogenic CO2 emissions to the atmosphere are the common driver of the perturbations considered here, and this underscores the nec-essary of a single policy response (reduction in emissions). Substantial mitigation efforts are required if ocean ecosys-tems are to be spared from the “quadruple whammy” of the drivers considered here.
4.3 Perceptible changes in ocean drivers for an observer
K. B. Rodgers et al.: Emergence of multiple ocean ecosystem drivers 3311 with previous studies that argue that coral reefs are the
ma-rine ecosystems that are threatened most by environmental changes (see the cross-chapter box on coral reefs in the Fifth Assessment Report on the Intergovernmental Panel on Cli-mate Change (IPCC AR5), Gatusso et al, 2014a, b), if we equate drivers and stressors for the case of arag and SST for tropical coral reef habitats. Although the results of the two-driver analysis are seen to hold through the tropics, the results may warrant particular attention in the Coral Trian-gle biodiversity hotspot region that is thought to account for more than 75 % of the world’s coral species (Veron et al., 2009), spanning Indonesia, the Philippines, Malaysia, Papua New Guinea, and the Solomon Islands (Allen, 2008).
It is important however to emphasize that the analyses for multiple drivers seen in Fig. 4 consisted of averaging of con-fidence intervals obtained for the individual drivers. In in-terpreting these results for SST and arag in the Coral Tri-angle region as the confidence intervals for the impacts of multiple drivers, it remains a scientific challenge to assess whether they are in fact acting additively, synergistically, or antagonistically in their impact (Boldt et al., 2014, and refer-ences therein). To date resource management strategies have tended to focus on the impact of individual drivers, with lit-tle consideration or attention to potential relationships and feedbacks between the drivers. Addressing these questions is beyond the scope of our study, but it is our hope that the analysis considered here will contribute to motivating future work in this direction.
4.4 Implications for observing system design
It is also important to consider the implications of our study for optimization of the global ocean observing system. With this goal in mind, our study can be considered as an observ-ing system simulation experiment (OSSE). With an OSSE, one considers a model to be an analog for the real ocean, for which one has the fully resolved state evolution of the system. Earlier ocean OSSEs (Christian et al., 2008; Park et al., 2010; Plancherel et al., 2013; Majkut et al., 2014; Cassar et al., 2014) have tended to focus on one realization of the evolution of the Earth system, and focused on the skill with which different observing strategies can reproduce trends and variability in the ocean through selective sub-sampling of the model output. The target is to test the available skill in repro-ducing the real-world trends and variability with an incom-plete observing system, without any claim to separating the signal associated with the secular trend and natural variabil-ity.
For our experimental configuration considered as an OSSE, we address a different but complementary question. We consider the case where the observing system has per-fect skill in reproducing the trends and variability on all timescales of the system of interest, but where the target is to identify the secular trend. It is precisely this deconvolu-tion that we address with the large initial-condideconvolu-tion
simula-tions with the Earth system model, thereby building on the previous analyses considered with fewer ensemble members (Frölicher et al, 2009; Christian, 2014). The question is then as follows: given an observing system with perfect skill that allows one to perfectly monitor the evolution of the system, how many years of continuous measurements are needed to identify the secular trend above the noise of background vari-ability?
Viewed in this way, our main results point to the im-portance of maintaining a sustained multi-decadal observ-ing system for ocean biogeochemistry and ecosystem drivers. For the four drivers considered here, the confidence intervals found with a 30-year window for calculating trends (Fig. 2) are significantly higher than those found with a 10-year win-dow (Fig. 5). For the case with a 10-year winwin-dow, evenarag reveals broad expanses of non-emergence over the decade 2005–2014. This is in evidence, for example, over important parts of the Coral Triangle biodiversity hot spot spanning the Indo-Pacific warm pool region, as well as for the North At-lantic. This underscores the potential importance of sustained multi-decadal continuous measurements in order to identify the rate of acidification associated with the secular trend in these regions.
More generally, our analysis of confidence intervals for emergence for two versus four drivers (Fig. 4c for the pe-riod 2005–2014) largely highlight the combined effects of
aragand SST in the equatorial band. This implies that even with high resolution of temporal and spatial scales, a sus-tained multi-decadal (30-year) observing system of the type considered by Ishii et al. (2009) in western equatorial Pacific surface waters is needed to detect the rate of the secular trend in acidification against the background noise of natural vari-ability with confidence.
5 Conclusions
Here we have considered a suite of large initial-condition ensemble simulations with GFDL’s Earth system model ESM2M to evaluate the emergence characteristics of four drivers of ocean ecosystems under anthropogenic climate change. The drivers chosen werearag, SST, upper-ocean in-ventories of O2, and net primary productivity (NPP). There were two questions underlying the analysis: first, when and where will changes in ecosystem drivers become perceptible to an observer? Second, what are the implications for optimal design of a global observing system for the four drivers?
emer-gence, but opposing patterns between the two of them. SST emerges earlier in the low latitudes and later in the high lat-itudes, while O2 inventories exhibit earlier emergence over high latitude regions than in the tropics. We also considered a multiple-driver analysis where we combined the four individ-ual drivers. There we found that whereas 41 % of the global ocean area exhibits emergence over 2005–2014, 63 % has ex-hibited emergence by 2075–2084. This four-driver analysis reveals a more pronounced emergence pattern over the extra-tropics than over the extra-tropics. We additionally considered the multiple-driver case where we included only two drivers by biome region, with very different results. There the tropics emerge earliest, with the dominant drivers being aragand SST. Given thataragand SST are the two most important drivers for coral reef ecosystems, this analysis identifies coral reefs as being especially vulnerable under 21st century cli-mate change.
K. B. Rodgers et al.: Emergence of multiple ocean ecosystem drivers 3313 Appendix A: Secular trends and natural variability
underlying signal-to-noise analysis
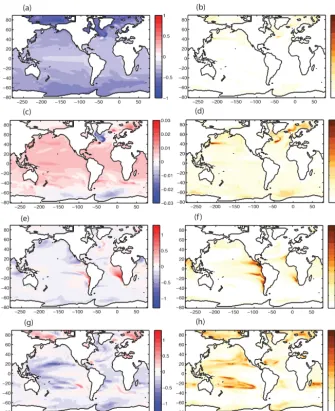
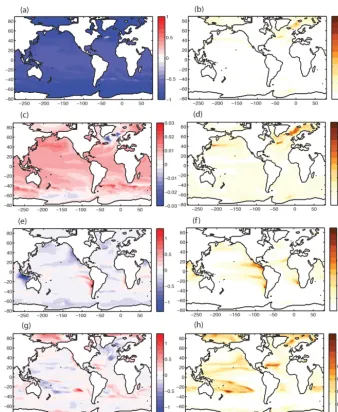
We characterize here the secular trends (left columns in Figs. A1 and A2; referred below as TREND) and standard deviations of the secular trends (right columns in Figs. A1 and A2; referred below as NOISE) separately. Recall that the signal-to-noise ratio is defined as the ratio of these two fields. arag decreases everywhere over the global domain (Fig. A1a), with minimum relative rates of decrease in the equatorial regions, and a general tendency towards stronger relative rates of decrease at high latitudes. The largest NOISE amplitude of aragis seen in a number of dynamically ac-tive regions, including the margins of the subtropical gyres and the equatorial Pacific. However, with the exception of a few isolated regions, the TREND is everywhere signifi-cantly larger than the NOISE forarag. For SST, the TREND over 2005–2014 is positive (warming) over most of the globe, with the notable exception of the western subpolar North At-lantic and large expanses of the Southern Ocean (cooling). This stands in contrast toarag, where the trend had the same sign over the entire domain.
The NOISE for SST finds largest expression in the sub-polar regions of the Northern Hemisphere and over parts of the Southern Ocean. In fact it can be seen in the Fig. 1c, d that the extratropical regions of weak or negative TREND in SST are associated with enhanced variability. The tropics, on the other hand, reveal only modest NOISE amplitude relative to the TREND. Taken together, this helps to account for the fact that the confidence interval map in Fig. 2b reveals high confidence in the tropics relative to the subpolar regions. As has been stated in the main text, it may seem somewhat sur-prising that the signal-to-noise ratio is relatively elevated in the equatorial Pacific, given that this is the region of largest natural variability in the climate system. It is important to emphasize here that we are considering trends over a 30-year interval in our quantification of NOISE rather than consider-ing the standard deviation associated with interannual vari-ability for each of the drivers.
For the case of O2inventories, a decreasing TREND can be seen in the well-ventilated ocean interior of the high lat-itudes. Within the tropics and subtropics, structures of posi-tive trend do occur. As with SST but in contrast witharag, the sign of the ensemble-mean response of O2inventories is not of the same sign everywhere. However, there are also pro-nounced structures of larger NOISE in O2inventories, which over many regions are associated with decadal variations in gyre boundaries and frontal regions. The most prominent ex-tended region where the TREND is larger than the NOISE is over a broad expanse of the Pacific and Atlantic sectors of the Southern Ocean (as seen in Fig. 2c).
For the case of net primary productivity (NPP), both the TREND and the NOISE patterns show relatively narrowly defined but large-amplitude structures. There is a trend in the zonal gradient in NPP across the equatorial Pacific, as well as
a trend towards enhanced NPP along the poleward flanks of the Southern Hemisphere subtropical gyres. For the NOISE, a series of relatively narrow structures of high amplitude are found winding through the tropics. Over most regions of the globe, the NOISE is of sufficient amplitude relative to TREND to give the consistently lowest confidence interval distribution of the four drivers considered here (Fig. 2d).
It is worth noting in Fig. A1 that the unforced components (right column) of the four drivers exhibit large-scale spatial coherence rather than small grid-scale noise. However, these structures are distinct for each of the drivers.
The same fields for the time interval 2075–2084 are con-sidered in Fig. A2. The amplitudes in TRENDS have in-creased in general, but important elements of the TREND structures are similar as for the earlier period. The structures of the NOISE are quite similar to those found for the equiva-lent drivers during the earlier period. However, the amplitude of the variations is in many cases different for 2075–2084 than for 2005–2014. This indicates that the amplitude of the background natural variability is not stationary. For the case of SST and O2, the standard deviation of natural decadal vari-ations decreases over the Southern Ocean.
Appendix B: Temporal filtering and trend detection The task of calculating time of emergence (ToE) in Fig. 6 is complicated by the fact that the signal-to-noise ratio (SNR) in time series for individual grid points in the ocean model does not in general tend to be monotonically increasing over the period 1950–2100. Rather, the evolution of the SNR can reflect that for this particular diagnostic, the 30 ensemble members may not be sufficient to eliminate noise when aver-aged.
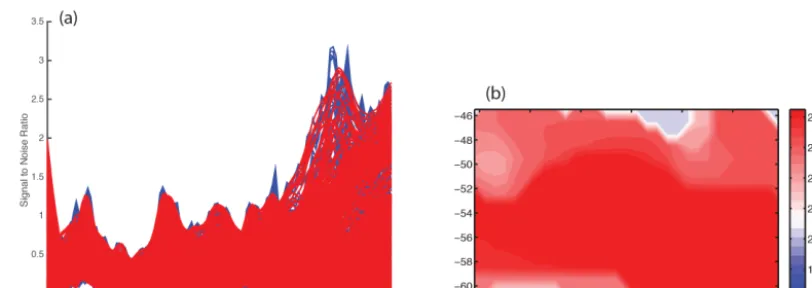
As an illustration of this problem, we consider in Fig. A3 the evolution of the SNR for sea surface temperature a re-gion in the Pacific sector of the Southern Ocean bounded by 130–100◦W and 45–60◦S. The time series of the SNR for the various points in this region are superposed in Fig. A3a. The non-monotonic nature of the increase in SNR through time is evident. With this unfiltered SNR calculated directly from the annual mean model output, there are relatively short timescale excursions above the 2-standard-deviation thresh-old that precede by a number of decades the more permanent crossing of the 1-standard-deviation threshold. However, this does not occur for all of the grid points in the domain of in-terest. As a consequence of these early excursions above the 1-standard-deviation threshold, the spatial pattern of ToE us-ing a strict definition of first crossus-ing (Fig. A3b) reveals a spatial pattern that has a ToE before 2014 (present time) over more than 50 % of the region.
Figure A1. Linear trends (left) and standard deviations of the linear trends (right) for (a, b)arag(c, d)SST (e, f) O2inventories from 100 to 600 m, and (g, h) net primary production averaged over 2005–2014. All fields are calculated using 30-year trend windows, and the trends are shown in units of %/year.
evaluate this, we apply to the full suite of time series shown in Fig. A3a (gridpoint-by-gridpoint SNR for SST) a robust Loess filter. We have chosen to use a 10-year tolerance win-dow with the robust Loess filter, with this serving effectively as a low-pass filter that is obtained using 10-year local re-gressions over the entire time period for each individual grid-point. The result of applying the robust Loess filter is shown in Fig. A4a, where the filtered time series are shown as red lines overlaying the full time series shown in blue. The fil-tered time series are seen to behave as low-pass filters that effectively remove the higher frequency components. When these smoothed time series are used to define ToE with the same 2-standard-deviation threshold, the resulting pattern (Fig. A4b) reveals important differences relative to the un-filtered time series. The structures with post-2014 ToE now
occupy most of the domain. This indicates the strong sensi-tivity of the spatial pattern of ToE to the time-filtering of the SNR time series.
K. B. Rodgers et al.: Emergence of multiple ocean ecosystem drivers 3315
Figure A2. Linear trends (left) and standard deviations of the linear trends (right) for (a, b)arag(c, d) SST (e, f) O2inventories from 100–600 m, and (g, h) net primary production averaged over 2075–2084. All fields are calculated using 30-year trend windows, and the trends are shown in units of %/year.
three of the drivers (post-2085 emergence) are much more difficult to interpret than the parallel and favored analysis with confidence intervals.
We also consider the sensitivity of the time of emergence (ToE) to the width of the tolerance window used for the ro-bust Loess filter in Fig. A6a. For each case, the sensitivity of the ToE to the width of the tolerance window (described above) is considered for each of the four drivers. For each case, the area-weighted global mean sensitivity is consid-ered. The sensitivity is weak for arag, with the dynamic range of the sensitivity being only a few year as the toler-ance window is modified from 5 to 25 years. The sensitivity is largest for O2 inventories, with a decrease of the ToE of 80 years as one transitions from a 5-year to a 25-year toler-ance window. This strong sensitivity is likely the expression
of the red spectrum of modes of variability in thermocline depth impacting O2inventories in their temporal variability. The sensitivities of SST and NPP are quite similar, both be-ing approximately 50 % of the amplitude of the sensitivity seen for O2inventories. In fact, the sensitivity of NPP should be expected to be larger than that of SST, given that the sen-sitivity shown here may be obscured by the saturation char-acteristics of NPP.
Year
1980 2000 2020 2040 2060 2080
Signal to Noise Ratio
0 0.5 1 1.5 2 2.5 3 3.5
−130 −125 −120 −115 −110 −105 −60
−58 −56 −54 −52 −50 −48 −46
1980 2000 2020 2040 2060 2080
(a)
[image:16.612.98.498.64.222.2](b)
Figure A3. Time of emergence of SST considered for a boxed region of the Pacific sector of the Southern Ocean (130–100◦W and 45–60◦S). The SNR calculated individually using annual mean SST for each gridpoint in the domain is shown in panel (a), where a 30-year window is used to calculated TREND and NOISE. Short timescale excursions of less than 10 years are in evidence in modulations of maximum SNR. The spatial pattern of ToE for SST over this region is shown in panel (b). A ToE before the present time (pre-2014) is indicated by shades of blue, while a later ToE is indicated with shades of red. Saturation (ToE post-2085) is represented with a deep red color.
Figure A4. The ToE is considered for the same region, but this time with application of a robust Loess filter with a tolerance window of 10 years applied to the SNR of SST calculated for the individual surface grid points in the domain. The SNR after application of the robust Loess filter is shown in panel (a) in red, superposed over the same blue time series considered in Fig. A3a. The filtering effect on the short timescale maximum excursions of the SNR is evident. The net effect over the full domain of the robust Loess filter is shown in panel (b), revealing a later ToE over significant portions of the region of interest. A ToE before the present time (pre-2014) is indicated by shades of blue, while a later ToE is indicated with shades of red.
[image:16.612.93.499.304.448.2]K. B. Rodgers et al.: Emergence of multiple ocean ecosystem drivers 3317
Figure A5. The time of emergence (ToE) for each of the four drivers has been calculated using a 10-year window for the calculation of trends, considering the time interval 1955–2095. Time of emergence (ToE), calculated using a threshold of 1 standard deviation (67 % confidence) for (a)arag, (b) SST, (c) O2inventories over 100–600 m and (d) NPP. The color scheme has been chosen to distinguish between relative to the present (2014) with shades of blue indicating a ToE post-2014 and shades of red indicating a ToE pre-2014. This is the complement to the results with ToE for a 30-year window, shown in Fig. 6.
Tolerance Window (Years)
5 10 15 20 25
Average Difference
-25 -20 -15 -10 -5 0 5 10 15 20 25
SST O2 PP
arag Ω
Threshold (Std)
0.8 1 1.2 1.4 1.6 1.8 2
Average Difference
-15 -10 -5 0 5 10 15 20 25 30 35
SST O2 PP
arag Ω
(a) (b)
[image:17.612.107.494.502.630.2]Acknowledgements. First and foremost, we would like to thank the two anonymous reviewers and the editor (J.-P. Gatusso) for their constructive comments and criticisms. The contri-bution of K. B. Rodgers came through awards NA17RJ2612 and NA08OAR4320752, which includes support through the NOAA Office of Climate Observations (OCO), and NOAA award NA11OAR4310066. Support for K. B. Rodgers was also provided through NASA award NNX14AL85G. The statements, findings, conclusions, and recommendations are those of the authors and do not necessarily reflect the views of NOAA or the US Department of Commerce. T. L. Frölicher acknowledges financial support from the SNSF (Ambizione grant PZ00P2_142573). J. Lin’s work in a sum-mer internship was supported through the Princeton Environmental Institute (PEI). The authors would like to thank John Dunne at GFDL for his contributions with model development and for access to computing resources. We would also like to thank Joe Majkut, Brendan Carter, Niki Gruber, Jorge Sarmiento, Richard Slater, Paul Yi, and Sarah Schlunegger for fruitful discussions.
Edited by: J.-P. Gattuso
References
Allen, G. R.: Conservation hotspots of biodiversity and endemism for Indo-Pacific coral reef fishes, Aquatic Conserv. Mar. Freshw. Ecosyst. 18, 541–556, 2008.
Anderson, J. L., Balaji, V., Broccoli, A. J., Cooke W. F., Delworth, T. L. Dixon, K. W., Donner L. J., Dunne, K. A. Freidenreich, S. M., Garner, S. T., Gudgel, R. G., Gordon, C. T. Held, I. M. Hem-ler, R. S. Horowitz, L. W., Klein, S. A., Knutson, T. R., Kush-ner P. J. Langenhost A. R., Lau, N.-C., Liang, Z., Malyshev, S. L., Milly P. C. D., Nath, M. J., Ploshay, J. J., Ramaswamy V., Schwarzkopf, M. D., Shevliakova, E., Sirutis, J. J., Soden, B. J., Stern, W. F., Thompson, L. A., Wilson, R. J., Wittenberg, A. T. Wyman, B. L.: The new GFDL global atmosphere and land model AM2-LM2: Evaluation with prescribed SST simulations, J. Climate, 17, 4641–4673, 2004.
Boldt, J. L., Martone, R., Samhouri, J., Perry, R. I., Itoh, S., Chung, I. K., Takahashi, M., and Yoshie, N.: Developing ecosystem in-dicators for responses to multiple stressors, Oceanography 27, 116–133, 2014.
Bopp, L., Monfray, P., Aumont, O., Dufresne, J.L., Le Treut, H., Madec, G., Terray, L., and Orr, J. C.: Potential impact of climate change on marine export production, Global Biogeochem. Cy., 15, 81–99, 2001.
Bopp, L., Resplandy, L., Orr, J. C., Doney, S. C., Dunne, J. P., Gehlen, M., Halloran, P., Heinze, C., Ilyina, T., Séférian, R., Tjiputra, J., and Vichi, M.: Multiple stressors of ocean ecosys-tems in the 21st century: projections with CMIP5 models, Biogeosciences, 10, 6225–6245, doi:10.5194/bg-10-6225-2013, 2013.
Cassar, N., Nevison, C. D., and Manizza, M.: Correcting oceanic O2/AR-net community production estimates for vertical mixing using N2O observations, Geophys. Res. Lett., 41, 8961–8970, 2014.
Christian, J. R.: Timing of the Departure of Ocean Biogeochemi-cal Cycles from the Preindustrial State, PloS ONE, 9, e109820, doi:10.1371/journal.pone.0109820, 2014.
Christian, J. R., Feely, R. A., Ishii, M., Murtugudde, R., and Wang, X.: Testing an ocean carbon model with ob-served sea surface pCO2 and dissolved inorganic carbon in the tropical Pacific Ocean, J. Geophys. Res., 113, C07047, doi:10.1029/2007JC004428, 2008.
Cocco, V., Joos, F., Steinacher, M., Frölicher, T. L., Bopp, L., Dunne, J., Gehlen, M., Heinze, C., Orr, J., Oschlies, A., Schnei-der, B., SegschneiSchnei-der, J., and Tjiputra, J.: Oxygen and indicators of stress for marine life in multi-model global warming projec-tions, Biogeosciences, 10, 1849–1868, doi:10.5194/bg-10-1849-2013, 2013.
Delworth, T. L., Broccoli, A. J., Rosati, A., Stouffer, R. J., Balaji, V., Beesley, J. A., Cooke, W. F., Dixon, K. W., Dunne, J., Dunne, K. A., Durachta, J. W., Findell, K. L., Ginoux, P., Gnanadesikan, A., Gordon, C. T., Griffies, S. M., Gudgel, R., Harrison, M. J., Held, I. M., Hemler, R. S., Horowitz, L. W., Klein, S. A., Knutson, T. R., Kushner, P. J., Langenhorst, A. R., Lee, H.-C., Lin, S.-J., Lu, J., Malyshev, S. L., Milly, P. C. D., Ramaswamy, V., Russell, J., Schwarzkopf, M. D., Shevliakova, E., Sirutis, J. J., Spelman, M. J., Stern, W. F., Winton, M., Wittenberg, A. T., Wyman, B., Zeng, F., and Zhang, R.: GFDL’s CM2 Global Coupled Climate Models. Part I: Formulation and Simulation Characteristics, J. Climate, 19, 643–674, 2006.
Deser, C., Phillips, A. S., Alexander, M. A., and Smoliak, B. V.: Projecting North American Climate over the Next 50 Years: Un-certainty due to Internal Variability, J. Climate, 27, 2271–2296, 2014.
Diffenbaugh, N. S. and Scherer, M.: Observational and model evi-dence of global emergence of permanent, unprecedented heat in the 20th and 21st centuries, Clim. Change, 107, 615–624, 2011. Doney, S. C., Fabry, V. J., Feely, R. A., and Kleypas, J. A.: Ocean
Acidification: The Other CO2Problem, Annu. Rev. Mar. Sci., 1, 169–192, 2009.
Doney, S. C., Ruckelshaus, M., Duffy, J. E., Barry, J. P., Chan, F., English, C. A., Galindo, H. M., Grebmeier, J. M., Hollowed, A. B., Knowlton, N., Polovina, J., Rabalais, N. N. Sydeman, W. J., and Talley, L. D.: Climate change impacts on marine ecosystems, Ann. Rev. Mar. Sci., 4, 11–37, 2012.
Dunne, J. P., Gnanadesikan, A., Sarmiento, J. L., and Slater, R. D.: Technical description of the prototype version (v0) of Tracers of Phytoplankton with Allometric Zooplankton (TOPAZ) ocean biogeochemical model as used in the Princeton IFMIP model, Biogeosciences, 7 (Suppl.), 1–22, doi:10.4195/bg-7-3593-2010, 2010.
Dunne, J. P., John, J. G., Adcroft, A. J., Griffies, S. M., Hallberg, R. W., Shevliakova, E., Stouffer, R. J., Cooke, W., Dunne, K .A., Harrison, M. J., Krasting, J. P., Halyshev, S. L., Milly, P. C. D., Phillipps, P. J., Sentman, L. T, Samuels, B. L., Spelman, M. J., Winton, M., Wittenberg, A. T., and Zadeh, N.: GFDL’s ESM2 Global Coupled Climate-Carbon Earth System Models, Part I: Physical Formulation and Baseline Simulation Characteristics, J. Climate, 25, 6646–6665, 2012.
K. B. Rodgers et al.: Emergence of multiple ocean ecosystem drivers 3319
Emerson, S., Watanabe, Y., Ono, T., and Mecking, S.: Temporal trends in apparent oxygen utilization in the upper pycnocline of the North Pacific: 1980–2000, J. Oceanogr., 60, 139–147, 2004. Friedlingstein, P., Andrew, R. M., Rogelj, J., Peters, G. P., Canadell,
J. G., Knutti, R., Luderer, G., Raupach, M .R., Schaeffer, M., van Vuuren, D. P., Le Quéré, C.: Persistent growth of CO2emissions and implications for reaching climate targets, Natur Geosci., 7, 709–715, 2014.
Friedrich, T., Timmermann, A., Abe-Ouchi, A., Bates, N. R., Chikamoto, M. O., Church, M. J., Dore, J. E., Gledhill, D. K., Gonzalez-Davila, M., Henemann, M., Ilyina, T., Jungclaus, J. H., McLeod, E., Mouchet, A., and Santana-Casiano, J. M.: Detect-ing regional anthropogenic trends in ocean acidification against natural variability, Nat. Clim. Change, 2, 167–171, 2012. Frölicher, T. L, Joos, F., Plattner, G. K., Steinacher, M.,
and Doney, S. C.: Natural variability and anthropogenic trends in oceanic oxygen in a coupled carbon cycle-climate model ensemble, Global Biogeochem. Cy., 23, GB1003, doi:10.1029/2008GB003316, 2009.
Frölicher, T. L., Sarmiento, J. L., Payntner, D. J., Dunne, J. P., Krast-ing, J. P., and Winton, M.: Dominance of the Southern Ocean in Anthropogenic Carbon and Heat Uptake in CMIP5 Models, J. Climate, 28, 862–886, 2015.
Gattuso, J.-P., Hoegh-Guldberg, O., and Pörtner, H.-O.: Coral Reefs, in: Climate Change 2014: Impacts, Adaptation and Vul-nerability. Contribution of Working Group II to the Fifth Assess-ment Report of the IntergovernAssess-mental Panel on Climate Change, edited by: Field, C. B., Barros, V. R., Dokken, D. J., Mach, K. J., Mastrandrea, M. D., Bilir, T. E., Chatterjee, M., Ebi, K. L., Estrada, Y. O., Genova, R. C., Girma, B., Kissel, E. S., Levy, A. N., MacCracken, S., Mastrandrea, P. R., and White, L. L., Cam-bridge, Cambridge University Press, 97–100, 2014a.
Gattuso, J.-P., Brewer, P., Hoegh-Guldberg, O., Kleypas, J.A., Pört-ner, H.-O., and Schmidt, D.: Ocen acidification, in: Climate Change 2014: Impacts, Adaptation and Vulnerability. Contribu-tion of Working Group II to the Fifth Assessment report of the Intergovernmental Panel on Climate Change, edited by: Field, C. B., Barros, V. R., Dokken, D. J., Mach, K. J., Mastrandrea, M. D., Bilir, T. E., Chatterjee, M., Ebi, K. L., Estrada, Y. O., Gen-ova, R. C., Girma, B., Kissel, E. S., Levy, A. N., MacCracken, S., Mastrandrea, P. R., and White, L. L., Cambridge, Cambridge University Press, 129–131, 2014b.
Gnanadesikan, A., Dunne, J. P., and John, J.: Understanding why the volume of suboxic waters does not increase over centuries of global warming in an Earth System Model, Biogeosciences, 9, 1159–1172, doi:10.5194/bg-9-1159-2012, 2012.
Griffies, S. M.: Elements of MOM4p1, GFDL Ocean Group Tech. Rep. 6, 37 pp., available at: http://data1.gfdl.noaa.gov/~arl/ pubrel/o/old/doc/mom4p1_guide.pdf (last access: 16 May 2011), 2009.
Gruber, N.: Warming up, turning sour, losing breath: ocean bio-geochemistry under global change, Phil. Trans. R. Soc. A, 369, 1980–1996, 2011.
Hall, J., Diaz, R. J., Gruber, N., and Wilhelmsson, D.: MANAGING OCEAN ENVIRONMENTS IN A CHANGING Sustainability and Economic, in: Managing ocean environments in a changing climate, edited by: Noone, K. J., Sumaila, U. S., and Diaz, R. J., Elsevier Inc., Burlington, MA, 193–222, 2013.
Hawkins E. and Sutton, R.: The potential to narrow uncertainty in projections of regional precipitation change, Clim. Dyn., 37, 407–418, 2011.
Hawkins, E. and Sutton, R.: Time of emergence of climate signals, Geophys. Res. Lett., 39, L01702, doi:10.1029/2011GL050087, 2012.
Henson, S. A.: Slow science: the value of long ocean biogeochem-istry records, Phil. Trans. R. Soc. A, 372, 1–22, 2014.
Henson, S. A., Sarmiento, J. L., Dunne, J. P., Bopp, L., Lima, I., Doney, S. C., John, J., and Beaulieu, C.: Detection of anthro-pogenic climate change in satellite records of ocean chlorophyll and productivity, Biogeosciences, 7, 621–640, doi:10.5194/bg-7-621-2010, 2010.
Ishii, M., Inoue, H. Y., Midorikawa, T., Saito, S., Tokieda, T., Sasano, D., Nakadate, A., Nemoto, K., Metzl, N., Wong, C. S., and Feely, R. A.: Spatial variability and decadal trend of the oceanic CO2in the western equatorial Pacific warm/fresh water, Deep-Sea Res. II, 56, 591–606, 2009.
Keeling, R. F., Koertzinger, A., and Gruber, N.: Ocean Deoxygena-tion in a Warming World, Annu. Rev. Mar. Sci., 2, 199–229, 2010.
Keller, K. M., Joos, F., and Raible, C. C.: Time of emergence of trends in ocean biogeochemistry, Biogeosciences, 11, 3647– 3659, doi:10.5194/bg-11-3647-2014, 2014.
Kouketsu, S., Fukasawa, M., Sasano, D., Kumamoto, Y., Kawano, T., Uchida, H., and Doi., T.: Changes in water properties around North Pacific intermediate water between the 1980s, 1990s and 2000s, Deep-Sea Res. II, 57, 1177–1187, 2010.
Laufkötter, C., Vogt, M., Gruber, N., Aita-Noguchi, M., Aumont, O., Bopp, L., Buitenhuis, E., Doney, S. C., Dunne, J., Hashioka, T., Hauck, J., Hirata, T., John, J., Le Quéré, C., Lima, I. D., Nakano, H., Seferian, R., Totterdell, I., Vichi, M., and Völker, C.: Drivers and uncertainties of future global marine primary pro-duction in marine ecosystem models, Biogeosciences Discuss., 12, 3731–3824, doi:10.5194/bgd-12-3731-2015, 2015.
Lyu, K., Zhang, X., Church, J. A., Slangen, A. B. A., and Hu, J.: Time of emergence for regional sea-level change, Nat. Clim. Change, 4, 1006–1010, 2014.
Mahlstein, I., Hegerl, G., and Solomon, S.: Emerging local warming signals in observational data. Geophys. Res. Lett., 39, L21711, doi:1029/2012GL053952, 2012.
Majkut, J. D., Carter, B. R., Frölicher, T. L., Dufour, C. O., Rodgers, K. B., and Sarmiento, J. L.: An observing system simulation for Southern Ocean carbon dioxide uptake, Philosoph. Transact. Roy. Soc. A, 37, 20130046–20130046, 2014.
Marshall, J. and Speer, K.: Closure of the meridional overturning circulation through Southern Ocean upwelling, Nature Geosci., 5, 171–180, 2012.
Martinez, E., Antoine, D., d’Ortenzio, F., and Gentili, B.: Climate-Driven Basin-Scale Decadal Oscillations of Oceanic Phytoplank-ton, Science, 326, 1253–1256, 2009.
Mecking, S., Langdon, C., Feely, R. A., Sabine, C. L., Deutsch, C. A., and Min, D.-H.: Climate variability in the North Pacific ther-mocline diagnosed from oxygen measurements: An update based on the US CLIVAR/CO2Repeat Hydrography cruises, Global Biogeochem. Cy., 22, GB3015, doi:10.1029/2007GB003101, 2008.
An-derson, J .M., Ambrosino, C. M., Fernandez-Silva, I., Giuseffi, L. F., and Giambelluca, T. W.: The projected timing of climate departure from recent variability, Nature, 502, 183–187, 2013. Park, G.-H., Wanninkhof, R., Doney, S. C., Takahashi, T., Lee, K.,
Feely, R. A., Sabine, R. A., Trinanes, C. L, and Lima, I .D.: Vari-ability of global net sea-air CO2fluxes over the last three decades using empirical relationships, Tellus, B, 62, 362–368, 2010. Pelejero, C., Calvo, E., McCulloch, M. T. Marshall, J. F., Gagan, M.
K., Lough, J. M., and Opdyke, B. N.: Preidustrial to modern in-terdecadal variability in coral reef pH, Science, 309, 2204–2207, 2005.
Plancherel, Y., Rodgers, K. B., Key, R. M., Jacobson, A. R., and Sarmiento, J. L.: Role of regression model selection and sta-tion distribusta-tion on the estimasta-tion of oceanic anthropogenic carbon change by eMLR, Biogeosciences, 10, 4801–4831, doi:10.5194/bg-10-4801-2013, 2013.
Rodgers, K. B., Key, R. M., Gnanadesikan, A., Sarmiento, J. L., Aumont, O., Bopp, L., Doney, S. C., Dunne, J. P., Glover, D. M., Ishida, A., Ishii, M., Jacobson, A. R., Lo Monaco, C., Maier-Reimer, E., Mercier, H., Metzl, N., Pérez, F. F., Rios, A. F., Wanninkhof, R., Wetzel, P., Winn, C. D., and Yamanaka, Y.: Using altimetry to help explain patchy changes in hydro-graphic carbon measurements, J. Geophys. Res., 114, C09013, doi:10.1029/2008JC005183, 2009.
Sarmiento, J. L., Hughes, T. M. C., Stouffer, R. J., and Manabe, S.: Simulated response of the ocean carbon cycle to anthropogenic climate warming, Nature, 393, 245–249, 1998.
Steinacher, M., Joos, F., Frölicher, T., Bopp, L., Cadule, P., Cocco, V., Doney, S. C., Gehlen, M., Lindsay, K., Moore, J. K., Schnei-der, B., and SegschneiSchnei-der, J.: Projected 21st century decrease in marine productivity: a multi-model analysis, Biogeosciences, 7, 979–1005, doi:10.4195/bg-7-979-2010, 2010.
Stouffer, R. J., Manabe, S., and Bryan, K.: Interhemispheric asym-metry in climate response to a gradual increase of atmospheric CO2, Nature, 432, 660–662, 1989.
Takatani, Y., Sasano, D., Nakano, T., Midorikawa, T., and Ishii, M: Decrease of dissolved oxygen after the mid-1980s in the western North Pacific subtropical gyre along the 137◦E repeat section, Global Biogeochem. Cy., 26, GB2013, doi:10.10292011GB004227, 2012.
Timmermann, A., Oberhuber, J., Bacher, A., Esch, M., Latif, M., and Roeckner, E.: Increased El Niño frequency in a climate model forced by future greenhouse warming, Nature, 298, 694– 697, 1999.
van Vuuren, D. P., Edmonds, J., Kainuma, M., Riahi, K., Thom-son, A., Hibbard, K., Hurtt, G., Kram, T., Krey, V., Lamarque, J.-F., Masui, T., Meinhausen, M., Nakicenovic, N., Smith, S. J., and Rose, S. K.: The representative concentration pathways: an overview, Clim. Change, 109, 5031, doi:10.1007/s10584-011-0148-z, 2011.
Vaquer-Sunyer, R. and Duarte, C. M.: Thresholds of hypoxia for marine diversity, Proc. Natl. Acad. Sci., 105, 15452–15457, 2008.
Veron, J. E .N., Devantier, L. M., Tuark, E., Green, A. L., Kin-inmonth, S., Stafford-Smith, M., and Peterson, N.: Galaxea, J. Coral Reef Stud., 11, 91–100, 2009.
Wittenberg, A. T.: Are historical records sufficient to con-strain ENSO simulations, Geophys. Res. Lett., 36, L12702, doi:10.1029/2009GL038710, 2009.
Wittenberg, A. T., Rosati„ A., Delworth, T. L., Vecchi, G. A., and Zeng, F.: ENSO Modulations: Is It Decadally Predictable?, J. Cli-mate, 27, 2667–2681, 2014.