IJST, Transactions of Electrical Engineering, Vol. 37, No. E2, pp 193-198 Printed in The Islamic Republic of Iran, 2013
© Shiraz University
"Research Note"
COMPARING EVOLUTIONARY ALGORITHMS ON TUNING THE
PARAMETERS OF FUZZY WAVELET NEURAL NETWORK
*P. ARAB KHEDRI, M. EFTEKHARI
**AND R. MAAZALLAHI
Dept. of Computer Engineering, Shahid Bahonar University of Kerman, Kerman, I. R. of Iran Email: [email protected]
Abstract– In recent years Fuzzy Wavelet Neural Networks (FWNNs) have been used in many areas. Function approximation is an important application of FWNNs. One of the main problems in effective usage of FWNN is tuning of its parameters. In this paper several different evolutionary algorithms including Genetic Algorithm (GA), Gravitational Search Algorithm (GSA), Evolutionary Strategy (ES), Fast Evolutionary Strategy (FES) and variants of Differential Evolutionary algorithms (DE) are used for adjusting these parameters on five test functions. The obtained results are compared based on some measures by using multiple non-parametric statistical tests. The comparison reveals the superiority of some variants of DE in terms of convergence behavior and the ability of function approximation.
Keywords– Fuzzy wavelet neural networks, function approximation, evolutionary algorithms, nonparametric statistical test
1. INTRODUCTION
In recent years Fuzzy Wavelet Neural Network (FWNN) has been used as one of the most effective methods of soft computing. In fact, the structure of FWNN is a Neural Network that has been combined by fuzzy rules for dealing with complex problems which have ill-defined conditions and uncertain factors. Also, wavelet functions have been utilized in the consequent parts of fuzzy rules.
FWNN has been used in many different areas such as prediction, reinforcement learning and pattern recognition [1-4]. One of the main important applications of FWNN is function approximation [1-4]. In order to improve the function approximation accuracy and general capability of the FWNN system, the parameters of the FWNN must be adjusted. Several studies have been performed in which different variants of EAs have been applied for parameter optimization of FWNNs [1].
In this paper several evolutionary algorithms are used for adjusting the parameters of FWNN on some test functions and the results are compared.
The paper is organized as follows: Section 2 introduces FWNN and the evolutionary algorithms used. In Section 3 nonparametric statistical tests are briefly described. Experimental results are presented in Section 4. Finally, the conclusions are given in Section 5.
2. BASIC CONCEPTS
a) Fuzzy Wavelet Neural Network (FWNN)
In the following, the basic concept of fuzzy wavelet neural network is briefly introduced [1]. The structure of fuzzy wavelet neural network could be described as a set of M fuzzy rules. Rule is defined as follows:
Received by the editors December 12, 2012; Accepted October 20, 2013.
P. Arab Khedri et al.
IJST, Transactions of Electrical Engineering, Volume 37, Number E2 December 2013 194
: … , (1)
where , i=1...n, are the inputs and is the output of FWNN. are linguistic terms characterized by fuzzy membership functions. In this paper, the Gaussian membership function is used which is defined as:
1
2 2
where and stand for the center and width parameters, respectively. The output of is calculated as follows:
3
where are the weighting coefficients and x stand for the family of wavelets obtained from the single Mexican Hat function, (x) 1 . Therefore x is calculated as follows:
1 1 exp
2 4
where
5
here, , stand for the dilation and translation parameters, respectively. The output of FWNN is obtained as follows:
∑ ∏ exp 12
∑ ∏ exp 12 6
and
∑ ∑ 1 7
So the parameters of FWNN that must be adjusted are , , , . As we noted earlier, in this paper some evolutionary algorithms are utilized for the parameter tuning purpose. The structure of each chromosome, B, is as follows:
1, … , 1, … , 8 where
… … … , … … … , … … …
, … … … and …
For evaluating each chromosome, the Mean Squared Error (MSE) is used as fitness function.
b) Evolutionary Algorithms (EAs)
strategy-December 201
parameters. function in 9] is one o which is re utilized in it
In recent y significant statistical te then applied the obtained
In this pape tuned by dif
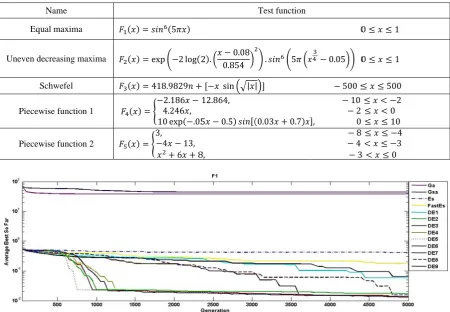
The pa set as follo inputs) and benchmark The results because DE second reas Equ Uneven d S Piecew Piecew
Fig. 1. Co
13
Fast Evolu mutation ste of the most
liable and fa t. In this pap
years the us improvemen ests which h
d to determin d ranking is r
er we have us fferent evolu arameters of ws: 5000 ge
d M=4 (num
function are show that E operates g on is that DE
Name ual maxima
decreasing maxi Schwefel wise function 1
wise function 2
omparing the
Comp
utionary Stra ep instead of powerful sto ast. DE has per, nine diffe
3. NON
e of statistic nt over the o
as been grea ne whether t reliable or no
sed five test utionary algo different evo enerations, p mber of fuzzy
e depicted in variants of reedy and re E has a lesser
ima
convergence o
paring evolution
IJ
ategy (FES) f Gaussian d ochastic real different var erent variant
NPARAMET
cal tests has others [10, 1 atly used for the algorithm ot [11]. 4. EXPERIM functions to rithms. Tabl olutionary alg population si
y rules). T Fig.1 based DE have be eplaces best r number of
Table
5
exp 2 log 2
418.9829 2.186 4.246 , 10 exp .05 3, 4 13, 6 8 of evolutionar nary algorithm IJST, Transacti
[7] is a ve distribution. T
l-parameter riants regard ts of DE are u
TRIC STAT
s been incre 11]. The Frie r ranking the ms have signi
MENTAL R
compare the le 1 presents gorithms (GA ize of 200, t The converge
on the avera etter converg offspring w parameters t
1. Test funct
2 . 0.08
0.854 sin | 12.864, 5 0.5 8, ry algorithms
ms on tuning th
ions of Electric
rsion of ES The Differen
approaches ding the sele used, DE1 to
TISTICAL T
eased to fin edman test i e algorithms ificant differ
RESULTS
e performanc these test fu A, GSA, ES, twenty indep ence diagram age of best s gence rate a with their pa to tune than o
tions
Test function
. 5
|
0.03 0.7
used in tuning e…
cal Engineering
which uses ntial Evolutio
to global nu ction and re o DE9.
TEST
nd out wheth is one of the [10, 11]. Po rence with ea
ce of FWNN nctions. , FES and nin pendent runs ms of differ
o far solution and accuracy
rents only if other algorith
0
0.05 0
500 10
2
, 0
8 4 3
g the FWNN f
g, Volume 37, N
s Cauchy di on algorithm umerical opt ecombination
her an algo e N×N nonp ost-hoc proce ach other and
whose param
ne variants o s for n=1 (n rent EAs for ons in each g
y than other f they are b hms. 0 1 0 1 500 2 0 10 4 3 3 0 for approxima Number E2 195 istribution m (DE) [8, timization n methods rithm has parametric edures are d whether meters are
of DE) are number of r the first eneration. s. This is etter. The
IJST, Transac 196
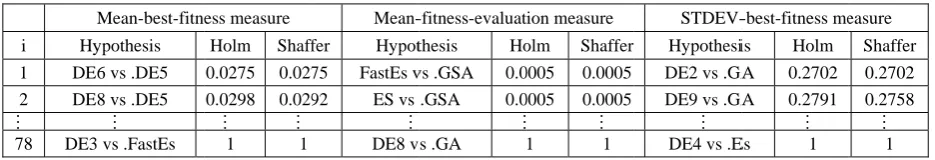
In the criteria are p the evolutio difference b (APV) for e accepting th than α, it i hypothesis (Shaffer and a) Compari Mean-B performanc comparing calculated i the standar different run us to find ou Figure STDEV-Be by Friedma measures re As men obtained by shown due procedures. among all th lowest aver are rejected measure.
Fig. 2. The a M i Hy 1 DE 2 DE … 78 DE3
ctions of Electr
following su presented. F onary algorith between eac each hypothe he hypothesi is rejected w
have signifi d Holm)
[10-ing evolution
Best-Fitness e of algorith the algorithm in 20 runs fo rd deviation
ns is calculat ut whether an
2 compares est-Fitness. T an test cons espectively.
ntioned earli y Friedman te to the lack From Table he variants o rage ranking, d in many hy
average rank and STDEV-B
Table 2. A
Mean-best-fitn ypothesis
6 vs .DE5 8 vs .DE5 … vs .FastEs
rical Engineeri
ubsection, th or each com hms. To mak ch pair of al
esis are utiliz is with a sig with confide icant differe -11] are appl
nary algorith
is the avera hms in term ms is how f or each algor
of fitness ted. The rob n algorithm y s the EAs ba Three bars (fr sidering Me
ier, the post-est. The resu k of space). e 2, it is imp of DE, becau
, as shown in ypotheses an
kings obtained Best-Fitness m
Adjusted p-valu among all
ess measure Holm Shaff 0.0275 0.027 0.0298 0.029… …
1 1
P. A
ing, Volume 37
he results of mparison, the
ke sure that t lgorithms, po zed. The APV nificant degr ence level o ence. The si
lied in our m
hms
ge of best fit ms of the ac fast they are
rithm. For ea values for ustness of al yields almos ased on num rom left to ri ean-Best-Fitn
-hoc procedu ults are presen We consid lied that DE use it is rejec n the Fig. 2. nd have the
by Friedman measures. (The
ues obtained b l algorithms b
Mean-fer Hypot 75 FastEs v 92 ES vs …
DE8 v
Arab Khedri et a
7, Number E2
comparing t multiple Fri the ranks obt ost-hoc proc V obtained b ree denoted of (1-α), me gnificant de multiple comp
tness values ccuracy of o . Therefore, ach test func the best ch lgorithms can st the same re mber of Mean ight) for eac ness,
Mean-ures are appl nted in Table der the resu E6 has the be cted in four h
. Also, DE5 highest aver
test consideri e lower rank m
by Post-hoc p based on differ
-fitness-evaluat thesis Ho vs .GSA 0.0 .GSA 0.0… vs .GA al. the evolution iedman statis tained by Fri cedures whic by a post-hoc by α. When eaning the t egree of α=0
parison tests.
obtained fro obtained resu
the average ction, 20 ind hromosomes n be specifie esults in mul n-Best-Fitne ch algorithm Fitness-Eval
lied for a bet e 2 (Only som ults obtained est performan
hypotheses r and DE7 ha rage ranking
ing Mean-Bes means better p
rocedures for rent measures
ion measure olm Shaffer 0005 0.0005 0005 0.0005…
1 1
nary algorithm stical tests (N
iedman test i ch determine c procedure i n the APV fo
two algorith 0.1 and two
om different r ults. Anothe e number of dependent run
(called STD ed using this ltiple runs.
ss, Mean-Fit are the avera luation and
tter understa me of the en d by Shaffer nce in terms elating to DE ave the worst
regarding th st-Fitness, Mea erformance of multiple com ' rankings STDEV-Hypothesi DE2 vs .GA DE9 vs .GA… DE4 vs .E
Dece
hms based on N×N) are use implicate a s e an adjuste is used for re or a hypothe hms specified o post-hoc p
runs that ind er important
fitness eval ns are carrie DEV-Best-F measure, wh
tness-Evalua rage rankings STDEV-Be
anding of the ntire 78 hypo
r and Holm of Mean-Be E variants an t performanc the Mean-Be ean-Fitness- Ev f algorithm.) mparisons -best-fitness me is Holm GA 0.2702 GA 0.2791 …
Es 1
ember 2013
n different ed to rank significant ed p-value
ejecting or esis is less d by that procedures
dicates the factor in luations is ed out and itness) in hich helps ations and s obtained est-Fitness e rankings otheses are post-hoc est-Fitness
nd has the ce as they est-Fitness
valuation
easure Shaffer 0.2702 0.2758 …
Comparing evolutionary algorithms on tuning the…
December 2013 IJST, Transactions of Electrical Engineering, Volume 37, Number E2 197
In Fig 2, GSA has the best ranking in terms of Mean-Fitness-Evaluations. Also, by looking at Table 2 which shows the result of post-hoc procedures, it can be seen that GSA rejects all the hypotheses. Thus, the GSA is surely the fastest algorithm. FES and ES have the worst ranking and are also rejected in all hypotheses. Therefore, they are the slowest algorithms. With the same explanation, it is concluded that the variants of DE and GA are faster than FES and ES but are slower than GSA. Based on the STDEV-Best-Fitness measure in Fig. 2, the GA has the best average ranking but it is not able to reject any hypotheses as implied from Table 2. Therefore, it is concluded that there is no significant difference between algorithms considering this measure.
5. CONCLUSION
In this paper, the structure of the FWNN model was introduced for function approximation from input– output pairs. It integrates the advantages of fuzzy concepts, wavelet functions, and neural networks. The parameters of FWNN must be adjusted properly before it can be used for function approximation. For this task, some evolutionary algorithms (GA, GSA, ES, FES and nine variants of DE) were used and their performance based on Mean-Best-Fitness, Mean-Fitness-Evaluation and STDEV-Best-Fitness factors were compared using Friedman statistical test. We also plotted the convergence diagram of each algorithm. The results show that variants of DE are the winner considering convergence rate and Mean-Best-Fitness factor. GSA runs faster due to the least average number of Fitness evaluations. The statistical tests implied that there is no significant difference between algorithms considering STDEV-Best-Fitness measure. So DE is recommended for approximation in situations where the accuracy is the most important factor.
REFERENCES
1. Shian-Tang, T. (2010). Design of fuzzy wavelet neural networks using the GA approach for function approximation and system identification. Fuzzy Sets and Systems, Vol. 161, pp. 2585-2596.
2. Zekri, M., Sadri, S. & Sheikholeslam, F. (2007). Approximation of feedback linearization control input based on fuzzy wavelet networks. Iranian Journal of Science & Technology, Transaction B, Engineering, Vol. 31, No. 6, pp. 651-662.
3. Ebadat, A., Noroozi, N., Safavi, A. A. & Mousavi, S. H. (2011). New fuzzy wavelet network for modeling and control: The modeling approach. Communications in Nonlinear Science and Numerical Simulation, Vol. 16, pp. 3385-3396.
4. Uma Shankar, B., Meher, S. K. & Ghosh, A. (2011). Wavelet-fuzzy hybridization: Feature-extraction and land-cover classification of remote sensing images. Applied Soft Computing, Vol. 11, pp. 2999-3011.
5. Rashedi, E., Nezamabadi-pour, H. & Saryazdi, S. (2009). GSA: A gravitational search algorithm. Information Sciences, Vol. 179, pp. 2232–2248.
6. Navale, R. L. & Nelson, R. M. (2012). Use of genetic algorithms and evolutionary strategies to develop an adaptive fuzzy logic controller for a cooling coil Comparison of the AFLC with a standard PID controller. Energy and Buildings, Vol. 45, pp. 169-180.
7. Yao, X. & Liu, Y. (1997). Fast evolution strategies. Lecture Notes in Computer Science, Vol. 1213, pp. 151-161.
8. Warren, L. T. (2010). Two hybrid differential evolution algorithms for engineering design optimization. Applied Soft Computing, Vol. 10, pp.1188-1199.
P. Arab Khedri et al.
IJST, Transactions of Electrical Engineering, Volume 37, Number E2 December 2013 198
10. García, S., Fernández, A., Luengo, J. & Herrera, F. (2010). Advanced nonparametric tests for multiple comparisons in the design of experiments in computational intelligence and data mining: Experimental analysis of power. Information Sciences, Vol. 180, pp. 2044-2064.