Vol. 12, 2018, 1-10
ISSN: 2349-0632 (P), 2349-0640 (online) Published 15 January 2018
www.researchmathsci.org
DOI: http://dx.doi.org/10.22457/jmi.v12a1
1
Journal of
Adaptive Image Fusion Method Based on
Non-subsampled Contourlet Wavelet Transform
Liang-liang Wang1, Gui-cang Zhang2 and Wen-xiao Jia3
1
Department of Computational Mathematics, Northwest Normal University Lan'zhou – 730070, Lan'zhou, China. E-mail:[email protected]
2
Department of Computational Mathematics, Northwest Normal University Lan'zhou – 730070, Lan'zhou, China. E-mail:[email protected]
3
Department of Computational Mathematics, Northwest Normal University Lan'zhou – 730070, Lan'zhou, China. E-mail:[email protected]
Received 2 January 2018; accepted 15 January 2018
Abstract. In order to solve the problem of the detail and the indistinct texture of the traditional image fusion algorithm, an image fusion method based on non-subsampled contourlet transform (NSCT) and self-adaptive correlation coefficient operator is proposed, which can effectively preserve the details of the fusion source image information and important structural information. Firstly, the low- pass subband and band-pass subband of the source image are decomposed by NSCT, and then the low-pass subband is fused by the fusion rule of the adaptive region variance, the band-pass subbands are fused by adaptive weights with coefficients gradient as the factor. Finally, through the NSCT inverse transformation to get the result image. The simulation results show that the adaptive algorithm is superior to the fusion method of human control fusion rule.
Keywords: Image fusion; Non-subsampled Contourlet Transform; adaptive operator; correlation coefficient
AMS Mathematics Subject Classification (2010): 42A38, 42B10 1. Introduction
2
beneficial to the edge information of the image, but the higher complexity of the method leads to the fusion process slower, and the convergence of the accuracy but declined. Such as discrete wavelet transform, Laplacian pyramid transform and other transformation based fusion algorithm, this fusion method to solve the simple pixel fusion caused by the lack of correlation between the pixels, the fusion rules determine the fusion image effects The key to good or bad. Because of the interrelation between the pixels of the image, based on a single pixel fusion method will inevitably cause the lack of correlation between pixels, resulting in poor fusion image [5]. Li et al. [6] proposed the use of lifting wavelet characteristics for medical image fusion. The research shows that the accuracy of the fused image is helpful for clinical diagnosis. However, the edge and texture information of the resulting image are not very clear.
In contrast to these references, this text aims to fully extract the edge information of the source image and obtain the texture information of the image and to improve the fusion. The paper is organized as follows. In section 2, we give the basic principle of the algorithm: Non-subsampled Contourlet Wavelet Transform (NSCT). In section3, we present a fusion algorithm using NSCT and adaptive operator is proposed in this paper. In section4, the experimental simulation is gived base on this stock is discussed. Section 5 contains conclusions.
2. Principle of basic algorithm
Non-sampled contourlet transform [7-8] was improved by Cunha in 2005 based on the traditional contourlet, which has translational invariance and multi-scale transformation. The image is decomposed into a band-pass subband and a low-pass subband by a non-sampling filter, and each stage of decomposition needs to up-non-sampling the previous layer. The decomposition principle is similar to the Contourlet algorithm, but NSCT ensures that the sample size is unchanged during the sampling process. Its transformation principle is as follows:
Figure 1: NSCT decomposition process Figure 2: Frequency domain distribution
The NSCT solves the problem of poor local characteristics in the transform domain and the frequency domain of Contourlet, and has anisotropy. Therefore, it has better abilities to extract contour features of the source image and provide more information for the resulting image. Therefore, this paper uses the NSCT in the frequency domain decomposition of the source image.
3. Algorithm design
Transform
3
fusion result. In the traditional fusion algorithm, the determination of artificial rules usually leads to the occurrence of fusion distortion, resulting in fusion deviation and inaccurate fusion information. Therefore, this paper introduces adaptive operator instead of manual control.
3.1. Adaptive operator
The correlation coefficient was originally used to assess the correlation between the two images contained in the information, which reflects the similarities between the two images. The correlation coefficient [9] is defined as:
∑∑
− = − = = 0 0 00 () ( )
) , ( log ) , ( L i L
i A B
AB AB AB j P i P j i P j i P
RC (1)
) (i
pA , pB( j) represent the probability distribution of the source image A、B, )
, ( ji
pAB represents the joint probability that the gray value of the pixel A is i, and the gray value of image B is j in the same position. Then define the adaptive operator
λ
as follows: > ≤ − =η
η
η
λ
AB AB AB RC RC RC , 0 , 1 (2)where
η
∈[0,1] is the allowable difference threshold of the image. The value ofη
is determined by the modality of the image.3.2. Low-pass subband fusion
The image's low-pass sub-band coefficients contain some regional geometric information in the image. Because the image to be fused is inherently ambiguous [10], and the regional variance of the image reflects the sensitive information of the image. In order to better determine the fusion weight coefficient according to the different image types, the adaptive variance comparison value is used instead of the artificial weight coefficient.
Let CAL( ji, ) and CBL( ji, ) thelow-pass subband coefficients of the source images A and B of size M×N at ( ji, ) , respectively, and L
A
C and L B
C denote the 8-neighborhoodlow-pass subband average coefficients of the two images centered on
( )
i,j . The formula is defined as follows:( )
∑ ∑
= = × = 8 1 8 1 , 8 8 1 i j L A LA C i j
C (3)
( )
∑ ∑
= =×
=
8 1 8 1,
8
8
1
i j L B LB
C
i
j
C
(4)Define the variance of coefficients of 8 neighborhoods centered at
( )
i,j on two4
(
)
2 8 1 8 1 2 ) , ( 8 8 1 ,∑ ∑
= = − × = i j L A L AA i j C i j C
sd( )
(5)
(
)
2 8 1 8 1 2 ) , ( 8 8 1 ,∑ ∑
= = − × = i j L B L BB i j C i j C
sd( )
(6)
Define the variance comparison value as:
) , ( 2 j i C sd
CVA = A⋅ AL (7)
) , ( 2 j i C sd
CVB = B⋅ BL (8)
This article's low frequency sub-band coefficient fusion strategy is determined as follows: < + ⋅ ⋅ + ⋅ ⋅ ≥ ⋅ + ⋅ ⋅ + ⋅ = B A B A B L B A L A B A B A B L B A L A L F CV CV CV CV CV j i C CV j i C CV CV CV CV CV j i C CV j i C C , ) , ( ) , ( , ) , ( ) , ( λ λ λ λ (9)
where CBL(i, j) represents the low-frequency coefficients fused based on this rule.
3.3. Band-pass subband fusion rules
In the band-pass subband coefficients obtained by the NSCT transform, there are some points with larger coefficients, which correspond to the possible distortion in the image. Taking into account the human eye visual system[11], the human eye for the obvious part of the characteristics of the obvious than the characteristics of part of the sensitive reflection. Therefore, in the fusion stage of band-pass sub-band coefficients, the gradient energy which can reflect the degree of image edge is selected as the fusion strategy factor in this fusion phase, and the alternative artificial operator is also chosen to decide the fusion weight coefficient so as to highlight the edge information well and texture changes. Define the gradient of the image coefficient:
( )
[
] [
]
2 ) , ( ) 1 , ( ) , ( ) . 1 (,j f i j f i j f i j f i j i
G = + − + + − (10)
Then the gradient energy centered on
( )
i,j and its 3×3 neighborhood is defined as:2 3 1 3 1 ) , ( ) , (
∑∑
= = = i j j i G j iE (11)
In order to fully reflect the degree of difference between high-frequency coefficients, and try to make it reflected in the fusion formula, the definition of bandpass coefficient comparison value is:
2 2
,
1 1
( , ) 0.25 ( , ) Hmn( , ) i j
DV i j E i j C i j
= =
=
∑∑
⋅ (12)Transform 5 < + ⋅ ⋅ + ⋅ ⋅ ≥ ⋅ + ⋅ ⋅ + ⋅ = ) , ( ) , ( , ) , ( ) , ( ) , ( ) , ( , ) , ( ) , ( ) , ( , , , , , j i DV j i DV DV DV DV j i C DV j i C j i DV j i DV DV DV DV j i C DV j i C j i C B A B A B n H B A n H A B A B A B n H B A n H A n H F m m m m m
λ
λ
λ
λ
(13)whereCFH n
( )
i jm, , ,CH n
( )
i jA
m, , and CH n
( )
i jB
m, , represent the coefficients of the fusion
result image and source images in layerm, n direction respectively.
The inverse transform of the fusion coefficients obtained by the above algorithm will yield the result images (such as figures 4(h), 5(h), 6(h)).
Figure 3 shows the basic flow chart of NSCT fusion.
Figure 3: Initial fusion flow chart 4. Experimental results and analysis
4.1. Evaluation criteria
In order to verify the performance of the algorithm and the quality of the fusion results [12-13], we will evaluate the fusion results from the subjective and objective aspects of human vision. Subjective evaluation is the use of the human eye on the image clarity, the target information and texture evaluation, subjective factors larger objective evaluation is mainly the use of image evaluation criteria for evaluation, where the choice of mean, standard deviation of the evaluation of image information, both Are positive indicators (the higher the value, the better the rating); the use of PSNR considers the degree of gray-level differences between the fused image and the source image to be fused.
The clarity of the image, also known as sharpness, is also assessed using an average gradient (AG) that measures the abrupt and texture information of the image, which is also a positive indicator. The formula is defined as follows:
∑∑
− = − = ∆ + ∆ × = ∇ 1 0 1 0 2 2 2 1 M i N j B A I I N Mg (14)
6
∑
=
−
= 255
0
2
log i
i
i p
p
H (15)
where pi is the probability that the gray value of the image is equal to i.
Finally, we use the positive index cross entropy (CE) to consider the correlation between the result image and the source images.
4.2. Experimental simulation
In the process of experiment simulation, Matlab 7.1 is selected as experimental platform, and two different types of images are selected for experimental simulation and analysis to ensure the feasibility of the proposed algorithm.
In this paper, based on Laplacian pyramid algorithm (LP), literature [4] algorithm, literature [6] algorithm and the algorithm in this paper, the traditional NSCT algorithm are chosen to perform the fusion experiment on two different modal images respectively. By contrast, explain the advantages of this algorithm.
4.2.1. Infrared and visible light image fusion experiment
Experimental results of infrared and visible images As shown in the figure, the fusion of infrared images and visible images is one that can skillfully express heat source
information [14] and express scene information.
(a) (b) (c) (d)
(e) (f) (g)
Figure 4: Image database: infrared image (a) and visible image (b), fusion result by LP transform: (c), fusion result by literature [4] algorithm: (d), fusion result by literature [6] algorithm: (e), fusion result by NSCT algorithm: (d), fusion result by the algorithm in this paper: (d).
Transform
7
structure and texture of the scene information Relative to the initial fusion map has a higher promotion.
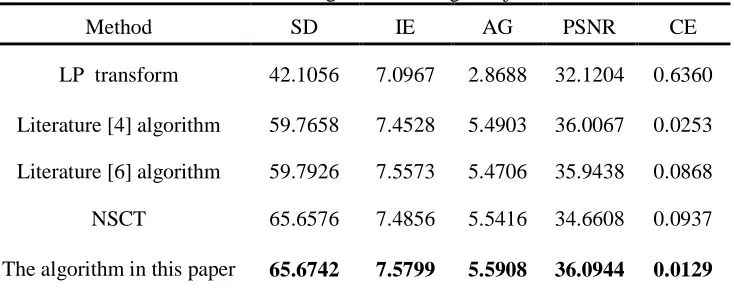
Table 1: Infrared and visible light fusion images objective evaluation
Method SD IE AG PSNR CE
LP transform 42.1056 7.0967 2.8688 32.1204 0.6360
Literature [4] algorithm 59.7658 7.4528 5.4903 36.0067 0.0253
Literature [6] algorithm 59.7926 7.5573 5.4706 35.9438 0.0868
NSCT 65.6576 7.4856 5.5416 34.6608 0.0937
The algorithm in this paper 65.6742 7.5799 5.5908 36.0944 0.0129 Table 1 shows the objective evaluation of the above algorithms; it is not difficult to find that the proposed algorithm is superior to other fusion results in all aspects. In terms of standard deviation, this paper outperforms the traditional NSCT fusion algorithm by about 24%, while other algorithms do not exceed 30; in terms of information entropy, this algorithm exceeds 7, the other algorithms are between 6 and 7; in addition, In terms of the average gradient of image edge and texture, the LP algorithm has the lowest algorithm, which is up to 5.5908, which is 35% higher than that of NSCT. This shows that the proposed algorithm has good performance in infrared and visible image fusion.
4.2.2. Medical image fusion experiment
Figure 5 shows the fusion results of medical images. For the fusion of medical images, the goal is to extract the luminance areas of two images and display them on an image, so as to provide effective medical information for doctors' diagnosis.
(a) (b) (c) (d)
(e) (f) (g)
8
From a subjective point of view, we can clearly see that although the fusion results based on LP transform have certain brightness, the soft tissue information is ambiguous. Similarly, the soft tissue based on the fusion result of the literature [6] algorithm and the literature [4] algorithm. The performance of the information is relatively clear, but the image brightness is low and the resolution is low. The NSCT improves the brightness and improves the definition and contrast. However, the fusion result of the algorithm in this paper is superior in brightness and highlighting the target information, the details of the information also showed the ideal, good visual effects [15].
As can be seen from Table 2, the results obtained by this algorithm show only a lower cross-entropy than the fusion results of the literature [6] algorithm, which shows that this algorithm can extract more useful information of the original image. In terms of information entropy, the first four algorithms are 9.3%, 3.6%, 2.9% and 4.5% respectively, which shows that the proposed algorithm performs better in combining image information capabilities. In terms of average gradient, except for the proposed algorithm, which shows that the algorithm in this paper is more ideal in image texture and sharpness representation. Meanwhile, the peak signal-to-noise ratio of fusion image reaches 44.5472, which has obvious advantages over other algorithms. It can be seen from the above that the algorithm in this paper also achieves the ideal effect in medical image fusion and provides more accurate information for medical diagnosis.
Table 2: Objective evaluation of fusion results of medical images
4.2. Experimental Analysis
Through simulation experiments on two groups of different types of images, it can be seen that the proposed algorithm has greatly improved compared with NSCT algorithm in terms of combining source image information, improving image brightness and sharpness, and at the same time subjective and objective evaluation, The fusion result obtained by the algorithm is superior to other traditional algorithms in all aspects, which solves the problem that the fused image detail information is not clear and the image quality is not high, and further illustrates the advantages of the algorithm in this paper.
Method SD IE AG PSNR CE
LP transform 22.5830 6.4463 2.4566 32.2419 1.1577
literature [4]
algorithm 36.8288 6.8569 3.9811 36.6749 0.7048 literature [6]
algorithm 37.8749 6.8626 3.6057 36.6403 0.7844
NSCT 34.9425 6.7962 3.5470 35.3537 1.2027
The algorithm in this
Transform
9 5. Conclusion
In order to solve the problem of low efficiency of traditional fusion algorithm in the combination of source image information and image sharpness, this paper presents a fusion algorithm based on invariance of NSCT sampling. In the low-pass subband fusion, the regional variance is used to define the fusion comparison value. In the bandpass sub-band, the gradient energy is used as the value of the fusion comparison factor. The important information such as the detail and texture of the image is taken as the weight of the coefficient fusion phase. The image contains important information about the source image.
REFERENCES
1. Z.Wang, D.Ziou, C.Armenakis, et al., A comparative analysis of image fusion methods, IEEE Transactions on Geoscience & Remote Sensing, 43(6) (2005) 1391-1402.
2. Z.Chen, X.Xing, University P. Image fusion algorithm based on non-subsampled Shearlet transform and compressed sensing, Chinese Journal of Liquid Crystals & Displays, 30(6) (2015)1024-1031.
3. W.Liu, Adaptive Medical Image Fusion Method based on NSCT and Unit-Linking PCNN, International Conference on Computer Engineering, Information Science & Application Technology, 2016.
4. C.A.O.Guangzhen, H.O.U.Peng and J.I.N.Yaqiu, Image Fusion of SAR Remote Sensing with Laplacian Pyramid Transformation Fusion Algorithm Based on-Local Conditional Information of Image, Remote Sensing Technology & Application, 22(5) (2007) 628-632.
5. Y.A.Zheng, J.S.Song, W.M.Zhou et al., Objective evaluation method for image fusion based on image quality index, Systems Engineering & Electronics, 28(3) (2006) 463-466.
6. W.Li, X.Zhu and S.Wu, A novel approach to fast medical image fusion based on lifting wavelet transform, Intelligent Control and Automation, 2006, WCICA 2006. The Sixth World Congress on. IEEE, (2006) 9881-9884.
7. M.N.Do and M.Vetterli, The contourlet transform: An efficient directional multiresolution image reperesentation, IEEE Transactions on Image Processing, 14(12) (2005) 2091-2016.
8. L.C.Arthur, J.Zhou and M.N.Do, Nonsubsampled contourlet transform: theory, design and applications, IEEE Transactions. Image Proccessing, 2005.
9. Q.Wang, Z.Chi and R.Zhao, Image thresholding by maximizing the index of nonfuzziness of the 2-d grayscale histogram, Computer Vision & Image Understanding, 85(2) (2002)100-116.
10. T.J.Li and Y.Y.Wang, Biological image fusion using a NSCT based variable-weight method, Information Fusion, 12 (2012) 85-92.
10
12. Z.M.P.Sazzad and Y.Horita, No-reference stereoscopic image quality assessment, Proceedings of SPIE - The International Society for Optical Engineering, 2010, 7524(2):75240T-75240T-12.
13. Q.Wang, Y.Shen, Y.Zhang, et al. Fast quantitative correlation analysis and information deviation analysis for evaluating the performances of image fusion techniques, IEEE Transactions on Instrumentation & Measurement, 53(5) (2004) 1441-1447.
14. W.W.Kong, B.H.Wang and Y.Lei, Technical for infrared and visible image fusion non-subsampled shearlet transform and spiking cortical model, Infrared Physics & Technology, 71(6) (2015) 87-98.
![Figure 4: Image database: infrared image (a) and visible image (b), fusion result by LP transform: (c), fusion result by literature [4] algorithm: (d), fusion result by literature [6] algorithm: (e), fusion result by NSCT algorithm: (d), fusion result by t](https://thumb-us.123doks.com/thumbv2/123dok_us/8858857.1806071/6.595.148.470.398.571/database-infrared-transform-literature-algorithm-literature-algorithm-algorithm.webp)