The Thirty-Third AAAI Conference on Artificial Intelligence (AAAI-19)
Efficient Region Embedding with Multi-View Spatial Networks:
A Perspective of Locality-Constrained Spatial Autocorrelations
Yanjie Fu,
1Pengyang Wang,
1Jiadi Du,
1Le Wu,
2Xiaolin Li
31Missouri University of Science and Technology,2HeFei University of Technology,3Nanjing University
[email protected], [email protected], [email protected], [email protected], [email protected]
Abstract
Urban regions are places where people live, work, consume, and entertain. In this study, we investigate the problem of learning an embedding space for regions. Studying the rep-resentations of regions can help us to better understand the patterns, structures, and dynamics of cities, support urban planning, and, ultimately, to make our cities more livable and sustainable. While some efforts have been made for learn-ing the embeddlearn-ings of regions, existlearn-ing methods can be im-proved by incorporating locality-constrained spatial autocor-relations into an encode-decode framework. Such embedding strategy is capable of taking into account both intra-region structural information and inter-region spatial autocorrela-tions. To this end, we propose to learn the representations of regions via a new embedding strategy with awareness of locality-constrained spatial autocorrelations. Specifically, we first construct multi-view (i.e., distance and mobility connec-tivity) POI-POI networks to represent regions. In addition, we introduce two properties into region embedding: (i) spa-tial autocorrelations: a global similarity between regions; (ii) top-klocality: spatial autocorrelations locally and approxi-mately reside on topkmost autocorrelated regions. We pro-pose a new encoder-decoder based formulation that preserves the two properties while remaining efficient. As an applica-tion, we exploit the learned embeddings to predict the mobile checkin popularity of regions. Finally, extensive experiments with real-world urban region data demonstrate the effective-ness and efficiency of our method.
Introduction
An urban region (region for short) is a spatial area along with the agglomeration of high density population, infras-tructures of built environments, and socioeconomic activi-ties. As fundamental elements of a city, regions are places where people consume, live, work, and entertain. In this study, we investigate the problem of Learning an Embed-ding Space for Regions (LESR). The LESR problem refers to the efforts of finding a mapping function to represent re-gions into vectors in a latent embedding feature space, while preserving certain geospatial characteristics and regulariza-tions. Studying the quantitative representations of regions can help us to better understand the patterns, structures, and
Copyright c⃝2019, Association for the Advancement of Artificial Intelligence (www.aaai.org). All rights reserved.
dynamics of cities, to support urban planning, to boost com-mercial activities, and, ultimately, to make our cities more livable and sustainable.
All of the above evidence suggests it is highly appeal-ing to investigate the LESR problem. With the pervasive-ness of mobile sensing and location based services, Big Crowd-sourced Geo-tagged Data (BCGD), such as Point-Of-Interests, road networks, trajectories of vehicles, GPS traces from location based Apps, are increasingly available from diverse sources (e.g., buildings, vehicles, sensors, de-vices) in urban space, and provide great opportunities for un-derstanding and quantifying the configurations, structures, connections of regions. Meanwhile, deep network and word embedding techniques (e.g., Skipgram (Cheng, Greaves, and Warren 2006), LINE (Tang et al. 2015), DeepWalk (Per-ozzi, Al-Rfou, and Skiena 2014a), AutoEncoder (Liou et al. 2014)) have been widely used to learn an embedding space for social networks and natural languages.
These studies have inspired several preliminary stud-ies (Zhang et al. 2017; Wang and Li 2017; Yao et al. 2018; Wang et al. 2018a; Liu et al. 2019) for region embeddings. Several strategies have been studied. The first strategy learns embeddings from coarse-grained inter-region correlations. For example, the study in (Wang and Li 2017) learns embed-dings from a homogeneous network, where vertexes are re-gions and node embeddings are embeddings of rere-gions, via a skip-gram based method. The second strategy learns embed-dings from coarse-grained cross-geo-type (region and other spatiotempral items) correlations. The studies in (Yao et al. 2018; Zhang et al. 2017) learn embeddings from a heteroge-neous graph, where vertexes are mixtures of regions, time, mobility arrival events, and/or texts, and the vertex dings are not just embeddings of regions, but also embed-dings of time, texts, or mobility events, via matrix factoriza-tion or skipgram based methods. The third strategy learns embeddings from fine-grained intra-region structural infor-mation (e.g., configurations, structures, connections). The study in (Wang et al. 2018a) learns region embeddings from a set of networks, where a network is a region, vertexes are critical infrastructures (i.e., POIs) of a region, and the em-bedding of a region indeed is the emem-bedding of an entire graph, via an encode-decode framework.
strengths and weaknesses. For example, the first and second strategy respectively captures inter-region and cross-geo-type correlations, but both of them ignore intra-region struc-tural information; the third strategy captures intra-region structural information, but ignores inter-region correlations. Thus, there is a compelling need to develop a comprehen-sive method that can answer the following questions: (i) how can both the inter-region correlations and the intra-region structural information be modeled simultaneously in a uni-fied model? (ii) how can the correlations between regions and other geo-types (e.g., distances, mobility events) be in-corporated into the modeling? Specifically, we propose to combine and improve the three strategies from the follow-ing perspectives.
First, it is challenging to simultaneously take into account both the inter-region correlations and the intra-region struc-tural information. Inspired by the third strategy, we propose to use a set of POI networks, where an entire network is a region, to capture the intra-region structural information. We find that, compared with skipgram and its variants, an encode-decode framework is more appropriate to encode an entire POI network into a region embedding. Meanwhile, we propose to use a global pairwise similarity matrix of re-gions to parameterize inter-region spatial autocorrelations. The parameter matrix will be integrated into the optimiza-tion to serve as a graph similarity guarantee, in order to reg-ularize the encode-decode process. In this way, we encode both inter-region spatial correlations and intra-region struc-tural information. Second, we propose to use multi-view POI networks at the intra-region level to capture the cross-geo-type correlations that is modeled by the second strategy. We construct two types of networks: (i) distance based POI-POI networks and (ii) mobility connectivity based POI-POI net-works, as inputs of our method.
Aside from improving the effectiveness, we improve the efficiency of the model. Be sure to notice that the pairwise spatial autocorrelation matrix is big and the computation cost will exponentially increase with respect to the number of regions. Consequently, it is computationally expensive. We propose a more efficient embedding method by intro-ducing the locality property of the inter-region spatial auto-correlations. The hypothesis of the locality property is that, a region can be described by its top-kmost autocorrelated regions. In this way, we maintain efficient since it is per-formed on a small number of autocorrelated regions, com-pared to all of the other regions. In some sense, the locality property is a reduced form of the inter-region correlations that result in reduced computation costs. To accurately se-lect top-kmost autocorrelated regions, we propose a fused inter-region proximity to fuse (i) distance based proximity, in which if two regions are geographically close, the two regions tend to have higher distance based correlation; and (ii) functionality based proximity, in which if two regions provide similar and/or complementary urban functions and services to residents, the two regions tend to have higher functionality based correlation. The fused inter-region prox-imity preserves the consistency of locality embedding both in the geographic distance and region functionality domains. Along these lines, in this paper, we propose a method
for learning an embedding space for regions, by combining the strengths of the three existing strategies while reducing computational costs. Specifically, our contributions are: (1) The proposed method can simultaneously capture both inter-region and intra-inter-region structural information by integrating an encode-decode framework with global spatial autocorre-lations; (2) The proposed method can incorporate cross-geo-type correlations (i.e., regions, distances, human mobility connectivities) via multi-view networks as inputs; (3) The proposed method can introduce a fused inter-region proxim-ity to preserve the consistency of localproxim-ity embedding both in the geographic distance and region functionality domains, while maintaining efficient. (4) Extensive experimental re-sults with real-world urban region data demonstrate the im-proved effectiveness and efficiency of the proposed method.
Preliminaries
We first introduce some definitions and the problem state-ment, and then present an overview of the proposed method.
Definitions and Problem Statement
Definition 1 (Urban Region)An urban region is defined as an area that consists of a location (i.e., latitude and lon-gitude) of a residential complex and a neighborhood area (e.g., a circle with radius of 1 kilometer). There are many POIs located in the neighborhood area that provide a vari-ety of urban functions and living services to residents.
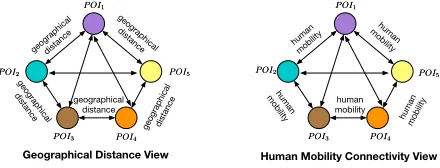
Definition 2 (Intra-region Multi-view POI-POI Net-works)The intra-region multi-view POI-POI networks are defined to represent each region and are the inputs of the proposed model. In this study, for each region, we con-struct two POI-POI networks from two viewpoints: (i) dis-tance based POI-POI networks, where vertexes are POI cat-egories, and the weight of an edge represents the distance between two associated POI categories; (ii) mobility con-nectivity based POI-POI networks, where vertexes are POI categories, and the weight of an edge represents the mobility connectivity between two associated POI categories.
P OI1 P OI1
P OI2 P OI2
P OI3 P OI3 P OIP OI44
P OI5 P OI5 geographical distance
geographical distance
geographical distance
geographical distance
geographical distance
human mobility
human mobility
human mobility
human mobility
human mobility P OI1
P OI1
P OI2 P OI2
P OI3 P OI3 P OIP OI44
P OI5 P OI5
Geographical Distance View Human Mobility Connectivity View
Figure 1: An example of intra-region multi-view POI-POI networks.
Urban Regions
R1
R2
Rn
Intra Region
Structure
Distance
Mobility Connectivity
Multi View POI—POI Network
Inter Region
Relationship
Spatial Autocorrelation
Top kk Locality
Inter Region Similarity Guarantee
Computation Efficiency Guarantee
Encode Decode Latent Feature
Application
Region Popularity Prediction
Learning to Embed Regins
Figure 2: An overview of the proposed region embedding framework.
propose to regard POI categories as vertexes. It is obvious that the number of POI categories is fixed. Consequently, the intra-region POI-POI networks are of fixed sizes as well.
Definition 3 (Fused Inter-region Proximity) The spatial autocorrelation matrix is a special version of the covariance matrix of regions that describes the pairwise proximity be-tween every pair of two regions. To provide a robust esti-mation of the inter-region spatial autocorrelations, we pro-pose an empirical metric, which we call fused inter-region proximity, that fuses (i) distance based proximity, which is related to the geographic distance between two regions; and (ii) functionality based proximity, which is measured by the similarity between the POI distributions of two regions.
Definition 4 (The LESR Problem) Considering the exis-tence of a set of regions, given the multi-view POI-POI net-works for each region, we aim to learn an effective low-rank vector in an embedding space for each region in order to preserve spatial autocorrelations and top-klocality, while maintaining efficient. Essentially, to learn the embeddings of regions, the proposed method should be capable of: (i) describing coarse-grained inter-region spatial autocorrela-tions; (ii) describing fine-grained intra-region structural in-formation; (iii) exploiting the top-klocality property to re-duce computation costs.
Framework Overview
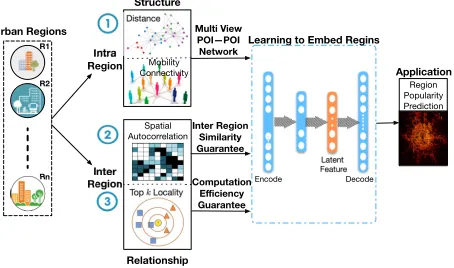
Figure 2 shows an overview of the proposed framework that includes the following tasks: (i) construction of intra-region multi-view POI-POI networks; (ii) development of a region embedding model that takes into account inter-region spatial autocorrelations and intra-region structural informa-tion; (iii) exploiting the top-klocality to reduce computa-tional complexity. Specifically, in the first task, for each re-gion, we construct a distance based POI-POI network and a mobility connectivity based POI-POI network, where ver-texes are POI categories and edges denote the relationships (i.e., average distances and human mobility connectivities) between POI categories. In the second task, we develop a new encode-decode framework that takes into account both the inter-region spatial autocorrelations and the intra-region
multi-view POI-POI networks for the optimal representa-tion learning. In the third task, we propose an approximate method that incorporates top-kautocorrelated region selec-tion during the learning procedure.
Methodology
We first propose an auto-encoder based formulation by in-troducing multi-view POI networks as inputs and spatial au-tocorrelations. In addition, we propose a further improved method by preserving the locality encoding while maintain-ing efficient.
Model Intuitions
We aim to model the inter-region spatial autocorrelations and intra-region structural information efficiently. The pro-posed method will be based on following intuitions.
Intuition 1: Intra-region Structural Guarantee.To rep-resent the intra-region structural information, we extract multi-view POI networks (i.e., a distance based POI-POI network and a mobility connectivity based POI-POI-POI-POI network) to describe the intra-region structural information for each region. We need a representation learning based method that can take multiple networks as inputs and encode such fine-grain intra-region profiles in a latent embedding space. Consequently, the method should be able to project multi-view networks into lower-dimensional vectors while preserving corresponding characteristics and structures.
Intuition 2: Inter-region Autocorrelations Guarantee. We introduce the property of spatial autocorrelations into the embedding formulation to help improve region representa-tion learning. Specifically, if two regions show a high auto-correlation score, the embeddings of the two regions should be close to each other. Consequently, the method should be able to learn an embedding space for regions with inter-region autocorrelations guarantee.
Intuition 3: Computation-efficient Guarantee. Sup-pose that there are N regions in a city, for each region, we need to consider the autocorrelations among this region and otherN−1regions. Therefore, the computational com-plexity for calculating autocorrelations can be estimated as O(N2). IfN is large, the computational cost increases
ex-ponentially. We introduce the locality property, which indi-cates that the impacts of the autocorrelations in a region’s embedding can be approximated by its top-knearest neigh-bors, instead of all of the other regions, for the purpose of reducing computational costs. We further develop a fused inter-region proximity to provide a robust estimation of top-kautocorrelated regions.
Constructing Intra-region Multi-view POI-POI
Networks
We propose to construct a distance based POI-POI network and a mobility connectivity based POI-POI network to de-scribe intra-region structural information for each region.
we construct distance based POI-POI networks from the perspective of geographical distances. In the distance based POI-POI network, vertexes are POI categories, the weights of edges are the average distances among POI categories.
A View of Human Mobility Connectivity.People’s out-door activities include the transitions from one POI to an-other POI, and ultimately form mobility flows in a region. As a result, human mobility can indicate the connectiv-ity among POIs (Wang et al. 2018b). Therefore, we con-struct mobility connectivity based POI-POI networks from the perspective of human mobility connectivities. In a mo-bility connectivity based POI-POI network, vertexes are POI categories, and the weights of edges are human mo-bility connectivities. We adopt the four-step method pro-posed in (Wang et al. 2018b) to estimate the human mo-bility connectivities among POI categories using a proba-bilistic method. Specifically, we first estimate POI visited probabilities as follows: Given the drop-off pointdof a taxi trace, we model the probability of a POIpvisited by a pas-senger as a parametric function, whose inputxis the road network distance between the drop-off pointdand the POI p:P(x) = β1β2 ·x·exp(1− x
β2),whereβ1 = maxx P(x)
andβ2 = argmax
x P(x); Second, we aggregate all
prob-abilities from all drop-off points in taxi traces: τ(p) =
∑
d∈DP(dis(d, p)), where D is the drop-off point set of
taxi traces in the region; Then, for each POI categoryiin a region, the POI category-level aggregated visit probability is given by:φi =∑p∈iτ(p), wherep∈idenotes the POI
pbelongs to theithPOI category; Finally, we calculate the
flow probabilities from theithPOI category to thejthPOI
category: φij⃗ = {
φi·φj, if i̸=j
0, if i=j . We use the flow probabilities to represent the human mobility connectivities among POI categories.
Formally, letGφi denote the original graph representation
of thei-th regionriat theφthview.
Base Model
We adopt Auto-encoder as the base model (Bengio et al. 2007). Auto-encoder is an unsupervised neural network model, which projects the instances in original feature repre-sentations into a lower-dimensional feature space via a series of non-linear mappings. The Auto-encoder model involves two steps: encode and decode. The encode part projects the original feature vector to the objective feature space, while the decode step recovers the latent feature representation to a reconstruction space. In the auto-encoder model, we need to ensure that the original feature representation of instances should be as similar to the reconstructed feature representa-tion as possible.
Formally, we flatten each graph into a vector to obtain the original vector representation of regions, denoted byxφi, wherexφi is the original vector representation ofGφi. And
(yφi)1,(yφi)2,· · · ,(yiφ)o be the latent feature representa-tions of the region at hidden layers1,2,· · · , oin the encode step respectively, the encoding result in the objective
lower-dimension feature space can be represented aszφi ∈Rdwith dimensiond. Formally, the relationship between these vec-tor variables is denoted by:
⎧
⎨
⎩
(yφi)1 =σ((Wφ)1xφ
i + (bφ)1),
(yφi)k =σ((Wφ)k(yφ
i)k−1+ (bφ)k),∀k∈ {2,3,· · ·, o},
zφi =σ((Wφ)o+1(yφ
i)o+ (bφ)o+1).
(1) Meanwhile, in the decode step, the input will be the latent feature vectorzφi (i.e., the output of the encode step), and the final output will be the reconstructed vectorxˆφi. The latent feature vectors at each hidden layers can be represented as
(ˆyφi)o,(ˆyφ
i)o−1,· · ·,(ˆy φ
i)1. The relationship between these
vector variables is denoted by:
⎧
⎨
⎩
(ˆyφi)o =σ(( ˆWφ)o+1zφ
i + (ˆbφ)o+1),
(ˆyφi)k−1 =σ(( ˆWφ)k(ˆyφi)k+ (ˆbφ)k),∀k∈ {2,3,· · ·, o},
ˆ
xφi =σ(( ˆWφ)1(ˆyφi)1+ (ˆbφ)1).
(2) whereWs andbs are the weight matrices and bias terms to be learned in the model.
The objective of the auto-encoder model is to minimize the loss between the original feature vectorxand the recon-structed feature vectorxˆ. Formally, the loss function is
H(R) =1 2
∑
φ∈Φ ∑
ri∈R
∥(xφi −ˆxφi)∥22 (3)
whereridenotes theithregion andRdenotes the region set,
Φdenotes the view set.
Incorporating Spatial Autocorrelations
The basic Auto-encoder is not able to preserve the property of spatial autocorrelations in representation learning. There-fore, we propose to use a matrix to parameterize the spatial autocorrelations between regions and incorporate the learn-ing of the parameter matrix into the Auto-encoder.
Formally, at the viewφ, letQφj,idenote the autocorrelation
factor ofjthregion overithregion. Then, for theithregion,
we formulate the autocorrelations from other regions as
(Qφi)∗= ∑
j̸=i,rj∈R
Qφi,jzφj. (4)
Therefore, the updated encode procedure can be repre-sented as:
⎧
⎪ ⎨
⎪ ⎩
(yφi)1 =σ((Wφ)1xφ
i + (bφ)1),
(yφi)k =σ((Wφ)k(yφ
i)k−1+ (bφ)k),∀k∈ {2,3,· · ·, o},
(yφi)o+1 =σ((Wφ)o+1(yφ
i)o+ (bφ)o+1),
zφi = (yφi)o+1+ (Qφ
i) ∗.
(5) The decode procedure will be the same.
Incorporating Top-
k
Locality for Efficiency
calculation and search of the parameter matrix is compu-tationally expensive. We propose to develop a more efficient method by introducing the top-klocality property of the spa-tial autocorrelations. The underlying hypothesis is that, the impacts of autocorrelations in a region’s embedding can be approximated by the top-k most autocorrelated regions of this region, which provides a great potential for us to per-form locality embedding on a small number of autocorre-lated regions, instead of all of the other regions.
To accurately select top-kmost autocorrelated regions, we propose a fused inter-region proximity, which is a combina-tion of two perspectives: (i) distance based proximity and (ii) functionality based proximity. In particular, we first calcu-late the normalized geographical distanceDi,jbetween the
i-th regionriand thej-th regionrj, wherei̸=j, ri, rj∈ R.
Later, we adopt the method proposed in (Yuan, Zheng, and Xie 2012) to learn the urban function distributions ofriand
rj, denoted by fi and fj, respectively. After that, we
cal-culate the urban function similarity of ri andrj: Fi,j =
cosine(fi,fj)With the extracted distance and functionality based scores, the fused inter-region proximity scoreSi,j
be-tweenriandrjis given by:
Si,j =
1
Di,j
×Fi,j. (6)
And we rank the regions in terms of the fused proximity scores in a descending order, in order to select top-kregions as the candidate regions to carry out locality embedding.
Finally, the learned region representations that consider the top-kmost autocorrelated regions can be formulated as
zφi = (yiφ)o+1+ ∑
j̸=i,rj∈(Ri)T opK
Qφi,jzφj, (7)
where(Ri)T opK denotes the top-k most correlated
candi-date regions for the regionri.
Experimental Results
We provide an empirical evaluation of the performances of the proposed method on real-world data.
Evaluation Scenario
In order to evaluate and interpret our embedding results, we exploit both linear regression models and regional embed-dings to predict regional mobility popularity, which is mo-bile check-in counts per region. For the regionri, letui
de-note the features,Pidenote the ground truth of regional
mo-bility popularity, andPˆi denote the predicted regional
mo-bility popularity. Then, the application is to learn a linear regression model:
Pi=WTui+b, (8)
whereWandbare the corresponding weights and biases. We use different methods to generate features, including our proposed embedding method and other baseline algorithms. We compare the prediction performances of the linear re-gression model using different features generated by various methods, to evaluate the effectiveness and efficiency of our proposed region embedding method.
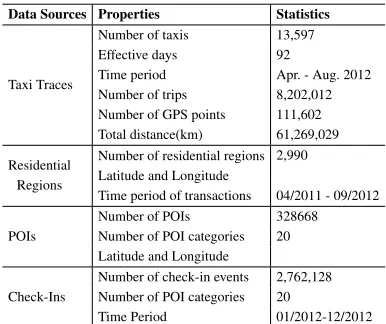
Data Description
Table 1 shows the statistics of four data sources used in the experiment. The taxi GPS traces are collected from a Beijing taxi company. Each trajectory contains trip id, distance(m), travel time(s), average speed(km/h), pick-up time and drop-off time, pick-up point and drop-drop-off point. Also, we extract POIs related data from www.dianping.com which is a busi-ness review site in China. Moreover, we crawl the Beijing residential region data from www.soufun.com which is the largest real-estate online system in China. Furthermore, the check-in data of Beijing is crawled from www.jiepang.com which is a Chinese version of Fourquare. Each check-in event includes name, category, address, longitude and lati-tude of POIs.
Table 1: Statistics of the Experimental Data
Data Sources Properties Statistics
Taxi Traces
Number of taxis 13,597
Effective days 92
Time period Apr. - Aug. 2012
Number of trips 8,202,012 Number of GPS points 111,602 Total distance(km) 61,269,029 Residential
Regions
Number of residential regions 2,990 Latitude and Longitude
Time period of transactions 04/2011 - 09/2012
POIs
Number of POIs 328668
Number of POI categories 20 Latitude and Longitude
Check-Ins
Number of check-in events 2,762,128 Number of POI categories 20
Time Period 01/2012-12/2012
Baseline Algorithms
To demonstrate the performances of the proposed method, we compared our method against the following algorithms. (1) Auto-Encoder with Multi-View Graphs. In the work (Wang et al. 2018b), the authors propose a region em-bedding method based on Auto-Encoder. Multi-view graphs are built to represent regions and then fed into Auto-Encoder to learn region embeddings. In the experiments, we set the number of hidden layers= 4, the size of middle layer= 50. (2) DeepWalk. The DeepWalk model (Perozzi, Al-Rfou, and Skiena 2014a) extends the word2vec model (Mikolov et al. 2013) to the scenario of network embedding. Deep-Walk uses local information obtained from truncated ran-dom walks to learn latent representations. In the experi-ments, we set the number of walks = 70, the size of rep-resentation= 50, the walk length = 30, and the window size= 10.
(3) LINE. The LINE model optimizes the objective func-tion that preserves both the local and global network struc-tures with an edge-sampling algorithm (Tang et al. 2015). In the experiments, we set the size of representation= 50, the number of negative samples= 5, and the starting value of the learning rate= 0.001.
Square Error
0 10 20 30 40 50 60 70
Auto−Encoder DeepWalk CNN
LINE Our Model
(a) SE
R
2
−1.0 −0.5 0.0 0.5
Auto−Encoder DeepWalk CNN
LINE Our Model
(b)R2
T
au
−0.1 0.0 0.1 0.2 0.3 0.4
Auto−Encoder DeepWalk CNN
LINE Our Model
(c) Tau
@5 @10 @15 @20
NDCG@N
0.0 0.2 0.4 0.6 0.8 1.0
Auto−Encoder DeepWalk CNN
LINE Our Model
(d) NDCG@N
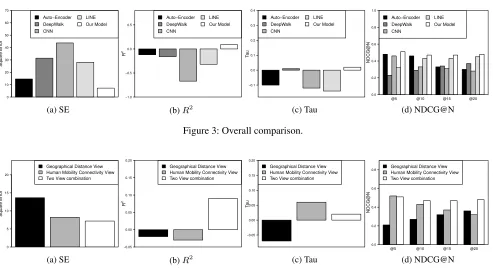
Figure 3: Overall comparison.
Square Error
0 5 10 15 20
Geographical Distance View Human Mobility Connectivity View Two View combination
(a) SE
R
2
−0.05 0.00 0.05 0.10 0.15 0.20
Geographical Distance View Human Mobility Connectivity View Two View combination
(b)R2
T
au
−0.05 0.00 0.05 0.10 0.15 0.20
Geographical Distance View Human Mobility Connectivity View Two View combination
(c) Tau
@5 @10 @15 @20
NDCG@N
0.0 0.2 0.4 0.6
0.8 Geographical Distance View
Human Mobility Connectivity View Two View combination
(d) NDCG@N
Figure 4: Performance in different views.
space via a variation of multilayer perceptrons (Lawrence et al. 1997). In the experiments, we set the number of convolu-tional layer= 2.
For other methods mentioned in the Introduction, the first strategy is for coarse-grained inter-region correlations, and the second strategy is designed for heterogeneous graph, while our proposed method is for fine-grained inter-region and intra-region correlations. Therefore, the first two strate-gies are both not suitable for the comparison.
Evaluation Metrics
We use the following evaluation metrics to evaluate the per-formances of our method and baseline algorithms.
Square Error.We utilizeSquare Error(SE) to measure re-gression errors.SE=∑
i(yi−fi)
2, whereNis the number
of regions. The lower the SE is, the better the learned repre-sentation is.
Coefficient of Determination.We utilize thecoefficient of determination(or R2 for short) to measure the regression
accuracy. R2 can be represented as R2 = 1−∑ i(yi −
fi)2/∑i(yi−y¯)2, wherey¯is the mean of benchmarks. The
higher theSEis, the better the learned representation is. Kendall’s Tau Coefficient.We utilizeKendall’s Tau Coef-ficient (Tau)to measure the overall ranking accuracy. For a region pair< i, j >,< i, j >is said to be concordant, if bothyi > yjandfi > fj or if bothyi < yj andfi < fj.
Also,< i, j >is said to be discordant, if bothyi < yjand
fi > fj or if both yi < yj andfi > fj. Tau is given by
Tau = #conc−#disc #conc+#disc.
Normalized Discounted Cumulative Gain.We utilize Nor-malized Discounted Cumulative Gain(NDCG@N) to
mea-sure the ranking accuracy at the top-N cases. The discounted cumulative gain (DCG@N) is given by N DCG[N] =
∑N i′=1
y i′ log2(1+i′)/
∑N i=1
yi
log2(1+i),whereidenotes the
orig-inal ranking order of the benchmark andi′denotes the rank-ing order of the prediction. The larger NDCG@N is, the higher top-N ranking accuracy is.
Overall Performances
We compare our method with the baseline methods in terms of SE,R2, Tau and NDCG@N. Figure 3 shows our model
achieves the best performance.
Because Auto-Encoder with multi-view graphs, Deep-Walk, CNN, and LINE are not able to model spatial auto-correlations among regions, the bad performance of base-lines validate the essence of spatial autocorrelations from the other side.
2 4 6 8 10
0 20 40 60 80 100
K
Square Error
0 50 100 150 10
20 30 40 50 60
K
T
raining Time (S)
Figure 6: Training time overk.
Study of Performances in Different Views
From Figure 4, it is interesting to observe that the perfor-mances of one single view are worse than the combination of these two views. And, the performance of the human mobil-ity connectivmobil-ity view is slightly better than the geographical distance view.
A potential explanation is that human mobilities have richer semantic information than static geographical dis-tance information. On the other hand, one single view can-not capture complete patterns of regions. The combination of these two views systematically makes up the deficiency of each single view.
The Sensitivity of Regression Errors over
k
We investigate the sensitivity of regression errors over k. Figure 5 shows that the error drops significantly withk get-ting larger, while the decreasing trend will slow down and remain relatively stable afterk = 7. The observation vali-dates the effectiveness of the proposed top-klocality method that the top-klocality selection can help us reduce the com-putational complexity, while barely sacrificing correctness as long as we can select a proper smallk.
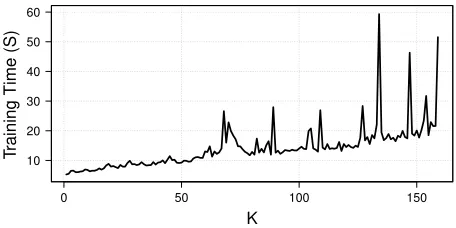
The Model Training Efficiency over
k
We also study the model training efficiency overkin Fig-ure 6. We set the training epoch as 100, learning rate as
0.001, numbers of Auto-Encoder layer as 4. We calculate the training time regardingkvarying from1to 160. One inter-esting observation is that the training time increases greatly withkgetting larger, while there are some fluctuations. This evidence indicates that a small kcan help to save a lot of training time, preserving good prediction performance.
Related Work
Network Embedding. Network embedding (Cui et al. 2017) has become an emerging topic since the first semi-nal work DeepWalk (Perozzi, Al-Rfou, and Skiena 2014b). DeepWalk is inspired from word representation learning method word2vec (Mikolov et al. 2013), which uses ran-dom walks in networks to stimulate sentences in language models. And after that random walks have been a general tool for learning embeddings, such as node2vec (Grover and Leskovec 2016) and metapath2vec (Dong, Chawla, and Swami 2017), to name a few. Almost at the same time as
DeepWalk, LINE (Tang et al. 2015) is proposed to learn net-work embedding via preserving the first and second order pairwise proximities. Moreover, predictive text embedding (PTE) extends LINE that works on heterogeneous text net-works (Tang, Qu, and Mei 2015).
Spatio-temporal Representation Learning.Our work is relevant to spatio-temporal representation learning. Spatio-temporal representation learning is the elevation of graph representation learning in the spatio-temporal contexts. There are some preliminary studies of spatio-temporal repre-sentation learning. For example,Yao et al.designed a matrix factorization based method with a geographic probabilistic mutual information index to jointly learn the embeddings of regions and mobility events (Yao et al. 2018). Zhang et al. proposed a skipgram based method to learn the em-beddings of locations, times, and texts (Zhang et al. 2017).
Wang et al. developed an encode-decode based method to collectively learn the embeddings of regions from multiple periodic mobility graphs that vary over days (Wang et al. 2018a).Wang et al.developed a Multi-task Representation Learning (MTRL) model to predict users’ demographic at-tributes (Wang et al. 2016b).
Urban Computing. Our work is related to the research of urban computing that aims to tackle major issues in cities by analyzing and modeling urban data(e.g., traffic flow, human mobility, and geographical data). One of the biggest challenges in urban computing is to compute with heterogeneous data (Zheng et al. 2014).Yuan et al. discov-ered regional functions of a city using POIs and taxi traces (Yuan, Zheng, and Xie 2012).Zheng et al.proposed a semi-supervised learning approach based on a co-training frame-work that consists of two separated classifiers to infer air quality (Zheng, Liu, and Hsieh 2013).Bao et al.proposed a data-driven approach to develop bike lane construction plans based on large-scale real world bike trajectory data (Bao et al. 2017).Wang et al.utilized large-scale Point-Of-Interest data and taxi flow data in the city of Chicago to infer crime rate (Wang et al. 2016a).
Conclusion Remarks
As an application, we exploited the learned embeddings to predict the mobile check-in popularity of regions. Finally, we presented extensive experiments with real-world urban region data to demonstrate the effectiveness and efficiency of our method.
Acknowledgment
This research was partially supported by the National Sci-ence Foundation (NSF) via the grant number:1755946. This research was partially supported by the University of Mis-souri Research Board (UMRB) via the proposal number:
4991.
References
Bao, J.; He, T.; Ruan, S.; Li, Y.; and Zheng, Y. 2017. Plan-ning bike lanes based on sharing-bikes’ trajectories. In Pro-ceedings of the 23rd ACM SIGKDD international confer-ence on knowledge discovery and data mining, 1377–1386. ACM.
Bengio, Y.; Lamblin, P.; Popovici, D.; and Larochelle, H. 2007. Greedy layer-wise training of deep networks. In Ad-vances in neural information processing systems, 153–160. Cheng, W.; Greaves, C.; and Warren, M. 2006. From n-gram to skipgram to concgram. International journal of corpus linguistics11(4):411–433.
Cui, P.; Wang, X.; Pei, J.; and Zhu, W. 2017. A survey on network embedding.CoRRabs/1711.08752.
Dong, Y.; Chawla, N. V.; and Swami, A. 2017. metap-ath2vec: Scalable representation learning for heterogeneous networks. InProceedings of the 23rd ACM SIGKDD In-ternational Conference on Knowledge Discovery and Data Mining, 135–144. ACM.
Grover, A., and Leskovec, J. 2016. node2vec: Scalable fea-ture learning for networks. InProceedings of the 22nd ACM SIGKDD International Conference on Knowledge Discov-ery and Data Mining.
Lawrence, S.; Giles, C. L.; Tsoi, A. C.; and Back, A. D. 1997. Face recognition: A convolutional neural-network ap-proach.IEEE transactions on neural networks8(1):98–113. Liou, C.-Y.; Cheng, W.-C.; Liou, J.-W.; and Liou, D.-R. 2014. Autoencoder for words. Neurocomputing139:84–96. Liu, H.; Li, T.; Hu, R.; Fu, Y.; Gu, J.; and Xiong, H. 2019. Joint representation learning for multi-modal transportation recommendation. InAAAI, to appear.
Mikolov, T.; Sutskever, I.; Chen, K.; Corrado, G. S.; and Dean, J. 2013. Distributed representations of words and phrases and their compositionality. InAdvances in neural information processing systems, 3111–3119.
Perozzi, B.; Al-Rfou, R.; and Skiena, S. 2014a. Deepwalk: Online learning of social representations. InProceedings of the 20th ACM SIGKDD international conference on Knowl-edge discovery and data mining, 701–710. ACM.
Perozzi, B.; Al-Rfou, R.; and Skiena, S. 2014b. Deepwalk: online learning of social representations. InThe 20th ACM SIGKDD International Conference on Knowledge Discov-ery and Data Mining.
Tang, J.; Qu, M.; Wang, M.; Zhang, M.; Yan, J.; and Mei, Q. 2015. Line: Large-scale information network embed-ding. InProceedings of the 24th International Conference on World Wide Web, 1067–1077. International World Wide Web Conferences Steering Committee.
Tang, J.; Qu, M.; and Mei, Q. 2015. Pte: Predictive text em-bedding through large-scale heterogeneous text networks. In
Proceedings of the 21th ACM SIGKDD International Con-ference on Knowledge Discovery and Data Mining. Wang, H., and Li, Z. 2017. Region representation learning via mobility flow. InProceedings of the 2017 ACM on Con-ference on Information and Knowledge Management, 237– 246. ACM.
Wang, H.; Kifer, D.; Graif, C.; and Li, Z. 2016a. Crime rate inference with big data. In Proceedings of the 22nd ACM SIGKDD international conference on knowledge discovery and data mining, 635–644. ACM.
Wang, P.; Guo, J.; Lan, Y.; Xu, J.; and Cheng, X. 2016b. Multi-task representation learning for demographic predic-tion. InEuropean Conference on Information Retrieval, 88– 99. Springer.
Wang, P.; Fu, Y.; Zhang, J.; Li, X. L.; and Lin, D. 2018a. Learning urban community structures: A collective embed-ding perspective with periodic spatial- temporal mobility graphs.ACM Transactions on Intelligent Systems and Tech-nology (TIST).
Wang, P.; Zhang, J.; Liu, G.; Fu, Y.; and Aggarwal, C. 2018b. Ensemble-spotting: Ranking urban vibrancy via poi embedding with multi-view spatial graphs. InProceedings of the 2018 SIAM International Conference on Data Mining, 351–359. SIAM.
Yao, Z.; Fu, Y.; Liu, B.; Hu, W.; and Xiong, H. 2018. Rep-resenting urban functions through zone embedding with hu-man mobility patterns. InIJCAI, 3919–3925.
Yuan, J.; Zheng, Y.; and Xie, X. 2012. Discovering re-gions of different functions in a city using human mobility and pois. InProceedings of the 18th ACM SIGKDD interna-tional conference on Knowledge discovery and data mining, 186–194. ACM.
Zhang, C.; Zhang, K.; Yuan, Q.; Peng, H.; Zheng, Y.; Han-ratty, T.; Wang, S.; and Han, J. 2017. Regions, periods, activities: Uncovering urban dynamics via cross-modal rep-resentation learning. In Proceedings of the 26th Interna-tional Conference on World Wide Web, 361–370. Interna-tional World Wide Web Conferences Steering Committee. Zheng, Y.; Capra, L.; Wolfson, O.; and Yang, H. 2014. Ur-ban computing: concepts, methodologies, and applications.
ACM Transactions on Intelligent Systems and Technology (TIST)5(3):38.