in Microscopic Blood Images Using Digital Image Processing
Farnoosh Sadeghian, Zainina Seman, Abdul Rahman Ramli,
Badrul Hisham Abdul Kahar, and M-Iqbal Saripan
Abstract
Evaluation of blood smear is a commonly clinical test these days. Most of the time, the hematologists are interested on white blood cells (WBCs) only. Digital image processing techniques can help them in their analysis and diagnosis. For example, disease like acute leukemia is detected based on the amount and con-dition of the WBC. The main objective of this paper is to segment the WBC to its two dominant ele-ments: nucleus and cytoplasm. The segmentation is conducted using a proposed segmentation framework that consists of an integration of several digital image processing algorithms. Twenty micro-scopic blood images were tested, and the proposed framework managed to obtain 92% accuracy for nu-cleus segmentation and 78% for cytoplasm segmentation. The results indicate that the proposed framework is able to extract the nucleus and cytoplasm region in a WBC image sample.
Keywords: White blood cell segmentation, Active contours, Snake algorithm, Zack thresholding.
1. Introduction
White blood cells (WBC) or leukocytes play a significant role in the diagnosis of different diseases, and therefore, extracting infor-mation about that is valuable for hematologists. In the past, dig-ital image processing techniques have helped to analyze the cells that lead to more accurate, standard, and remote disease diagnosis systems. However, there are a few complications in extracting the data from WBC due to wide variation of cells in shape, size, edge, and position. Moreover, since illumination is imbalanced, the im-age contrast between cell boundaries and the background varies depending on the condition during the capturing process.
This study is focusing on WBC segmentation using L2 micro-scopic images. Our goal is to segment the WBC nucleuses and cy-toplasm using a framework that has been developed using digital
Shulin Li (ed.),Biological Procedures Online, Volume 11, Number 1 © to the author(s) 2009
DOI: 10.1007/s12575-009-9011-2 URL:springerprotocols.com; springerlink.com
image processing. The use of image processing techniques have developed rapidly in the last few years, to the point where hema-tologists can use blood images to automatically process blood slides for the first screening in detecting diseases. These techniques can help to find cell counts in human blood automatically and also can provide information about ratio of nucleus versus cytoplasm to identify and classify different types of WBCs such as neutrophil, basophil, lymphocyte, etc. Therefore, in this paper, we present a proposed framework that consists of several methods that integra-tes together for nucleus segmentation and cytoplasm extraction.
Many works have been conducted in the area of general segmen-tation methods. Among the common segmensegmen-tation methods are edge and border detection, region growing, filtering, mathematical morphology, and watershed clustering. Ritter et al. (1) presented a fully automatic method for segmentation and border identification of all objects that do not overlap the boundary in an image taken from a peripheral blood smear slide. In their work, pale tips of pro-tuberances are lost. Ongun et al. (2) did segmentation by morpho-logical preprocessing followed by the snake-balloon algorithm. Jiang et al. (3) proposed a WBC segmentation scheme on color space images using feature space clustering techniques, scale-space filtering for nucleus extraction, and watershed clustering for cytoplasm ex-traction. Leyza et al. (4) used morphological operators and exam-ined the scale-space properties of toggle operator to improve segmentation accuracy. Scotti (5) presented the automatic morpho-logical method that is based on the morphomorpho-logical analysis of WBCs. Their proposed system extracts the morphological indexes (lympho-cytes). Kumar et al. (6) used teager energy operator for segmenta-tion, nucleus based on the edges, which are detected effectively by teager energy operator but it required at least a weak edge to exist between red blood cell (RBC) and the background. For cytoplasm segmenting, they used a simple morphological method. Cseke intro-duced multi-step segmentation scheme (7), which implements the automatic thresholding method proposed by Otsu (8).
The remainder of this paper is organized as follows. In Sec-tion2, segmentation algorithms and the framework are explained. InSection3, results obtained by the proposed framework are pre-sented, and finally, the conclusions are drawn inSection4.
2. Proposed
Framework
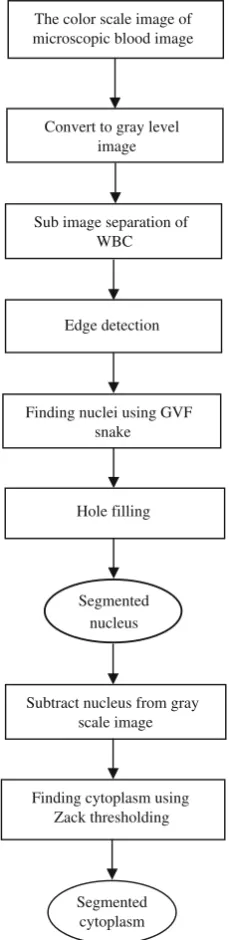
background, red cells (un-nucleated cells), white cell’s nucleus, and cytoplasm. WBC appears rather darker than the background, and red cells appear in an intermediate intensity level (6). Also, there is shape variation in cells and their nucleus.Figure1shows the proposed framework of the segmentation scheme. Basically, it
Convert to gray level image
Sub image separation of WBC
Edge detection
Finding nuclei using GVF snake
Hole filling
Subtract nucleus from gray scale image
Finding cytoplasm using Zack thresholding
Segmented nucleus
Segmented cytoplasm The color scale image of microscopic blood image
is a two-part process of WBC segmentation into nucleus and cy-toplasm after converting RGB original images to gray scale. All modules in this framework work on gray level images.
2.1. Nucleus Segmentation
Nuclei have variable shapes in different kinds of leukocytes. Find-ing a significant method for shape modelFind-ing and segmentFind-ing the nucleus has always been a challenge for scientists. Among seg-mentation methods, active contour models (snakes) have gained a lot of attention recently (9). Snakes are deformable curves that can move and change their shapes to deform to boundaries of objects in an image. Curves are defined within an image domain and can move under the influence of internal forces within the curve itself and external forces derived from the image data. The internal and external forces are defined in a way that the snake conforms to an object boundary or other desired features within an image (9,10).
Two general types of active contour models have been intro-duced: parametric (9) and geometric active contours (11). Geo-metric active contour models or geodesic snakes have been proposed to address the fact that parametric active contour mod-els cannot resolve topological changes. For our processing scheme, the segmentation is done on sub-images, so there are no topological changes since only one object of interest exists in each sub-image. In parametric snake model (11), a traditional snake is a curvex(s) defined inEq.1that moves through the spa-tial domain of an image to minimize the energy function defined inEq.2.
xðsÞ ¼½xðsÞ;yðsÞ;s 2½0;1 ½1
E¼
Z1
0 1 2 x
0ðsÞ
j j2
þjx00ðsÞj2þEextðxðsÞÞ
ds ½2
Where α and β are weighting parameters that control the snake’s tension and rigidity, respectively. x'(s) and x″(s) denote the first and second derivatives of x(s) with respect to s. The external energy function Eext is derived from the image so that it takes on its smaller values at features of interest, such as boundaries.
field v(x,y) (Eq. 3) that minimizes the energy function defined in Eq. 4.
v xð ;yÞ ¼ðu x;ð yÞ;v x;ð yÞÞ ½3
"¼ ZZ
u2xþu2y þvx2þvy2
þ
j
rfj
2j
v rfj
2%dxdy:
$
½4
Whereμis the regularization parameter, andf(x,y) represents edge map proceed from imageI(x,y) as defined inEq.5. The field ∇fhas vectors pointing toward the edges, and generally, it has a narrow capture range.
f x;ð yÞ ¼ Eexti ðx;yÞ i¼1;2;3or4 ½5
ThatEextis an external energy designed to lead an active con-tour toward step edges. For the complimentary description on the variables, the reader is referred to (11). Object boundaries play an important role in calculation of GVF. Xu and Prince defined an edge map that is larger near the edges derived from the image (11). In this study, blood cell boundaries have been extracted us-ing Canny edge detection (12). By using this method, edges occurring in image would not be missed, and there would be no responses to non-edges. The step-by-step procedure of meth-od is described as follows (13):
1. Smoothing the image with Gaussian filter to reduce noise and unwanted details with standard deviation,σ.
g x;ð yÞ ¼Gðx;yÞ f x;ð yÞ ½6
Where
G ¼ ffiffiffiffiffiffiffiffiffiffiffi1 22
p exp x2þy2
22
½7
2. Gradient calculation ofg(x,y) using any of the gradient oper-ators (Roberts (14), Sobel (15), Prewitt (16), etc.) to get:
M x;ð yÞ ¼
ffiffiffiffiffiffiffiffiffiffiffiffiffiffiffiffiffiffiffiffiffiffiffiffiffiffiffiffiffiffiffiffiffiffiffiffiffi
g2
xðx;yÞ þgy2ðx;yÞ
q
½8
And
ðx;yÞ ¼tan1 gyðx;yÞg xðx;yÞ
h i
3. ThresholdM:
MTðx;yÞ ¼ M x0ð ;yÞ if M xOtherwiseð ;yÞiT
½10
WhereTis chosen in a way that all edge elements be kept while most of the noise is suppressed. Equation10checks whether each non- zeroMT(x,y) is greater than its two neighbors along the gradi-ent directionθ(x,y). If it is,MT(x,y) will be kept unchanged; other-wise, it will be set to zero. This process is known as no maximal suppression. Next, these processes are implemented:
1. Ridge pixels are thresholded using two thresholdsT1andT2 withT1hT2. Ridge pixels with values betweenT1andT2 are weak edge pixels, and those with values larger than T2 are strong edge pixels.
2. Edges segments inT2are linked to form continuous edges. To do so, each segment inT2is traced to find its end, and its neigh-bors inT1are searched to find any edge segment inT1, which can bridge the gap until reaching another edge segment inT2.
By this edge detection method, central connected object bound-aries that represent the nucleus are clearly obtained. In next step, GVF of the images were calculated based onEq.4and used as internal and external forces to guide snakes to deform to nucleus boundary edges. Nucleus is the connected boundary in image and has been filled up (13) by following instruction to have a clear segmented nucleus:
Assumefas the marker andgas the mask. Marker must be a subset of mask,
f g ½11
We choose the marker imagefmas below:
fmðx;yÞ ¼ 10f xð ;yÞ otherwiseif xð ;yÞis on the border of f
½12
Then, we define maskgin a way to represent hole filling inf:
g¼ RfCð Þfm
c
½13
WhereR is a reconstruction offc fromfm.
2.2. Cytoplasm Segmentation
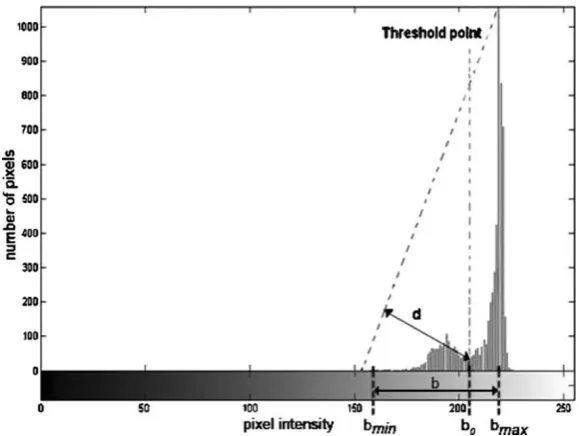
There are many thresholding techniques available in literature (13). Here, we set the threshold value based on Zack algorithm (17). According to Zack’s algorithm, in gray intensity histogram
(h[x]) of the remaining sub-image components, a line is con-structed between the highest histogram value (h[bmax]) and the lowest histogram value (h[bmin]), where bmax andbminindicate the gray level values in which the histogramh[x] reaches its max-imum and minmax-imum, respectively. The distanced between the line and the histogram valuesh[b] (wherebis the gray level values betweenbminandbmax) is computed for all values ofb. The inten-sity valuebowhere the distancedreaches its maximum defines the threshold value. This concept is better shown inFig.2. Note that the histogram values representing the subtracted area have been ignored. This technique is particularly effective when the object pixels produce a weak peak in the histogram. The output from segmentation methods are shown in the following section.
3. Results
and Discussion
This section is to assess the performance of the proposed WBC segmentation scheme. In our experiment, 20 blood images from acute leukemia cases type L2 were captured using Microscope Olympus BX51. In more details about this digital microscopy
quisition, whole system is soft imaging system with AnalySIS soft-ware. Its camera is CC-12, and magnification used ×400 for pic-tures. Amount of fields per slide acquired is quiet random, which is 2–3 field/slide and total slides are 10.
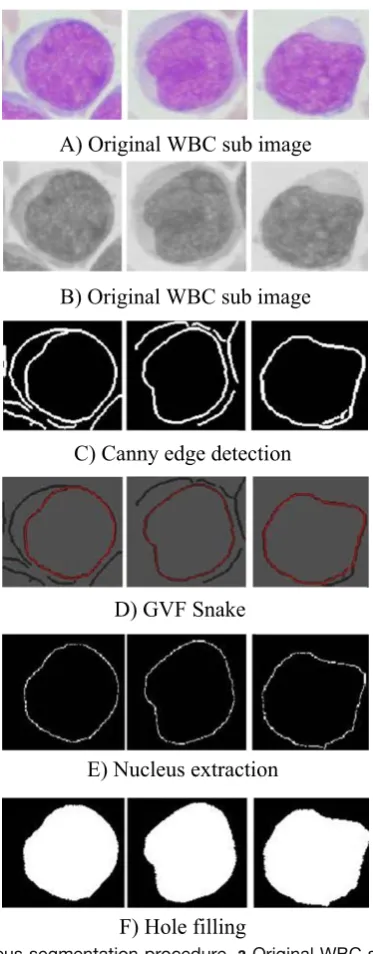
The nucleus segmentation sequence has been shown in Fig.3atof.Figure3ashows sub-image examples of white blood cells.Figure3bshows the RGB to gray scale converted images. Figure3cindicates the detected edges of the same images shown inFig.3b. Sharp changes in image brightness are very important in boundary detection. Points in the image where brightness changes significantly are often referred to as edges or edge points. As shown inFig.3b, there is a big brightness change between nu-cleus and other sub-image parts (including cytoplasm, RBC, and background). So, edge detection will result in clearly separation of nucleus boundary.
GVF deformable contour was done with suitable iterations, and the final results are shown inFig. 3d. Snake algorithm finds the connected boundary that is detected inFig. 3cand it selects the nucleus. The result has been shown inFig.3e. The connected boundaries have been filled up and shown inFig.3frepresenting the nucleus of the WBC.
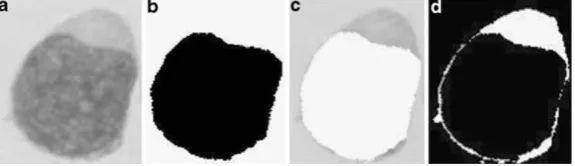
Figure4shows cytoplasm extraction result.Figure4c repre-sents the remaining components of the sub-image after nucleus subtraction. For getting nucleus subtraction, we refer toFig.3f
and then subtract it from WBC gray scale image shown in Fig.4a. The cytoplasm segmentation result based on the Zack al-gorithm is shown inFig. 4d.
Results present the advantages of our method instead of others. In nucleus segmentation, we used snake algorithm that is not related to size and color of nucleoli because there are vari-ous shapes of nucleus in a different kind of white blood cells. So, it gives high accuracy result in segmenting nucleus in any type of WBCs and in any capture illumination that cause different color space in images. Also, in a cytoplasm segmentation method in which we used the thresholding technique, background is com-pletely segmented from other components. And, based on the dif-ference between RBC color in blood image and cytoplasm area, thresholding value is easily segmented in the cytoplasm part. But, we prefer to use a sub-image that contains individual WBC to get a better result. This method is very simple with high speed and trustable accuracy.
gives useful information about WBC maturation status by finding the dimension of WBC components, nucleus and cytoplasm.
The framework has been done on sub-images to have easier implementation; this calls the major limitation in our method. In blood image, there are similar color scales in WBCS with some
A) Original WBC sub image
B) Original WBC sub image
C) Canny edge detection
D) GVF Snake
E) Nucleus extraction
F) Hole filling
Fig. 3. Nucleus segmentation procedure.aOriginal WBC sub image.b
other blood particles that cause a big error in thresholding meth-od for cytoplasm segmentation, so we individuate the WBCs in sub-image to reduce the errors. In the future, we will try to seg-ment sub-images automatically to have a WBC segseg-mentation pro-cess that is fully automated. The method has been applied to 20 images. We can calculate the percentage of the accuracy by eval-uating WBCs' component segmentation base on the comparison of our own method and manual segmentation. We get an average accuracy of 92% for nucleus segmentation and 70% for cytoplasm segmentation. Since the cytoplasm segmentation process depends on the result of the nucleus segmentation, hence, the 8% (100− 92%) error yielded by the nucleus segmentation affects directly on the cytoplasm extraction accuracy. Leaving this fact behind, the accuracy of the cytoplasm alone is 78%.
On average, there are about 55 WBCs in a typical blood smear image as explained before for our acute leukemia, type L2, sample blood images. Based on the results (92% accuracy for nucleus and 78% for cytoplasm), after applying the method on a sample image, there is a chance that some parts of the cyto-plasm and the nucleus be missed in each WBC. This comprises the 8% and 22% errors and may show its effect on estimating the ratio of nucleus and cytoplasm only. The results show significant accu-racy to be used for further analysis of blood images on detection of acute lymphoblastic leukemia or any other diseases related to WBCs.
4. Conclusions
This paper has demonstrated a proposed framework for segment-ing white blood cells ussegment-ing integration of concepts in digital image processing. The proposed scheme has two parts: The nucleus seg-mentation part is based on morphological analysis, and the
plasm segmentation is based on pixel-intensity thresholding. The results show that the proposed method is able to yield 92% accuracy for nucleus segmentation and 78% for cytoplasm segmentation.
References
1. Ritter N and Cooper J (2007) Segmentation and border identification of cells in images of peripheral blood smear slides. In Proceed-ings of the Thirtieth Australasian Confer-ence on Computer SciConfer-ence 62:161–169 2. Ongun G, Halici U, Leblebicioglu K,
Atalay V, Beksac M and Beksac S (2001) Feature extraction and classification of blood cells for an automated differential blood count system. Neural Networks. Proceedings. IJCNN '01. International Joint Conference on vol. 4:2461–2466 3. Kan Jiang, Qing-Min Liao and Sheng-Yang
Dai (2003) A novel white blood cell seg-mentation scheme using scale-space filter-ing and watershed clusterfilter-ing. Machine Learning and Cybernetics, 2003 Interna-tional Conference on, vol. 5:2820–2825 4. Dorini LB, Minetto R and Leite NJ (2007)
White blood cell segmentation using mor-phological operators and scale-space analy-sis. In SIBGRAPI '07: Proceedings of the XX Brazilian Symposium on Computer Graphics and Image Processing.
5. Scotti F (2005) Automatic morphological analysis for acute leukemia identification in peripheral blood microscope images. In 2005 IEEE International Conference on Computational Intelligence for Measure-ment Systems and Applications, 2005. CIMSA, pp. 96–101
6. Kumar BR, Joseph DK and Sreenivasc TV (2002) Teager energy based blood cell seg-mentation. Digital Signal Processing. DSP 2002 14th International Conference on, vol. 2:619–622
7. Cseke I (1992) A fast segmentation scheme for white blood cell images. In Pattern Rec-ognition. Conference C: Image, Speech
and Signal Analysis, Proceedings. 11th IAPR International Conference on vol. III:530–533
8. Otsu N (1975) A threshold selection meth-od from gray-level histograms. Automatica 11:285–296
9. Kass M, Witkin A, Terzopoulos D (1988) Snakes: active contour models. Comput Graph Image Process 1:321–331
10. Xu C, Prince JL (1998) Snakes, shapes, and gradient vector flow. IEEE Trans Image Process 7:359–369
11. Xu C and Prince J (1997) Gradient vector flow: a new external force for snakes. In 1997 IEEE Computer Society Conference on Computer Vision and Pattern Recogni-tion, 1997. Proceedings, pp. 66–71 12. Canny J (1986) A computational approach
to edge detection. IEEE Trans. Pattern Anal Mach Intell, pp. 679–698
13. Gonzalez RC, Woods RE, Eddins SL (2003) Digital image processing using MATLAB. Prentice-Hall, Upper Saddle River
14. Roberts LG (1965) Machine perception of 3-D solids. Optical and Electro-Optical In-formation Processing,pp. 159–197
15. Sobel I (1978) Neighborhood coding of bi-nary images for fast contour following and general array binary processing. Comput Graph Image Process 8:127–135
16. Prewitt JMS (1970) Object enhancement and extraction. Picture Processing and Psy-chopictorics, pp. 75–149