DEMOGRAPHIC RESEARCH
VOLUME 36, ARTICLE 63, PAGES 1917
,
1928
PUBLISHED 29 JUNE 2017
http://www.demographic-research.org/Volumes/Vol36/63/ DOI: 10.4054/DemRes.2017.36.63
Descriptive Finding
The strength and vulnerability of school-age
children
Svenn-Erik Mamelund
Bjørn Haneberg
Siri Mjaaland
© 2017 Svenn-Erik Mamelund, Bjørn Haneberg & Siri Mjaaland.
This open-access work is published under the terms of the Creative Commons Attribution NonCommercial License 2.0 Germany, which permits use, reproduction & distribution in any medium for non-commercial purposes, provided the original author(s) and source are given credit.
1 Background 1918
2 Methods 1918
3 Results 1919
4 Discussion 1922
Demographic Research: Volume 36, Article 63 Descriptive Finding
The strength and vulnerability of school-age children
Svenn-Erik Mamelund1
Bjørn Haneberg2
Siri Mjaaland2,3
Abstract
BACKGROUND
Children between the ages of 5 and 14 appear to have a lower risk of dying than both younger and older individuals.
OBJECTIVE
We looked for possible factors influencing the mortality rates of school-age children in Norway during the German occupation from 1940 to 1945, i.e., at a time of poverty and moderate food shortage – and before the general use of vaccines.
METHODS
We used Norwegian mortality data by age and sex, during the period of 1930–1954, from the Human Mortality Database and obtained the main causes of death, as well as age-specific data from different regions of Norway, from Statistics Norway.
RESULTS
Boys and girls aged 5–14 years had lower mortality rates than any other age group below 40, even during the German occupation. However, 5–14-year-old boys as well as 5–9-year-old girls had significantly increased mortality during 1941–1945 as compared to the previous decade. Mortality as a result of diphtheria, pertussis, scarlet fever, and measles increased more than five-fold, surpassing mortality as a result of accidents, whereas mortality from these infections only doubled in adults up to 39 years. During that same period, the body weight of schoolchildren aged 8–13 years dropped slightly.
CONCLUSIONS
Proper nourishment, being of the utmost importance for a functioning immune system,
1 Work Research Institute, Oslo and Akershus University College of Applied Sciences, Norway.
E-mail:[email protected].
2 Department of Infectious Disease Immunology, Division of Environmental Medicine and Infectious Disease
Control, Norwegian Institute of Public Health, Oslo, Norway.
is key to understanding the potential vulnerability of children at any age. Our study shows how vulnerable even the most resistant children can be.
CONTRIBUTION
The vulnerability of children 5–14 years old may not have been properly taken into account, as was also shown in the recent upward UN revision of 5–14 age mortality in low- and middle-income countries.
1. Background
A reduced risk of infectious diseases appears to be the main reason for a decrease in mortality in Norway after 1900 (Backer 1961), but also the key reason for the markedly improved life expectancy worldwide over the last decades (World Mortality Report 2013). Young children were hardest hit by infectious diseases before their immune systems had fully developed. On the other hand, children from 5 to 14 years of age were somehow protected from a fatal outcome of infections, despite the fact that they were the ones most often infected, e.g., by new influenza viruses (Glezen 1996; Brundage and Shanks 2008; Rizzo et al. 2010), Mycobacterium tuberculosis (Davenport 2013; Marais et al. 2004), andPlasmodium malariae (Snow and Omumbo 2006; Filipe et al. 2007). The age period from 4 to 13 has thus been called “the honeymoon period of infectious diseases,” supposedly linked to the capacity of the adaptive immune system that seems to have reached maximal strength at the age of 10 (Ahmed, Oldstone, and Palese 2007; Giuliano et al. 2007). Children around this age, moreover, have the lowest risk of dying even in today’s developing countries plagued with tropical diseases and relatively short life expectancy (World Mortality Report 2013). In order to shed light upon possible reasons for the high resistance of these school-age children, even to fatal accidents (Centers for Disease Control and Prevention 2014), we investigated mortality in Norway during the German occupation from 1940 to 1945, i.e., at a time of poverty and food shortage and before the general use of vaccines.
2. Methods
Demographic Research: Volume 36, Article 63
1961; Statistics Norway 1949a; Statistics Norway 1949b). Finally, previously published data on the development of body weights and heights of schoolchildren from the city of Oslo was permitted to be reproduced here (Brundtland, Liestøl, and Walløe 1980).
3. Results
During the five-year period from April 1940 until May 1945, when Norway was occupied by German troops, the mortality rates of Norwegian males of all age groups from 1 to 39 years were higher than during the preceding 10 years (Figure 1a). These rates deviated from the expected pattern of a near constant reduction of mortality with each time period from 1930–1934 until 1950–1954. In females, however, higher mortality rates during the occupational period, as compared to the preceding two five-year periods, were evident only for children 1–4, 5–9, and 10–14 five-years old, whereas the pattern of reduced mortality within each time period resumed from the age of 20 (Figure 1b). This was also the case in infant boys and girls, who demonstrated higher mortality than any of the other age groups investigated – the pattern of reduced mortality with time seemed largely uninterrupted during the war (Figures 1a and 1b).
Figure 1: Mortality in groups of a) boys/men and b) girls/women, from 0–1 to
35–39 years of age during five-year periods from 1930–1934 to 1950– 1954
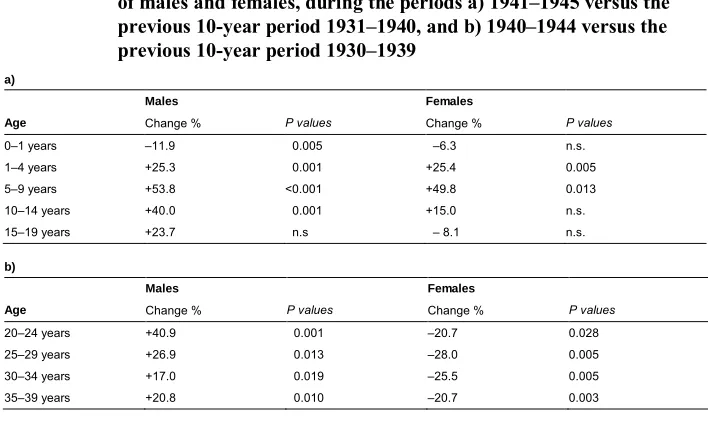
The lowest mortality rates, as compared to any other age group within the same gender, were seen in 5–9- and 10–14-year-old boys and girls, as was also clearly evident during the period from 1940 to 1944 (Figures 1a and 1b). When measuring the mortality rates year-by-year, however, 5–9-year-old boys and girls and 10–14-year-old boys had a significantly increased risk of dying during the years 1941–1945, as compared to the previous decade (Figures 2a and 2b, and Table 1a). This pattern remained also after removing from the analysis the number of age-related deaths from the county of Finnmark during the period 1942–1945 and the county of Hordaland during 1944, to avoid the impact of deportation and actions of war.
Figure 2: Mortality in groups of a) boys/male youths and b) girls/female
youths, from 1–4 to 15–19 years of age, during each year from 1930 to 1954
a)
Demographic Research: Volume 36, Article 63
Table 1: The percent increase (+) or decrease (–) of mortality rates, in groups
of males and females, during the periods a) 1941–1945 versus the previous 10-year period 1931–1940, and b) 1940–1944 versus the previous 10-year period 1930–1939
a)
Males Females
Age Change % P values Change % P values
0–1 years –11.9 0.005 –6.3 n.s.
1–4 years +25.3 0.001 +25.4 0.005
5–9 years +53.8 <0.001 +49.8 0.013
10–14 years +40.0 0.001 +15.0 n.s.
15–19 years +23.7 n.s – 8.1 n.s.
b)
Males Females
Age Change % P values Change % P values
20–24 years +40.9 0.001 –20.7 0.028
25–29 years +26.9 0.013 –28.0 0.005
30–34 years +17.0 0.019 –25.5 0.005
35–39 years +20.8 0.010 –20.7 0.003
Note: n.s. = not significant. The probability, asP-values, of higher or lower values was determined with use of the nonparametric Mann-Whitney test.
Similar increased mortality rates during the war were seen in both boys and girls 1–4 years old (Figures 2a and 2b, and Table 1a). Girls aged 10–14 and male youths aged 15–19, on the other hand, appeared to have increased mortality rates during the period 1941–1945, when measured year-by-year, but not significantly different from those of the previous 10 years. Moreover, female youths aged 15–19 showed an insignificant reduction in their mortality rates during the same war period (Table 1a).
In infants, as suggested above, the year-by-year death rates were also seemingly not influenced by the war (Figures 3a and 3b). Infant males had a significantlylower
Figure 3: Mortality in a) infant boys and b) infant girls, and in groups of c) men and d) women, from 20–24 to 35–39 years of age, during each year from 1930 to 1954
a) b)
c) d)
4. Discussion
Despite the fact that Norway was not as badly hit as many other European countries during World War II, increased mortality rates were observed in children of both sexes, as well as in adult males. Even in these times of hardship, children from 5 to 14 years of age stayed within the pattern of having lower overall mortality rates than any other age group.
Demographic Research: Volume 36, Article 63
that this action had significant impact on the mortality of school-age children in Norway. Similarly, there was little impact observed as a result of the near total destruction of the northernmost county of Finnmark, and deportation or hiding of its population, before being invaded by Soviet troops in 1944, when calculations were made collectively for the period 1941–1945.
On the other hand, infections turned out to be the most common cause of child death during that period, surpassing accidents even in 5–14-year-old boys (Backer 1961). The mortality due to so-called common infections, i.e., diphtheria, scarlet fever, pertussis, and measles increased more than five-fold in school-age children of both genders, whereas they were responsible for only a doubling of the mortality figures for adults up to 39 years of age (Backer 1961). Such infections, having a marked effect on mortality rates in all groups of children, were not surprising in those under five with an immature immune system. In 5–14-year-old children, however, they turned out to be responsible for almost one in five deaths during that period. It is likely, thus, that their immune system had in some way been affected, e.g., by the common shortage of food (Statistics Norway 1949b).
In fact, health controls of school-age children from the city of Oslo in 1943 and 1945 revealed a small and transient drop in body weight, and less so of height, compared to measurements in 1940 (Brundtland, Liestøl, and Walløe 1980). These findings were consistent for every age group from 8 to 13 (Figure 4). Moreover, postwar analyses seemed to indicate that their diets at that time had been largely deficient in fat, but not in carbohydrates or proteins (Strøm 1948).
Even though this drop in weight of children during the war was just as evident in girls as in boys (Brundtland, Liestøl, and Walløe 1980, see Figure 4), the supposed influence on the immune system in the present study seemed to be greater in boys. This is in line with findings that boys in general have higher mortality rates than girls from birth, whether it is due to infections (Muenchhoff and Goulder 2014) or accidents (Sekii et al. 2013). However, the results of this study seem to indicate that girls up to the age of 10 were equally vulnerable to this kind of strain as were boys – and that a greater resistance might be connected to the development of puberty.
Figure 4: Mean heights of a) boys and b) girls, and mean body weights of c) boys and d) girls, aged 8 to 13 years, in Oslo from 1930 to 1955
a) b)
c) d)
Note: From Brundtland, Liestøl, and Walløe (1980), with permission.
Demographic Research: Volume 36, Article 63
References
Ahmed, R., Oldstone, M.B.A., and Palese, P. (2007). Protective immunity and susceptibility to infectious diseases: Lessons from the 1918 influenza pandemic.
Nature Immunology 8(11): 1188–1193.doi:10.1038/ni1530.
Backer, J.E. (1961). Trend of mortality and causes of death in Norway 1856–1955. Oslo: Central Bureau of Statistics Norway (Samfunnsøkonomiske Studier Nr. 10).
Brundage, J.F. and Shanks, G.D. (2008). Deaths from bacterial pneumonia during the 1918–19 influenza pandemic. Emerging Infectious Diseases 14(8): 1193–1199.
doi:10.3201/eid1408.071313.
Brundtland, G.H., Liestøl, K., and Walløe, L. (1980). Height, weight and menarcheal age of Oslo schoolchildren during the last 60 years. Annals of Human Biology
7(4): 307–322.doi:10.1080/03014468000004381.
Centers for Disease Control and Prevention (2014). Ten leading causes of death by age group, United States – 2014 [electronic resource]. Atlanta: National Center for Injury Prevention and Control. www.cdc.gov/injury/images/lc-charts/leading_ causes_of_injury_deaths_unintentional_injury_2014_1040w740h.gif
Davenport, R.J. (2013). Year of birth effects in the historic decline of tuberculosis mortality: A reconsideration. PLoS One 8(12): e81797. doi:10.1371/journal. pone.0081797.
Filipe, J.A.N., Riley, E.M., Drakeley, C.J., Sutherland, C.J., and Ghani, A.C. (2007). Determination of the process driving the acquisition of immunity to malaria using a mathematical transmission model. PLoS Computational Biology 3(12): 2569–2579.doi:10.1371/journal.pcbi.0030255.
Giuliano, A.R., Lazcano-Ponce, E., Villa, L., Nolan, T., Marchant, C., Radley, D., Golm, G., McCarroll, K., Yu, J., Esser, M.T., Vuocolo, S.C., and Barr, E. (2007). Impact of baseline covariates on the immunogenicity of a quadrivalent (Types 6, 11, 16, and 18) human papillomavirus virus-like-particle vaccine.
Journal of Infectious Diseases196: 1153–1162.doi:10.1086/521679.
Glezen, W.P. (1996). Emerging infections: Pandemic influenza.Epidemiologic Reviews
Demographic Research: Volume 36, Article 63
Hill, K., Zimmerman, L., and Jamison, D.T. (2015). Mortality risks in children aged 5– 14 years in low-income and middle-income countries: A systematic empirical analysis.The Lancet Global Health 3(10): e609–e616.doi:10.1016/S2214-109X (15)00044-3.
Human Mortality Database (2014). Berkeley: University of California and Rostock: Max Planck Institute for Demographic Research. www.mortality.org
Marais, B.J., Gie, R.P., Schaaf, H.S., Hesseling, A.C., Obihara, C.C., Nelson, L.J., Enarson, D.A., Donald, P.R., and Beyers, N. (2004). The clinical epidemiology of childhood pulmonary tuberculosis: A critical review of literature from the pre-chemotherapy era.International Journal of Tuberculosis and Lung Disease8(3): 278–285.
Mathers, C. (2015). Deaths of older children: What do the data tell us? The Lancet Global Health 3(10): e579–e580.doi:10.1016/S2214-109X(15)00094-7.
Muenchhoff, M. and Goulder, P.J.R. (2014). Sex differences in pediatric infectious diseases. Journal of Infectious Diseases 209(Suppl. 3): S120–S126.
doi:10.1093/infdis/jiu232.
Rizzo, C., Rota, M.C., Bella, A., Giannitelli, S., De Santis, S., Nacca, G., Pompa, M.G., Vellucci, L., Salmaso, S., and Declich, S. (2010). Response to the 2009 influenza A(H1N1) pandemic in Italy.Eurosurveillance15(49): pii=19744. Rytter, M.J.H., Kolte, L., and Briend, A. (2014). The immune system in children with
malnutrition: A systematic review. PLoS One 9(8): e105017. doi:10.1371/ journal.pone.0105017.
Sekii, H., Ohtsu, T., Shirasawa, T., Ochiai, H., Shimizu, T., and Kokaze, A. (2013). Childhood mortality due to unintentional injuries in Japan, 2000–2009.
International Journal of Environmental Research and Public Health 10: 528– 540.doi:10.3390/ijerph10020528.
Snow, R.W. and Omumbo, J.A. (2006). Malaria. In: Jamison, D.T., Feachem, R.G., Makgoba, M.W., Bos, E.R., Baingana, F.K., Hofman, K.J., and Rogo, K.O. (eds.). Disease and mortality in sub-Saharan Africa. Washington, D.C.: World Bank: 1–26.
Statistics Norway (1949a).Mouvement de la population pendant les années 1942, 1943, 1944, 1945. Oslo: Statistics Norway.
Strøm, A. (1948). Examination into the diet of Norwegian families during the war-years 1942–1945.Acta Medica Scandinavica 13(Suppl. 214): 3–47.
Winter, J.M. (1977). The impact of the First World War on civilian health in Britain.
Economic History Review 30(3): 487–507.doi:10.2307/2594880.