METHODOLOGY
Optimisation approaches for concurrent
transmitted light imaging during confocal
microscopy
David A. Collings
*Abstract
Background: The transmitted light detectors present on most modern confocal microscopes are an under-utilised tool for the live imaging of plant cells. As the light forming the image in this detector is not passed through a pinhole, out-of-focus light is not removed. It is this extended focus that allows the transmitted light image to provide cel-lular and organismal context for fluorescence optical sections generated confocally. More importantly, the transmit-ted light detector provides images that have spatial and temporal registration with the fluorescence images, unlike images taken with a separately-mounted camera.
Results: Because plants often provide difficulties for taking transmitted light images, with the presence of pigments and air pockets in leaves, this study documents several approaches to improving transmitted light images beginning with ensuring that the light paths through the microscope are correctly aligned (Köhler illumination). Pigmented sam-ples can be imaged in real colour using sequential scanning with red, green and blue lasers. The resulting transmitted light images can be optimised and merged in ImageJ to generate colour images that maintain registration with con-current fluorescence images. For faster imaging of pigmented samples, transmitted light images can be formed with non-absorbed wavelengths. Transmitted light images of Arabidopsis leaves expressing GFP can be improved by con-current illumination with green and blue light. If the blue light used for YFP excitation is blocked from the transmitted light detector with a cheap, coloured glass filters, the non-absorbed green light will form an improved transmitted light image. Changes in sample colour can be quantified by transmitted light imaging. This has been documented in red onion epidermal cells where changes in vacuolar pH triggered by the weak base methylamine result in measur-able colour changes in the vacuolar anthocyanin.
Conclusions: Many plant cells contain visible levels of pigment. The transmitted light detector provides a useful tool for documenting and measuring changes in these pigments while maintaining registration with confocal imaging. Keywords: Anthocyanin, Confocal microscopy, Green fluorescent protein, Köhler illumination, Plant pigments, Quantification, Real colour imaging, Transmitted light detector
© 2015 Collings. This article is distributed under the terms of the Creative Commons Attribution 4.0 International License (http:// creativecommons.org/licenses/by/4.0/), which permits unrestricted use, distribution, and reproduction in any medium, provided you give appropriate credit to the original author(s) and the source, provide a link to the Creative Commons license, and indicate if changes were made. The Creative Commons Public Domain Dedication waiver (http://creativecommons.org/publicdomain/ zero/1.0/) applies to the data made available in this article, unless otherwise stated.
Background
Recent decades have seen a revolution in the imaging of living plant cells, with the expression of green fluorescent protein targeted to almost all locations within the plant cell [1] through different protocols including transient particle bombardment [2–4], virus-mediated infection [5, 6] and stable Agrobacterium-based transformations
[7]. GFP expression has been visualised with advances in microscopy including the advent on confocal and two photon microscopy [8–10] and the more recent arrival of super-resolution imaging [11–13] and light sheet micros-copy [14, 15]. These fluorescence techniques typically use microscopes in the epifluorescence configuration in which the excitation and emission light is delivered and collected through the same lens. In this configuration, the light transmitted through the sample can also be collected with the condenser lens and imaged with a transmitted
Open Access
*Correspondence: [email protected]
light detector, and most confocal microscopes are now equipped with transmitted light detectors. Importantly, images detected by the transmitted light detector are recorded concurrently with confocal images meaning that they have both spatial and temporal registration with the confocal images. As a consequence of this, these transmit-ted light detector images can be combined with the fluo-rescence images into overlays in ways not possible with photographs taken with an external camera [16].
The optics of the transmitted light detector requires that the light passing through the sample to be collected by the condenser lens (rather than an objective lens), and focussed through the condenser and field irises, trav-elling in the reverse direction to normal, transmitted light illumination. An insertable mirror then reflects the transmitted light to the detector mounted in a conjugate plane to the lamp filament [17]. Thus, focus adjustments and modifications to the settings of these diaphragms will affect image formation. The image is non-confocal and contains out-of-focus light as it is formed by light that does not pass through a pinhole, but is does provide context for confocal fluorescence observations. Various forms of transmitted light microscopy can be achieved in association with confocal microscopy, including bright-field, polarised light, phase contrast and differential inter-ference contrast [16]. Moreover, as these detectors do not detect the wavelength of the incident light, information about the wavelengths of light being absorbed by the sample is not recovered by the conventional transmitted light detector. For plant cells, which are often highly pig-mented [18–20], this represents a loss of information.
Published confocal fluorescence microscopy images often show adjacent transmitted light images, or a super-imposition of the fluorescence onto the transmitted light images. While fluorescence imaging is normally optimised, transmitted light imaging is often neglected: published images can often show excellent confocal microscopy but poor quality transmitted light images.
In this article, several approaches are documented for improving transmitted light imaging during confo-cal microscopy of plant cells. First, the need to optimise the transmitted light image with Köhler illumination is emphasised. Subsequently, a novel method to generate colour transmitted light images is demonstrated along with approaches to maximise image ‘resolution’ by using non-absorbed wavelengths. And finally, it is demon-strated that transmitted light image can be quantified to give meaningful and useful data.
Results and discussion
The importance of Köhler illumination
Onion (Allium cepa) epidermal peels containing cells that were transiently expressing a cytosolic YFP following
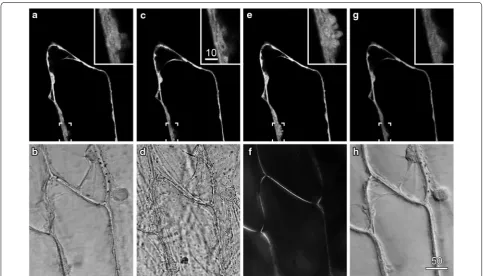
particle bombardment [21] were imaged by confocal flu-orescence microscopy and concurrent transmitted light imaging (Fig. 1). The fluorescence image was optimised, and showed standard cytoplasmic configurations includ-ing peripheral cytoplasm around a central vacuole, and transvacuolar strands (Fig. 1a). The concurrent transmit-ted light image was optimised by setting the conventional transmitted light optics for Köhler illumination: this reduced the depth of field of the transmitted light image so that cellular structure within the plane of focus were more evident (Fig. 1b).
To set Köhler illumination, the following steps were adjustments were made while the sample was imaged with microscope using conventional transmitted light illumination [22–25]:
1. The field diaphragm was closed down.
2. The condenser lens was focussed so that the edges of the field diaphragm were brought into focus.
3. The condenser lens was centred.
4. The field diaphragm was opened so that the field of view was fully illuminated.
5. The condenser diaphragm was full opened.
These settings brought the microscope into Köhler illu-mination in which regular transmitted illuillu-mination is fully de-focused and even across the entire field-of-view. These settings are also appropriate for the transmitted light detection system associated with confocal micros-copy because they will maximise collection of light, max-imise the aperture of the microscope system reducing the depth-of-field, and minimise image vignetting [17]. In comparison to the optimised transmitted light image in which cytoplasmic architecture was evident (Fig. 1b), an image collected with the condenser defocused and stopped down had a poorly defined cytoplasm, showed high contrast and had a large depth-of-field in which cel-lular debris from the mesophyll layer, produced during the peeling process, were visible (Fig. 1d). Importantly, as the adjustments to set Köhler illumination all occurred to the light path after transmission through the sample, the concurrently-recorded fluorescence images were unaf-fected (except for small differences generated by cyto-plasmic streaming) (Fig. 1c).
and has previously been used in conjunction with con-focal imaging to look at secondary wall development in orchid roots [27, 28]. By contrast, DIC (differential inter-ference contrast) imaging, which introduces a prism into the imaging path prior to the samples that splits the illu-mination light into two beams [22, 23], greatly improves the visibility of organelles and cellular contents in onion epidermis (Fig. 1g), but can cause changes in the fluo-rescence image. In our confocal system (but not in some other systems that have been tested), DIC resulted in a reduction in fluorescence image intensity and a loss in image sharpness at higher zoom settings (compare insets in Fig. 1g with insets in Fig. 1a, c, e). This meant that DIC images are best recorded subsequent to fluores-cent images even though this results in a loss of temporal registration.
Colour transmitted light imaging and confocal microscopy
Plant cells can contain many different pigment mol-ecules, often at concentrations that are sufficient to be visible by transmitted light microscopy. While a col-our camera can record transmitted light images (Fig. 2, left panel), these images will be spatially and temporally
distinct from confocal images of the same cells. Not only will the camera record a different area to the confocal image, and perhaps a different image plane if there are parfocality problems, but because it takes time to switch between the different imaging modes, the cellular con-tents may have moved. Therefore, the use of the confocal microscope’s transmitted light detector is beneficial as this provides image registry. Moreover, it is also possible for monochrome transmitted light detectors to record images that are, effectively, in colour through the addi-tion of images recorded sequentially with the red, green and blue lasers [21].
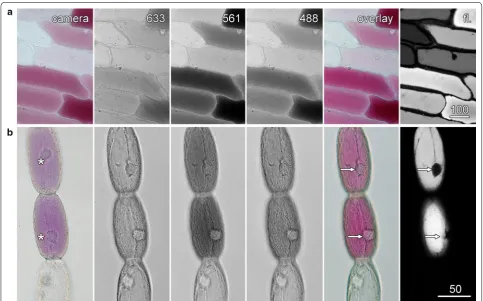
Anthocyanin in the vacuole of red onion epidermal and
Tradescantia stamen hair cells was imaged by a conven-tional colour camera (Fig. 2; left column), and by fluo-rescence (right column) with the confocal microscope. Separate, non-confocal images were also recorded with the confocal system’s transmitted light detector using the 633 nm red laser, the 561 nm green laser and the 488 nm blue laser.
collected in frame-by-frame mode, in which the imaging laser scans the entire image before being switched to the next imaging laser, or in line-by-line mode in which sin-gle lines of the image are collected sequentially for each laser before moving on to the next line of the image. For living plant cells, which often show dynamic cytoplasmic streaming, line-by-line imaging is preferable for generat-ing the red, green and blue transmitted light images as it improves the alignment of the three images: in frame-by-frame imaging, streaming can result in movement between the individual images. The use of line-by-line scanning, however, imposes a significant limitation on the transmitted light detector, as the detector’s offset and gain settings cannot be modified for the different lasers. Instead, it is necessary to modulate laser strength to gen-erate red, green and blue images of roughly even inten-sities. For our Leica SP5 confocal, laser powers of about 100, 30 and 3 % provide a balanced composite image when summed from the 633, 561 and 488 nm lasers, respectively, although these values will vary between confocal microscopes because of differences in the type
and age of the lasers. In such cases, the easiest way to bal-ance the lasers is to optimise the transmitted light image for the weakest laser (typically the 633 nm red laser). The gain on the transmitted light detector is then set so that the background just reaches saturation, identifiable using an appropriate look-up-table. The power of the remain-ing two lasers can then be adjusted so that they too give images that just reach saturation. Lowering the transmit-ted light detector gain should then give red, green and blue transmitted light images of approximately equal intensities in which variations between the images corre-spond to the absorbance of light by the sample.
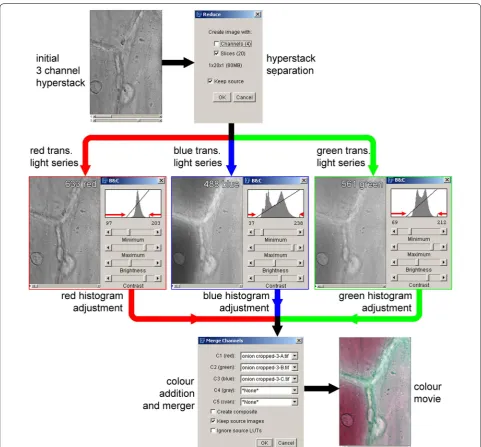
image stacks representing the 633 nm red, 561 nm green and 488 nm blue transmitted light images, along with any fluorescence images, using the ‘reduce dimensional-ity’ command in the ‘hyperstacks’ option of the ‘image’ menu. The transmitted light images can then be recom-bined into a colour image using the ‘merge channels’
command found under the ‘color’ option in the ‘image’ menu (Fig. 3).
In the onion epidermal and Tradescantia stamen hair cells, this type of imaging generated 3 colour-specific transmitted light images in which the anthocyanic cells strongly absorbed both blue and green light, but did not
absorb red light (Fig. 2). When merged to produce col-our images, these matched those taken with the colcol-our camera (Fig. 2, overlay). Importantly, these images were in register in both time and space with confocal fluores-cence images (Fig. 2, fl.). This was best demonstrated by the nuclei in the Tradescantia cells that were in the same location in the colour transmitted light and fluorescence images, but which were in different locations in the col-our camera image because of the highly active cytoplas-mic streaming present in these cells (arrows).
ImageJ can also be used to correct images collected when the lasers and the three resulting transmitted light images were not well balanced. Imaging under these con-ditions results in a coloured background and incorrect representations of coloured objects within the sample. This correction process, shown in Fig. 3, involves nor-malising the image histogram, the graphic representation that shows the distribution of the number of pixels with different intensities within the image. This process can either be run on merged colours images or on the indi-vidual images prior to merger. To colour balance before merging the images requires adjusting the image histo-gram with the ‘brightness and contrast’ command in the ‘adjust’ option in the ‘image’ menu. The sliders for the minimum and maximum value need to be adjusted to match the visible edges of the histogram, as shown by the red arrows in Fig. 3. To colour balance an already merged image, the ‘color balance’ command in the ‘adjust’ option in the ‘image’ menu is required. The image histogram is then adjusted for each colour (red, green and blue). It is, however, necessary to ‘apply’ any adjustments made in one colour before moving to the next colour. An advan-tage of working with already merged images is that this allows a comparison of the overall colours to be observed while the changes are being made. The adjustments to the image histogram introduced by ImageJ are linear modifi-cations, and are usually all that are required to generate a satisfactory colour recombination. More complex and precise methods for image histogram modification and colour balancing, often involving non-linear modification to the histogram, are discussed in reviews of image pro-cessing (see, for example pages 274 onwards in [29]).
Several further suggestions on colour transmitted light imaging with confocal microscopy can be made:
1. Image collection is slow, especially if multiple fluores-cence channels are also recorded using different laser powers, so image optimisation is best at low resolu-tion (e.g. 256 × 256 pixels) with only final images and movies recorded at higher resolutions.
2. Colour imaging in the transmitted light mode is also useful for fixed and stained samples [30] where the maintenance of spatial registration remains
impor-tant even if temporal registration is not longer prob-lematic. In fixed samples, the frame-by-frame option for sequential scanning may provide slightly faster imaging, along with the added advantage that gain values can be individually optimised for the red, green and blue lasers.
This approach to colour transmitted light imaging in confocal microscopy, via use of sequential scanning of red, green and blue lasers, does not appear to have been previously used although colour reflected light confocal microscopy, based on the addition of red, green and blue lasers has previously been described [31]. This additive approach to colour generation appears to be different to a previous approach to real-colour transmitted light imaging: some versions of the Bio-Rad MRC1000 confo-cal system had a colour transmitted light detector that worked by passing light through red, green and blue fil-ters in front of the detector [16, 32].
Optimising the wavelength for transmitted light imaging
In many cases, it is neither necessary nor desirable to col-lect colour transmitted light images. However, in imaging pigmented or thicker samples where light transmission may be poor, consideration should be given to the correct wave-length with which to record the transmitted light images.
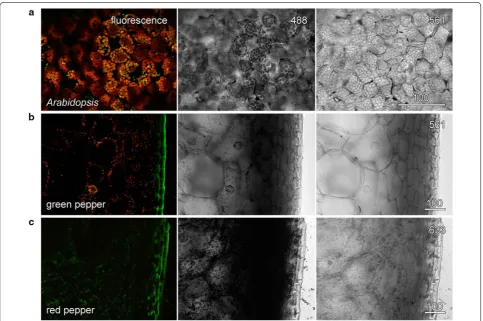
The use of coloured filters was also tested using hand sections through the pericarp (outer, firm layer) of green and red peppers (Capsicum annum). In both cases, the 488 nm blue laser was strongly absorbed by chlorophyll or lycopene in the plastids. Transmitted light imaging of green pepper required the 561 nm green laser and the orange filter (Fig. 4b) whereas the 633 nm red laser and a red filter were used for good transmitted light imaging of the red pepper (Fig. 4c). The 633 nm laser, having a lower energy, is less likely to cause tissue damage. Another instance in which coloured filters have been useful for transmitted light imaging is in the elimination of laser noise, sometimes present with older lasers. The use of the stable 633 nm red laser, and either a red or orange filter, can overcome such problems.
Improving light transmission in plant samples
The use of an appropriate wavelength is not the only way that transmitted light images can be improved in
thick plant samples. The irregular air spaces within plant leaves present around mesophyll cells diffract light as it passes through the leaf, and reduce the quality of trans-mitted light images by eliminating air spaces, either with water [33, 34] or perfluorcarbon oils [35, 36], refraction is reduced and transmission increased.
improved imaging of simple systems such as onion epi-dermal peels. When small gas bubbles caught on the surface cuticle layer of the epidermis where removed, transmitted light imaging improved.
Quantification of transmitted light images can reveal further information
Colour transmitted light imaging on the confocal micro-scope was refined for imaging red onion epidermal cells [21] where multiple-wavelength transmitted light images have quantified anthocyanin development and func-tion [37, 38]. In these studies, vacuolar anthocyanin was measured as the ratio of the transmitted light image intensities recorded with the non-absorbed 633 nm red laser divided by the absorbed 561 nm green laser. How-ever, all the laser wavelengths contain information about the anthocyanin content within the vacuole and, moreo-ver, information about the vacuole itself.
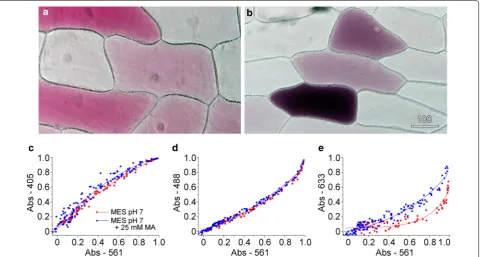
As anthocyanins show pH-dependent changes in col-our, typically shifting from red to blue as pH increases [19, 20], pH responses in the vacuole were triggered and measured. The pH of the vacuole can be modulated by the addition of membrane-permeant exogenous weak bases such as methylamine. Being uncharged, methylamine crosses through the plasma membrane and tonoplast but is acidified on entering the vacuole. The accumulation of protonated methylamine within the vacuole reduces the H+ concentration in the vacuole transiently making the vacuolar pH less acidic, although the cell can recover an acidic vacuole over time [39, 40]. Transmitted light images were recorded at 6 different wavelengths (in 2 groups of 3) for red onion inner epidermal cells that had patches of anthocyanic cells. The images at 488, 561 and 633 nm could be used to generate colour transmitted light images that demonstrated the variable nature of the red patterning (Fig. 6a). Absorption values were calculated
Table 1 Transmission rates for colour photographic filters
Transmission rates were calculated as the percentage transmission through filters compared to control values without filters. Values are means of four replicates, with SEM values shown for transmission rates above 5 %
Laser wavelength (nm) Red (Hoya 25A) Orange (Marumi MC-YA2) Yellow (Hoya K2) Green (Hoya G)
405 0.1 0.1 0.1 0.1
458 0.1 0.2 0.2 2.3
476 0.2 0.2 0.6 10.9 ± 0.3
488 0.1 0.1 24.5 ± 0.8 19.7 ± 0.6
496 0.1 0.1 58.2 ± 1.5 27.5 ± 1.0
514 0.1 0.5 84.5 ± 2.2 43.9 ± 1.8
561 0.1 33.0 ± 1.1 90.2 ± 1.6 38.5 ± 1.2
633 93.4 ± 2.8 93.9 ± 2.8 89.4 ± 1.6 3.3
for all 6 wavelengths for the vacuole of each cell. When absorbance values that were measured for control cells for 405 nm violet (Fig. 6c), 488 nm blue (Fig. 6d) and 633 nm red light (Fig. 6e) were plotted against the absorbance val-ues for 561 nm green light, tight correlations were always observed. The other wavelengths measured (456 and 514 nm) showed similar correlations (data not shown). As would be expected for the presence of a single main pig-ment in the vacuole, these correlations were linear except at very high absorbance when linearity was lost.
When red onion was floated on 25 mM methylamine at pH 7, the epidermal peels rapidly changed from red to dark blue or black. Colour transmitted light imaging confirmed the colour change with cells showing a darker and bluer appearance. Quantification of absorbance ratios showed no or limited changes at 405 and 488 nm, respectively (Fig. 6c, d) but significant increases in absorption at 633 nm (Fig. 6e) consistent with cells being less red. Cells remained alive dur-ing these treatments and cytoplasmic streamdur-ing continued.
Conclusions
This paper has described ways in which transmitted light imaging can be optimised (Köhler illumination) and extra
information gathered (use of non-absorbed wavelengths for imaging, generation of coloured images). Applicability of absorption measurements has also been demonstrated, initially at a small range of wavelengths. The development of tuneable, visible wavelength lasers (white light lasers) ([41], http://www.leica-microsystems.com/science-lab/ white-light-laser) covering from 470 to 650 nm opens up prospects of cellular level, micro-spectroscopy, a pro-cess that might prove to be extremely useful for coloured plant specimens.
Methods
Microscopy
microscope slides. Onion epidermis was mounted with it cuticle towards the lens and Arabidopsis leaves mounted with their upper, adaxial surface towards the lens. Fluo-rescence images for GFP, YFP and carotenoids were col-lected using 488 nm excitation, with emission from 500 to 550 nm, while red fluorescence from anthocyanin and chlorophyll was excited at 561 and 488 nm, with emission set to 570–620 and 650–700 nm respectively. Images were recorded at high resolution (either 1024 or 2048 pixels square) using 4-fold or higher line averaging.
For excitation with multiple wavelengths and the gen-eration of wavelength-specific transmitted light images, sequential imaging was used in line-by-line mode. Each line of the image was recorded with one laser line, and then subsequently re-recorded with one or more dif-ferent wavelengths. Alternatively, multiple excitation wavelengths could be used with one or more of these wavelengths filtered from the light path after it had passed through the sample but before it reached the transmitted light detector through the addition of col-oured glass filters. These colcol-oured glass filters were pur-chased second-hand from local camera stores.
Image modifications
All image modifications used standard brightness, con-trast and gamma settings in Photoshop (version CS4, Adobe Systems, San Jose, CA, USA) and ImageJ (FIJI installation of version 1.47v, National Institute of Health, Bethesda, MD, USA). Image intensities were quantified from image stacks in ImageJ by selecting a region (usu-ally the vacuole) with quantification using the ‘Plot Z axis profile’ function.
Plant material
Red onions and peppers were bought from local super-markets, with transient gene expression of cytosolic YFP in onion epidermal cells conducted as previously described [21]. Epidermal peels were prepared from 10 to 15 mm square pieces of inner epidermis by carefully lifting the epidermis away from the underlying mesophyll with a pair of tweezers. For pH modification experiments, epidermal peels were floated on a solution of 25 mM methylamine in 40 mM MES at pH 7.0 (5–10 min) and then mounted in this solution. Controls were pretreated and mounted with the MES buffer only.
Flowers from Tradescantia sp. were collected from plants grown in the University greenhouses. Arabidop-sis thaliana lines expressing YFP targeted to the ER and plastids was obtained from the Arabidopsis Stock Center (lines CS16252 and CS16267 [42]). Seed was surface sterilised and sown on 1.2 % agar plates containing 3 % sucrose and Hoagland’s solution, and plants were grown at 21 °C under 24 h light (100 µE m−2). Expanding leaves
were used when the plants were 2 weeks old. To de-gas the young leaves, entire leaves were placed in 1.5 ml Eppendorf tubes which had a hole punched in the lid and which were completely filled with water. Closing the lid forced the leaf sample into the liquid. Water was forced into the leaves by pulling a vacuum (2 × 5 min).
Experiments with genetically modified plants were car-ried out in accordance with New Zealand regulations, and under permits GMC08010 and GMD08056.
Acknowledgements
Research within the author’s laboratory has been supported by the School of Biological Sciences and the Biomolecular Interaction centre at the University of Canterbury. Thanks are directed to Dr. Rosemary White (CSIRO Plant Indus-try, Canberra) for discussion and comments on the manuscript, Professor Guy Cox (The University of Sydney) for discussions on the optics of the transmit-ted light detector, and to Daryl Webb (Research School of Biology, Australian National University, Canberra) for help in developing the coloured transmitted light imaging method.
Compliance with ethical guidelines
Competing interests
The author declares that he has no competing interests.
Received: 2 June 2015 Accepted: 10 August 2015
References
1. Mathur J (2007) The illuminated plant cell. Trends Plant Sci 12:506–513 2. Silverstone AL, Ciampaglio CN, Sun T-P (1998) The Arabidopsis RGA gene
encodes a transcriptional regulator repressing the gibberellin signal transduction pathway. Plant Cell 10:155–169
3. von Arnim AG, Deng X-W, Stacey MG (1998) Cloning vectors for the expression of green fluorescent protein fusion proteins in transgenic plants. Gene 221:35–43
4. Marc J, Granger CL, Brincat J, Fisher DD, Kao T-H, McGrubbin AG, Cyr RJ (1998) A GFP-MAP4 reporter gene for visualizing cortical microtubule rearrangements in living epidermal cells. Plant Cell 10:1927–1939 5. Baulcombe DC, Chapman S, Santa Cruz S (1995) Jellyfish green
fluores-cent protein as a reporter for virus infections. Plant J 7:1045–1053 6. Heinlein M, Epel BL, Padgett HS, Beachy RN (1995) Interaction of
tobamovirus movement proteins with the plant cytoskeleton. Science 270:1983–1985
7. Haseloff J, Siemering KR, Prasher DC, Hodge S (1997) Removal of a cryptic intron and subcellular localization of green fluorescent protein are required to mark transgenic Arabidopsis plants brightly. Proc Natl Acad Sci USA 94:2122–2127
8. Hepler PK, Gunning BES (1998) Confocal fluorescence microscopy of plant cells. Protoplasma 201:121–157
9. Blancaflor EB, Gilroy S (2000) Plant cell biology in the new millennium: new tools and new insights. Am J Bot 87:1547–1560
10. Feijó JA, Moreno N (2004) Imaging plant cells by two-photon excitation. Protoplasma 223:1–32
11. Gutierrez R, Grossmann G, Frommer WB, Ehrhardt DW (2010) Opportu-nities to explore plant membrane organization with super-resolution microscopy. Plant Physiol 154:463–466
12. Fitzgibbon J, Bell K, King E, Oparka K (2010) Super-resolution imaging of plasmodesmata using three-dimensional structured illumination micros-copy. Plant Physiol 153:1453–1463
14. Maizel A, von Wangenheim D, Federici F, Haseloff J, Stelzer EHK (2011) High resolution live imaging of plant growth in near physiological bright conditions using light sheet fluorescence microscopy. Plant J 68:377–385 15. Sena G, Frentz Z, Birnbaum KD, Leibler S (2011) Quantitation of cellular
dynamics in growing Arabidopsis roots with light sheet microscopy. PLoS One 6:e21303
16. Paddock SW (1999) Confocal laser scanning microscopy. Biotechniques 27:992–1004
17. Moreno N, Feijó JA, Cox G (2004) Implementation and evaluation of a detector for forward propagated second harmonic signals. Micron 35:721–724
18. Lee DW (2007) Nature’s palette. The science of plant color. University of Chicago Press, Chicago
19. Tanaka Y, Sasaki N, Ohmiya A (2008) Biosynthesis of plant pigments: anthocyanins, betalains and carotenoids. Plant J 54:733–749
20. Sasaki N, Nakayama T (2015) Achievements and perspectives in biochem-istry concerning anthocyanin. Plant Cell Physiol 56:28–40
21. Wiltshire EJ, Collings DA (2009) New dynamics in an old friend: dynamic tubular vacuoles radiate through the cortical cytoplasm of red onion epidermal cells. Plant Cell Physiol 50:1826–1839
22. Inoué S, Spring KR (1997) Video microscopy, the fundamentals, 2nd edn. Plenum Press, New York
23. Foster B (1997) Optimizing light microscopy for biological and clinical laboratories. Kendall Hunt, Dubuque
24. Nolte A, Pawley JB, Höring L (2006) Non-laser light sources for three-dimensional microscopy. In: Pawley JB (ed) Handbook of biological confocal microscopy, 3rd edn. Springer, New York, pp 126–144 25. Centonze V, Pawley JB (2006) Tutorial on practical confocal microscopy
and use of the confocal test specimen. In: Pawley JB (ed) Handbook of biological confocal microscopy, 3rd edn. Springer, New York, pp 627–649 26. Gratton E, vande Ven MJ (1995) Laser sources for confocal microscopy.
In: Pawley JB (ed) Handbook of biological confocal microscopy. Plenum Press, New York, pp 69–97
27. Idris NA, Collings DA (2014) Cell wall development in the velamen layer of the orchid Miltoniopsis investigated by confocal microscopy. Malays J Micro 10:20–26
28. Idris NA, Collings DA (2015) The life of phi: the development of phi thickenings in roots of the orchids of the genus Miltoniopsis. Planta 241:489–506
29. Russ JC (2007) The image processing handbook, 5th edn. Taylor and Francis, Boca Raton
30. Thomas J, Ingerfeld M, Nair H, Chauhan SS, Collings DA (2013) Pontamine fast scarlet 4B: a new fluorescent dye for visualising cell wall organisation in radiata pine tracheids. Wood Sci Technol 47:59–75
31. Cogswell CJ, Hamilton DK, Sheppard CJR (1992) Colour confocal reflec-tion microscopy using red, green and blue lasers. J Microsc 165:103–117 32. Pawley JB (1995) Appendix 2: light paths of current commercial confocal
light microscopes for biology. In: Pawley JB (ed) Handbook of biological confocal microscopy, 2nd edn. Plenum Press, New York, pp 581–598 33. Cheng P-C, Lin B-L, Kao F-J, Gu M, Xu M-G, Gan X, Huang M-K, Wang Y-S
(2001) Multi-photon fluorescence microscopy—the response of plant cells to high intensity illumination. Micron 32:66–669
34. Cheng P-C (2006) Interaction of light with botanical specimens. In: Pawley JB (ed) Handbook of biological confocal microscopy, 3rd edn. Springer, New York, pp 414–441
35. Littlejohn GR, Gouveia JD, Edner C, Smirnoff N, Love J (2010) Perfluoro-decalin enhances in vivo confocal microscopy resolution of Arabidopsis thaliana mesophyll. N Phytol 186:1018–1025
36. Littlejohn GR, Mansfield JC, Christmas JT, Witterick E, Fricker MD, Grant MR, Smirnoff N, Everson RM, Moger J, Love J (2014) An update: improve-ments in imaging perfluorocarbon-mounted plant leaves with implica-tions for studies of plant pathology, physiology, development and cell biology. Front Plant Sci 5:140
37. Wiltshire EJ, Eady CC, Collings DA (2015) Induction and inhibition of anthocyanin in the inner epidermis of red onion leaves by environmen-tal stimuli, and through transient expression of transcription factors. In preparation
38. Collings DA (2015) Anthocyanin in the vacuole of red onion epidermal cells quenches other fluorescent molecules. In preparation
39. Brauer D, Uknalis J, Triana R, Tu S-I (1997) Effects of external pH and ammonium on vacuolar pH in maize roothair cells. Plant Physiol Biochem 35:31–39
40. Roos W, Evers S, Heike M, Tschöpe M, Schumann B (1998) Shifts in intra-cellular pH distribution as a part of the signal mechanism leading to the elicitation of benzophenanthridine alkaloids. Plant Physiol 118:349–364 41. Gratton E, vande Ven MJ (2006) Laser sources for confocal microscopy.
In: Pawley JB (ed) Handbook of biological confocal microscopy, 3rd edn. Springer, New York, pp 80–125
42. Nelson BK, Cai X, Nebenführ A (2007) A multicolored set of in vivo orga-nelle markers for co-localization studies in Arabidopsis and other plants. Plant J 51:1126–1136
Submit your next manuscript to BioMed Central and take full advantage of:
• Convenient online submission
• Thorough peer review
• No space constraints or color figure charges
• Immediate publication on acceptance
• Inclusion in PubMed, CAS, Scopus and Google Scholar
• Research which is freely available for redistribution