BioMedCentral
Carbon Balance and Management
Open Access
Research
Development of air conditioning technologies to reduce CO
2
emissions in the commercial sector
Yukiko Yoshida*
Address: Center for Global Environmental Research, National Institute for Environmental Studies, 16-2 Onogawa, Tsukuba, Japan
Email: Yukiko Yoshida* - [email protected] * Corresponding author
Abstract
Background: Architectural methods that take into account global environmental conservation generally concentrate on mitigating the heat load of buildings. Here, we evaluate the reduction of carbon dioxide (CO2) emissions that can be achieved by improving heating, ventilating, and air conditioning (HVAC) technologies.
Results: The Climate Change Research Hall (CCRH) of the National Institute for Environmental Studies (NIES) is used as a case study. CCRH was built in line with the "Green Government Buildings" program of the Government Buildings Department at the Ministry of Land, Infrastructure and Transport in Japan. We have assessed the technology used in this building, and found that there is a possibility to reduce energy consumption in the HVAC system by 30%.
Conclusion: Saving energy reduces CO2 emissions in the commercial sector, although emission
factors depend on the country or region. Consequently, energy savings potential may serve as a criterion in selecting HVAC technologies with respect to emission reduction targets.
Background
Heating, ventilating, air conditioning (HVAC) and light-ing systems in buildlight-ings are a major source of carbon dioxide (CO2) emissions in the commercial sector. Reduc-tion of this source is a common issue for Asian countries that share similar constraints in developing solutions [1,2].
In Japan, a cooperative academic, industrial, and govern-mental project has been established to develop a new sys-tem called the Comprehensive Assessment Syssys-tem for Building Environmental Efficiency (CASBEE). It evaluates all forms of energy usage within buildings [3].
The Climate Change Research Hall (CCRH: completed in 2001, ferroconcrete, three floors, 4900 m2 total floor
space) at the National Institute for Environmental Studies in Japan was constructed according to the latest sustaina-ble environment designs, including global warming abatement technology for buildings [4].
Consumption of electricity for lighting, which is related to the interior heat generation load, changes little from sea-son to seasea-son. This building is equipped with 32 W high-frequency fluorescent lights whose intensity is controlled to keep a constant brightness independent of the outdoor brightness. The automatic control of lighting was found to realize approximately 30% in annual energy savings com-pared to lighting with no automatic control [5].
Here, we assess the HVAC technologies used throughout this building (Figure 1) by quantifying the mitigation of
Published: 25 October 2006
Carbon Balance and Management 2006, 1:12 doi:10.1186/1750-0680-1-12
Received: 06 September 2006 Accepted: 25 October 2006
This article is available from: http://www.cbmjournal.com/content/1/1/12
© 2006 Yoshida; licensee BioMed Central Ltd.
Carbon Balance and Management 2006, 1:12 http://www.cbmjournal.com/content/1/1/12
the environmental burden achieved by using these tech-nologies and management options as related to technol-ogy, institutions and culture [6].
Results
Proceeding from data on energy consumption, HVAC control, and the indoor and outdoor environment, we developed a system for coordinating fan coil units (FCUs) and air-handing units (AHUs). Coordinated control and operation of FCUs and AHUs shuts down FCUs when the heat load through the windows is small. In rooms where occupants and other inside heat sources are fewer than anticipated by design, it imposes limits on excessive space cooling and uses AHU blower operation, which is more effective against room temperature increases than AHU cooling operation in the winter. This decreases energy loss and also provides comfort. According to calculations based on measurement data from the 2004 fiscal year, reducing the operating loss of FCUs and AHUs promises an HVAC energy reduction of about 30% (Figure 2).
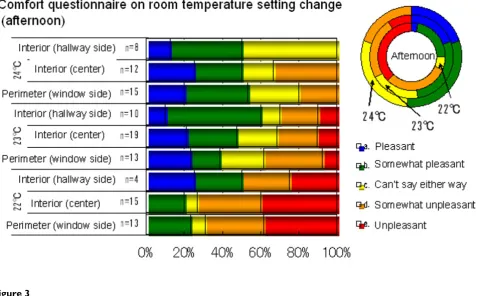
In conjunction with changing the room temperature set-tings, we conducted a questionnaire on comfort, and obtained responses from over half of the room occupants. When the room temperature setting was lowered to 22°C, more respondents said they felt discomfort or slight
dis-comfort than at 23°C. Also, regardless of the temperature to which the setting was changed, reports for the room perimeters were not as good as those for the interiors (Fig-ure 3).
Discussion
In the case of HVAC, the threshold between comfortable and uncomfortable conditions is very narrow. Control of temperature must be designed carefully in order to maxi-mize energy reduction without imposing stress on the room occupants.
Accurate room temperature monitoring data should be fed back to the well-designed ventilation system based on a numerical model that takes into account the environ-mental and room use conditions. Such an intricate system designed specifically for an individual building will lead to maximum energy savings without disturbing the activ-ities of its occupants.
Based on this concept, we evaluate energy savings poten-tial (ESP) [7]:
ESP Annual energy consumption from air-conditioning Baselin
= ee energy consumption from air-conditioning
The system composition of CCRH Figure 1
Carbon Balance and Management 2006, 1:12 http://www.cbmjournal.com/content/1/1/12
in two ways,
The total value of primary energy consumption in typical offices in the 2004 fiscal year was reported to be approxi-mately 2000 MJ/m2/yr by the Building-Energy Manager's
Association of Japan. This total amount approximates the values in the greenhouse gas inventory of Japan [8].
Annual HVAC energy consumption of a typical office in CCRH was 1058 MJ/m2/yr in 2004. However, according
to the Building-Energy Manager's Association of Japan, general offices under HVAC control should have an annual consumption rate of 828 MJ/m2/yr. Therefore, we
set the baseline energy consumption from air-condition-ing to 828 MJ/m2/yr in accordance with the greenhouse
gas inventories. Thus, ESP1 of CCRH was estimated to be 1.28 in 2004.
Baseline energy consumption under optimal HVAC con-trol was estimated at 817 MJ/m2/yr in 2004 using an
approach similar to that of Ishida and Mori [9]. This makes ESP2 equal to 1.30.
Conclusion
Increasing awareness of environmental issues has led to development of a large number of energy conservation technologies for buildings, especially in more developed countries [4]. Energy savings potential (ESP) is a very important indicator for developing these technologies.
In Japan, attempts are being made to create policies such as the standards for planning eco-buildings by the Gov-ernment Buildings Department at the Ministry of Land, Infrastructure and Transport. This document introduces approximately 50 methods and technologies and
pro-ESP Annual energy consumption from air-conditioning Baseli
1= nne energy consumption from air-conditioning according to ggreenhouse gas inventories
ESP Annual energy consumption from air-conditioning Baseli
2= nne energy consumption from air-conditioning under optimal HVAC control
Primary energy consumption of CCRH Figure 2
Carbon Balance and Management 2006, 1:12 http://www.cbmjournal.com/content/1/1/12
vides calculation formulas that can be evaluated using ESP.
Saving energy reduces CO2 emissions in the commercial sector, although emission factors depend on the country and region [1]. Therefore, we have to evaluate the meth-ods developed in Japan for use in carbon management across the Asian region.
Methods
As in ordinary office buildings, the HVAC system of the building used in this research has FCUs on the window-side perimeter, while room interiors have AHU condition-ing systems incorporatcondition-ing variable air volume (VAV) sys-tem control (Figure 4).
The consumption of electricity for lighting, which is related to the interior heat generation load, changes little from season to season. The building in question is fitted with 32 W high-frequency fluorescent lighting with auto-matic lighting control performing initial intensity correc-tion (Figure 5).
The energy consumption of the HVAC system is shown in Figure 6. On weekdays in the summer, cooling is achieved mainly with interior HVAC units (AHUs). When the out-side temperature is 25°C or higher, window perimeter HVAC units (FCUs) are also used. In the winter, when the outside temperature is 10°C or lower, FCU heating and AHU cooling are used. There are concerns about energy operating loss due to simultaneous use of chilled and hot water, but it is hoped that energy will be saved through improvements to the system.
However, energy managers cannot determine whether a particular indoor environment is comfortable or not from the HVAC monitor, especially when users open the win-dows to let in outside air.
Comfort is different for each space-conditioned area. To examine the room temperature and temperature distribu-tion in the experimental room (FCU, VAV detected tem-perature), we performed measurements (Figure 7) of temperatures at 5 different heights (100, 500, 1200, 1800, and 2600 mm) in 3 locations: on the perimeter, which is
Winter comfort questionnaire Figure 3
Carbon Balance and Management 2006, 1:12 http://www.cbmjournal.com/content/1/1/12
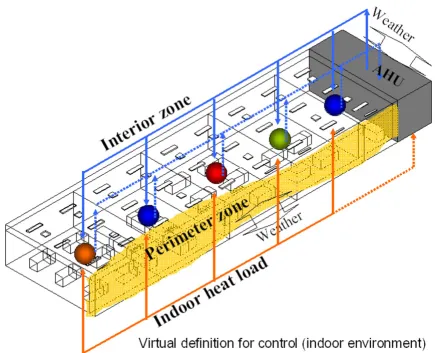
Virtual definition for control (indoor environment) Figure 4
Virtual definition for control (indoor environment).
sensitive to improved envelope performance and changes in outdoor conditions, and in the interior (center and hallway side). Data on vertical temperature distribution collected from August 1, 2005 to February 5, 2006 over the space-conditioning hours of 10:00 to 20:00 are plot-ted in Figure 8 as averages and standard deviations of tem-perature variation range over the time period of the research.
In both summer and winter, the window perimeter was affected by outdoor meteorological changes. In winter, there are large temperature differences by height, making it difficult to maintain comfort.
We plotted the difference between FCU inlet temperature and AHU outlet temperature (∆t) against the AHU air sup-ply temperature at each measurement point (Figure 9) in order to illustrate the circumstances described above. We wanted to consider the indoor environment created by combined FCU and AHU operation, and by the design
response of the AHU HVAC system including building openings. The small heat consumption at 26°C, near the upper limit of the AHU air supply temperature, suggests the effectiveness of blower operation and outside-air cool-ing operation in the summer and intermediate period, as well as the effectiveness of natural ventilation and of let-ting in cool air by opening windows and shutlet-ting down AHUs. In winter, we found an energy operating loss, caused by the effect of FCU space heating that calls for reducing AHU space cooling.
Table 1 provides the main model parameter of the tested indoor environment.
Carbon Balance and Management 2006, 1:12 http://www.cbmjournal.com/content/1/1/12
Electrical consumption from lighting, electrical outlets and number of room occupants Figure 5
Carbon Balance and Management 2006, 1:12 http://www.cbmjournal.com/content/1/1/12
Annual energy consumption of HVAC system Figure 6
Carbon Balance and Management 2006, 1:12 http://www.cbmjournal.com/content/1/1/12
Detailed measurements in tested room Figure 7
Carbon Balance and Management 2006, 1:12 http://www.cbmjournal.com/content/1/1/12
Vertical temperature distribution in representative room (summer at left, winter at right) Figure 8
Carbon Balance and Management 2006, 1:12 http://www.cbmjournal.com/content/1/1/12
Relationship between HVAC outlets and inlets (energy loss) Figure 9
Carbon Balance and Management 2006, 1:12 http://www.cbmjournal.com/content/1/1/12
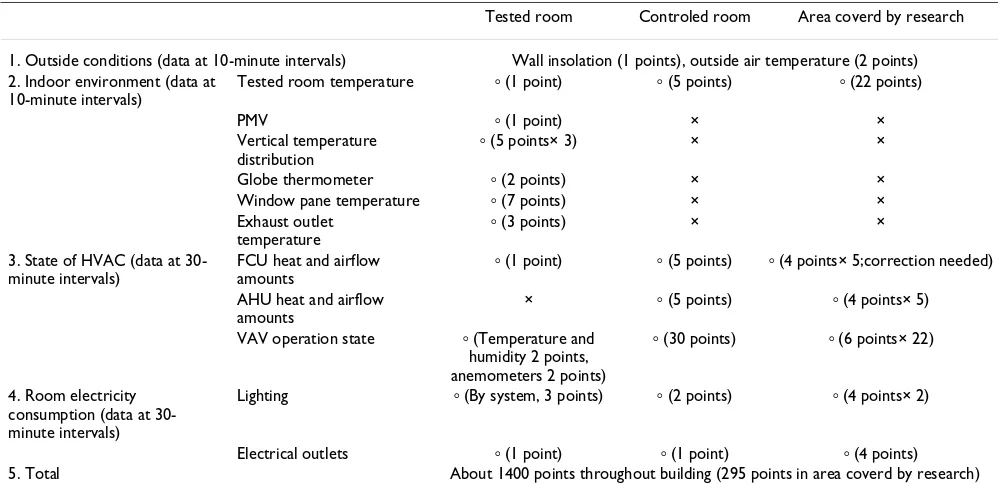
Table 2: The data of CCRH monitoring
Tested room Controled room Area coverd by research
1. Outside conditions (data at 10-minute intervals) Wall insolation (1 points), outside air temperature (2 points) 2. Indoor environment (data at
10-minute intervals)
Tested room temperature ⴰ (1 point) ⴰ (5 points) ⴰ (22 points)
PMV ⴰ (1 point) × ×
Vertical temperature distribution
ⴰ (5 points× 3) × ×
Globe thermometer ⴰ (2 points) × ×
Window pane temperature ⴰ (7 points) × ×
Exhaust outlet temperature
ⴰ (3 points) × ×
3. State of HVAC (data at 30-minute intervals)
FCU heat and airflow amounts
ⴰ (1 point) ⴰ (5 points) ⴰ (4 points× 5;correction needed)
AHU heat and airflow amounts
× ⴰ (5 points) ⴰ (4 points× 5)
VAV operation state ⴰ (Temperature and humidity 2 points, anemometers 2 points)
ⴰ (30 points) ⴰ (6 points× 22)
4. Room electricity consumption (data at 30-minute intervals)
Lighting ⴰ (By system, 3 points) ⴰ (2 points) ⴰ (4 points× 2)
Electrical outlets ⴰ (1 point) ⴰ (1 point) ⴰ (4 points)
5. Total About 1400 points throughout building (295 points in area coverd by research)
Table 1: Parameter of heat load computing model (CCRH when designed)
Perimeter zone Interior zone
Direction Tsukuba, Ibaraki, Japan : For the true south
Area 13.43 m2 199.23 m2
summer 9:00 387.34 W/m2 140 W/m2; temperature 26°C, humidity 50% 12:00 479.82 W/m2 140 W/m2; temperature 26°C, humidity 50% 14:00 515.93 W/m2 140 W/m2; temperature 26°C, humidity 50% 16:00 464.93 W/m2 140 W/m2; temperature 26°C, humidity 50% winter 1223.83 W/m2 134.25 W/m2; temperature 22°C, humidity 40%
Quantity of outdoor air intake 30.0 m3/(h·people)
Over hang 1500 mm
Area of glass 61.7 m2
Rate of glass area 85.1%
Area of internal wall Floor:189.06 m2, Face of wall 72.5 m2
Floor height 4200 mm
Ceiling height 2700 mm
Window shade Minimum calorie that uses
window shade 100 W/m2
Heat gain from occupancy SH69W/people, LH53W/people, Dencity of occupancy 0.17 people/m2 Heat generation rate of electrical outlets 29.75 W/m2 (tested room 32 W/m2)
Cooling load from lighting Illuminance 700lx, 20 W/m2
Publish with BioMed Central and every scientist can read your work free of charge
"BioMed Central will be the most significant development for disseminating the results of biomedical researc h in our lifetime."
Sir Paul Nurse, Cancer Research UK
Your research papers will be:
available free of charge to the entire biomedical community
peer reviewed and published immediately upon acceptance
cited in PubMed and archived on PubMed Central
yours — you keep the copyright
Submit your manuscript here:
http://www.biomedcentral.com/info/publishing_adv.asp
BioMedcentral
Carbon Balance and Management 2006, 1:12 http://www.cbmjournal.com/content/1/1/12
Acknowledgements
This study was accomplished under the "Development and Practical Appli-cation of Energy Conservation Measures" project, funded by the Ministry of the Environment (Japan). The experiments have been carried out under the supervision of Yutaka Tonooka, Hideaki Nakane and Yasumi Fujinuma with the help of Takashi Inoue, Kazuyuki Kamimura, and Yasuo Utsumi. Gen Inoue was involved in drafting the manuscript, and contributed substantially to its conception. Shaney Crawford corrected the use of English.
References
1. Umemiya C: Improving GHG inventories by regional informa-tion exchange: a report from Asia. Carbon Balance and Manage-ment 2006, 1:9. doi:10.1186/1750-0680-1-9
2. Ministry of the Environment, Greenhouse Gas Inventory Office of JAPAN (GIO): National Greenhouse Gas Inventory Report of JAPAN 2006 ver.2. Tsukuba 2006.
3. Japan Sustainable Building Consortium (JSBC): Comprehensive Assess-ment System for Building EnvironAssess-mental Efficiency (CASBEE). Tokyo 2006 [http://www.ibec.or.jp/CASBEE/english/index.htm].
4. Chikada M, Inoue T, et al.: Evaluation of Energy Saving Methods in a Research Institute Building, CCRH. PLEA2001-The 18th Conference on Passive and Low Energy Architecture, Florianopolis-BRAZIL
2001:883-888.
5. Inoue T, Yoshida Y, Ichinose T: Evaluation of Energy Saving Methods in a Research Institute Building: Effects of Thermo-tropic Glass. PLEA2003-The 20th Conference on Passive and Low Energy Architecture, Santiago-CHILE 2003, G-15:6-10.
6. Canan P: Relation Between Regional Carbon Management and Technology. Symposium 21st Century Business Scenarios to Increase the Prevalence of Global Warming Mitigation Technology, Tsukuba
2006:40-45.
7. Zhu Y: Energy Performance Evaluation of Public Architec-tural Air-conditioning System Operation. China-Japan Sympo-sium on Building and Urban Energy/Environmental System, Tokyo
2006:119-130.
8. The Building-Energy Manager's Association of Japan: FY2004 primary energy consumption report: Tokyo 2005.
9. Ishida T, Mori S: The Optimum Air Conditioning System Model Under Constraints of the Economical Efficiency in the Commercial Building. The 21st Energy System/Economics/Environ-ment Conference, Japan Society of Energy and Resources 2005, 27-2:481-484.
10. Tonooka Y, Ishida T, Fukazawa O, Baba T, Nakaguchi T: Measures on GHGs Emission Reduction in Building Sector in JAPAN Part3. The 22st Energy System/Economics/Environment Conference, Tokyo 2006:35-3.
11. Ikaga T, Murakami S, Kato S, Shiraishi Y: Estimation of CO2
Emis-sion Associated with Building Construction and Operation till 2050 in Japan: Study on Social Life Cycle Assessment of Buildings and Cities. J Archt Plann Environ Eng 2000, 535:53-58. 12. Yamaguchi Y, Shinoda Y, Asai T, Mizuno M: Framework forthe
development of an urban energy system with a long-term perspective. The 2005 World Sustainable Building Conference in Tokyo, Tokyo 2005, 07-009:2387-2394.
13. Kilkis B, Schmidt D, et al.: Alternative andSustainable Technol-ogies, Exergy Analysis and Sustainability, Part 1: Fundamen-tals. 2006 Advancing HVAC&R to serve humanity and promote a sustainable world (ASHRAE) annual meeting, Seminar 14 2006. 14. Nakicenovic N, Kolp P, Riahi K, Kainuma M, Hanaoka T:
Assess-ment of Emissions Scenarios Revisited. Environmental Economics and Policy Studies 2006, 7:137-173. DOI 10.1007/s10018-005-0110-0 15. Saito M, Mori S, Dowaki K: An Analysis of the Relationships