R E S E A R C H
Open Access
Efficacy of interventions that use apps to
improve diet, physical activity and
sedentary behaviour: a systematic review
Stephanie Schoeppe
1*, Stephanie Alley
1, Wendy Van Lippevelde
2, Nicola A. Bray
1, Susan L. Williams
3,
Mitch J. Duncan
4and Corneel Vandelanotte
1Abstract
Background:
Health and fitness applications (apps) have gained popularity in interventions to improve diet,
physical activity and sedentary behaviours but their efficacy is unclear. This systematic review examined the efficacy
of interventions that use apps to improve diet, physical activity and sedentary behaviour in children and adults.
Methods:
Systematic literature searches were conducted in five databases to identify papers published between
2006 and 2016. Studies were included if they used a smartphone app in an intervention to improve diet, physical
activity and/or sedentary behaviour for prevention. Interventions could be stand-alone interventions using an app
only, or multi-component interventions including an app as one of several intervention components. Outcomes
measured were changes in the health behaviours and related health outcomes (i.e., fitness, body weight, blood
pressure, glucose, cholesterol, quality of life). Study inclusion and methodological quality were independently
assessed by two reviewers.
Results:
Twenty-seven studies were included, most were randomised controlled trials (
n
= 19; 70%). Twenty-three
studies targeted adults (17 showed significant health improvements) and four studies targeted children (two
demonstrated significant health improvements). Twenty-one studies targeted physical activity (14 showed
significant health improvements), 13 studies targeted diet (seven showed significant health improvements) and five
studies targeted sedentary behaviour (two showed significant health improvements). More studies (
n
= 12; 63%) of
those reporting significant effects detected between-group improvements in the health behaviour or related health
outcomes, whilst fewer studies (
n
= 8; 42%) reported significant within-group improvements. A larger proportion of
multi-component interventions (8 out of 13; 62%) showed significant between-group improvements compared to
stand-alone app interventions (5 out of 14; 36%). Eleven studies reported app usage statistics, and three of them
demonstrated that higher app usage was associated with improved health outcomes.
Conclusions:
This review provided modest evidence that app-based interventions to improve diet, physical activity
and sedentary behaviours can be effective. Multi-component interventions appear to be more effective than
stand-alone app interventions, however, this remains to be confirmed in controlled trials. Future research is needed on
the optimal number and combination of app features, behaviour change techniques, and level of participant
contact needed to maximise user engagement and intervention efficacy.
Keywords:
Systematic review, Literature searches, Smartphone applications, Programs, Efficacy, Healthy eating,
Exercise, Sitting, Health behaviour
* Correspondence:[email protected]
1Central Queensland University, School of Health, Medical and Applied Sciences, Physical Activity Research Group, Building 77, Bruce Highway, Rockhampton QLD 4702, Australia
Full list of author information is available at the end of the article
© The Author(s). 2016Open AccessThis article is distributed under the terms of the Creative Commons Attribution 4.0 International License (http://creativecommons.org/licenses/by/4.0/), which permits unrestricted use, distribution, and reproduction in any medium, provided you give appropriate credit to the original author(s) and the source, provide a link to the Creative Commons license, and indicate if changes were made. The Creative Commons Public Domain Dedication waiver (http://creativecommons.org/publicdomain/zero/1.0/) applies to the data made available in this article, unless otherwise stated. and Physical Activity (2016) 13:127
Background
The prevention of non-communicable diseases (NCDs)
such as cardiovascular disease, cancer and type 2
dia-betes is a major public health goal worldwide [1]. In
2012, NCDs were responsible for 38 million (68%) of the
world
’
s 56 million deaths [1]. Lifestyle behaviours
includ-ing diet, physical activity and sedentary behaviour are
key modifiable risk factors for these diseases and
im-proving these behaviours is considered essential to
redu-cing the financial and health burden of these NCDs [1].
Unhealthy diet, physical inactivity and sedentary
behav-iour are known to track from childhood into adulthood
and are difficult to change later in life [2, 3]. This
exacer-bates associated health problems and demonstrates why
preventing the development of these health risk factors
throughout the lifespan is important.
Given the global scale of NCDs, preventative
interven-tions that can reach large populainterven-tions at low cost are
needed. Smartphones and tablets, including the software
applications (apps) that run on these devices, have
be-come an integral part of people
’
s life with large increases
in usage rates since their introduction in 2007 [4, 5]. For
example, 70% of Americans, 61% of Europeans and 74%
of Australians regularly use a smartphone and/or tablet
[5, 6]. The growth in mobile technologies has also
stim-ulated the growth in health and fitness apps to provide
behavioural interventions that can reach large
popula-tions [7]. Clever use of apps in health promotion and
prevention of disease has enabled researchers to apply
health behaviour changes techniques (e.g., goal setting,
self-monitoring, performance feedback) that have proven
to facilitate health behaviour change across diverse
population groups and settings [7, 8].
Despite the increasing use of apps in health behaviour
change studies their efficacy is unclear, particularly for
different lifestyle behaviours such as diet, physical
activ-ity and sedentary behaviour, as well as for specific
popu-lation groups including children and adults. Some
systematic reviews [9
–
13] have addressed the potential
of health apps to improve diet, physical activity and/or
sedentary behaviour. However, the scope of these
re-views has been broad and many questions remain.
Firstly, most previous reviews [9
–
11, 14] were on
elec-tronic and mobile health (e-& mHealth) interventions,
not specifically on app-based interventions. Secondly,
many reviews [7, 8, 15
–
18] have focused on app design,
the incorporation of established behaviour change
tech-niques and they examined intervention feasibility rather
than efficacy. Thirdly, many previous reviews [19
–
22]
have focused on the use of apps for the treatment of
obesity and chronic diseases. As such, little is known
about the potential of using apps to change health
be-haviours for disease prevention. Finally, no reviews have
distinguished between app interventions for children
versus adults. This is important as app features
appeal-ing to children and adolescents may differ from those
used by adults, and the choice of app features will likely
determine user engagement, retention and ultimately
intervention efficacy [22].
This review aimed to address these gaps in the
litera-ture by systematically synthesising evidence for the
effi-cacy of interventions that use apps to improve diet,
physical activity and sedentary behaviour for NCD
pre-vention. Since app features used by children may differ
from those used by adults, we distinguished between
app interventions targeted to children and adults.
Methods
Literature search
This review was conducted and reported according to
the Preferred Reporting Items for Systematic Reviews
and Meta-Analyses (PRISMA) guidelines (Additional
file 1) [23]. Systematic searches were conducted
be-tween November and December 2015 in five
data-bases: Scopus, CINAHL, SportDiscuss, PsycINFO and
Web of Science. The search was limited to English
language literature, humans, and the year of
publica-tion between 01 January 2006 and 31 October 2016.
It was considered unlikely that app interventions were
developed before 2006/2007 when smartphones were
introduced. Systematic search strategies were designed
using a combination of thesaurus and free terms
cov-ering the following terms: application, app,
smart-phone, smart smart-phone, tablet, mobile game, game,
physical activity, walk, physical fitness, leisure activity,
motor activity, exercise, sport, sedentary, sedentary
behaviour, sedentary behavior, sitting, screen time,
inactive, diet, dietary, nutrition, nutritional, healthy
eating, food, fruit, vegetable, snack, soft drink,
car-bonated beverage, intervention, program, programme,
health promotion, prevention and trial. The detailed
search strategies used for each database are presented
in the Additional file 2. Additionally, articles were
identified via hand-searching and reviewing reference
lists of relevant papers.
Inclusion criteria and study selection
have conceivably been impacted by health behaviour
change (i.e., fitness, body weight, blood pressure,
glu-cose, cholesterol, quality of life). All types and units of
measurements for the lifestyle behaviours and related
health outcomes were acceptable (e.g., objective
meas-ure,
self-report,
minutes,
steps,
servings,
calories,
kilograms). The app intervention could be a stand-alone
intervention using apps only, or a multi-component
intervention where the use of an app was one of several
intervention
components
(e.g.,
physical
education,
provision of physical activity equipment, parental
educa-tion, face-to-face counselling). Studies were excluded from
the review if: (1) non-experimental study designs were
uti-lised (i.e., observational or case studies, studies reporting
prevalence or trend data, feasibility studies, measurement
studies, theoretical papers); and (2) the publication was
not a peer-reviewed primary study (i.e., letters,
commen-taries, conference proceedings, reviews, narrative articles).
Initially, titles and abstracts were screened for inclusion by
a single reviewer (SS). As per best practice for systematic
reviews [23], two reviewers (SA, WVL) independently
reviewed the eligibility of studies for inclusion in the
re-view, with disagreement resolved by discussion and
con-sensus with a third reviewer (SS).
Data extraction
Data extraction was conducted using a standardised form
developed specifically for this review (Table 1); similar to
those used in other systematic reviews [12, 24, 25]. For all
included studies, data were extracted for author, year,
country, study design, intervention duration,
measure-ment time points, attrition rate, sample, behaviour change
theory, app features including behaviour change
tech-niques, intervention components, outcomes, measures
and main study results. The primary outcome measures
extracted for main study results were dietary intake,
phys-ical activity and sedentary behaviour. Other relevant
out-come measures closely related to these behaviours
included weight status (body mass index, body weight,
waist circumference), fitness, blood pressure, cholesterol,
glucose and quality of life. To determine whether the
in-terventions had a significant effect on behavioural and
health outcomes, data on significance and magnitude of
within- and between-group differences was extracted. For
each included study, two reviewers independently
ex-tracted data (NAB and either SS, SA or WVL). Reviewers
one and two agreed on the data extraction in over 70% of
the studies. Disagreement was easily resolved by
discus-sion and consensus with a third reviewer (either SS,
SA or WVL).
Study quality assessment
The quality of the included studies was assessed using
25-point criteria adapted from the CONSORT checklists
for the reporting of randomised controlled trials [26].
While the CONSORT checklist is intended for
con-trolled trials, most criteria are applicable to other study
designs and the weaker study designs justifiably received
a lower score than studies using a controlled trial design.
This approach has been used in other reviews [24]. Each
criterion was rated as 1 (fulfilled), 0.5 (not all sub-items
making up the criterion were fulfilled), 0 (not fulfilled or
unclear), or not applicable (criterion was not applicable
to the study design). Not applicable criteria were
dis-counted from the
‘
overall study quality score
’
(sum of
points). Hence, the highest attainable quality score was
not 25 for all studies. Adapted from previous reviews
[27, 28], the obtained study quality score for each study
was divided by the highest attainable score and
multi-plied by 100 to give a percentage of fulfilled criteria; and
studies were then grouped into high (>66.7%), fair (50
–
66.6%) or low (<50%) study quality (Additional file 3).
The study quality assessment was conducted
independ-ently by two reviewers (SS, SA), with disagreement
re-solved by discussion and consensus with a third reviewer
(WVL). Percent agreement between reviewers one and
two for the scoring of the CONSORT criteria was 89%,
with the most common points of discrepancy relating to
recruitment methods, outcomes reporting and blinding
procedures.
Results
Study selection
A flowchart of the study selection process is presented
in Fig. 1. A total of 6926 publications were identified
from the database search. After removal of duplicates,
4945 publication titles and abstracts were screened, and
194 full-text articles were considered potentially eligible
for inclusion. Of these, 30 articles reporting data on the
efficacy of an app-based intervention to improve diet,
physical activity and/or sedentary behaviour for
pre-vention were included for final review. Some articles
[29
–
34] reported on the same studies, and as such, a
total of 30 articles describing 27 studies were
in-cluded in this review.
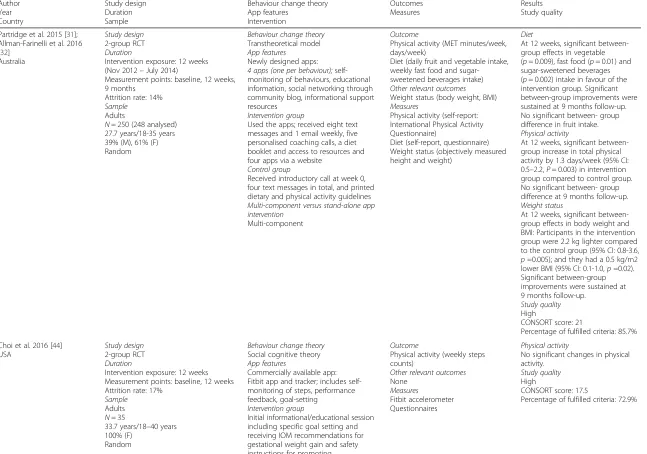
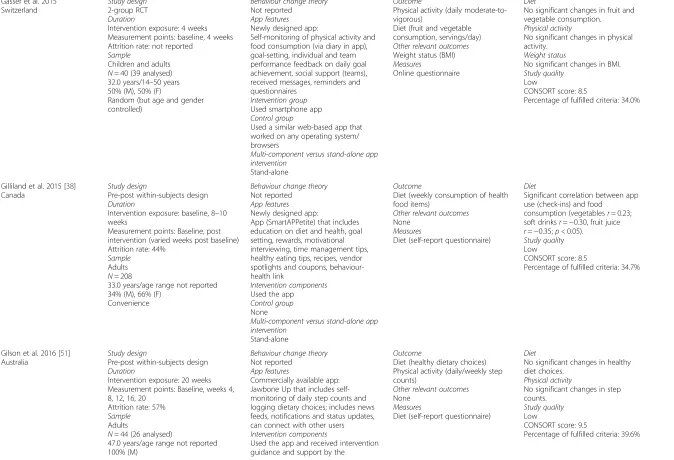
Study characteristics
Characteristics of the app intervention studies included
in this review are presented in Table 1.
Author Year Country
Study design Duration Sample
Behaviour change theory App features
Intervention
Outcomes Measures
Results Study quality
Partridge et al. 2015 [31]; Allman-Farinelli et al. 2016 [32]
Australia
Study design 2-group RCT Duration
Intervention exposure: 12 weeks (Nov 2012–July 2014)
Measurement points: baseline, 12 weeks, 9 months
Attrition rate: 14% Sample
Adults
N= 250 (248 analysed) 27.7 years/18-35 years 39% (M), 61% (F) Random
Behaviour change theory Transtheoretical model App features
Newly designed apps: 4 apps (one per behaviour); self-monitoring of behaviours, educational information, social networking through community blog, informational support resources
Intervention group
Used the apps; received eight text messages and 1 email weekly, five personalised coaching calls, a diet booklet and access to resources and four apps via a website
Control group
Received introductory call at week 0, four text messages in total, and printed dietary and physical activity guidelines Multi-component versus stand-alone app intervention
Multi-component
Outcome
Physical activity (MET minutes/week, days/week)
Diet (daily fruit and vegetable intake, weekly fast food and sugar-sweetened beverages intake) Other relevant outcomes Weight status (body weight, BMI) Measures
Physical activity (self-report: International Physical Activity Questionnaire)
Diet (self-report, questionnaire) Weight status (objectively measured height and weight)
Diet
At 12 weeks, significant between-group effects in vegetable (p= 0.009), fast food (p= 0.01) and sugar-sweetened beverages (p= 0.002) intake in favour of the intervention group. Significant between-group improvements were sustained at 9 months follow-up. No significant between- group difference in fruit intake. Physical activity
At 12 weeks, significant between-group increase in total physical activity by 1.3 days/week (95% CI: 0.5–2.2,P= 0.003) in intervention group compared to control group. No significant between- group difference at 9 months follow-up. Weight status
At 12 weeks, significant between-group effects in body weight and BMI: Participants in the intervention group were 2.2 kg lighter compared to the control group (95% CI: 0.8-3.6, p=0.005); and they had a 0.5 kg/m2 lower BMI (95% CI: 0.1-1.0,p=0.02). Significant between-group improvements were sustained at 9 months follow-up.
Study quality High
CONSORT score: 21
Percentage of fulfilled criteria: 85.7%
Choi et al. 2016 [44] USA
Study design 2-group RCT Duration
Intervention exposure: 12 weeks Measurement points: baseline, 12 weeks Attrition rate: 17%
Sample Adults N= 35
33.7 years/18–40 years 100% (F)
Random
Behaviour change theory Social cognitive theory App features
Commercially available app: Fitbit app and tracker; includes self-monitoring of steps, performance feedback, goal-setting
Intervention group
Initial informational/educational session including specific goal setting and receiving IOM recommendations for gestational weight gain and safety instructions for promoting
Outcome
Physical activity (weekly steps counts)
Other relevant outcomes None
Measures
Fitbit accelerometer Questionnaires
Physical activity
No significant changes in physical activity.
Study quality High
CONSORT score: 17.5
Percentage of fulfilled criteria: 72.9%
et
al.
Internationa
lJournal
of
Behavioral
Nutrition
and
Physical
Activity
(2016) 13:127
Page
4
of
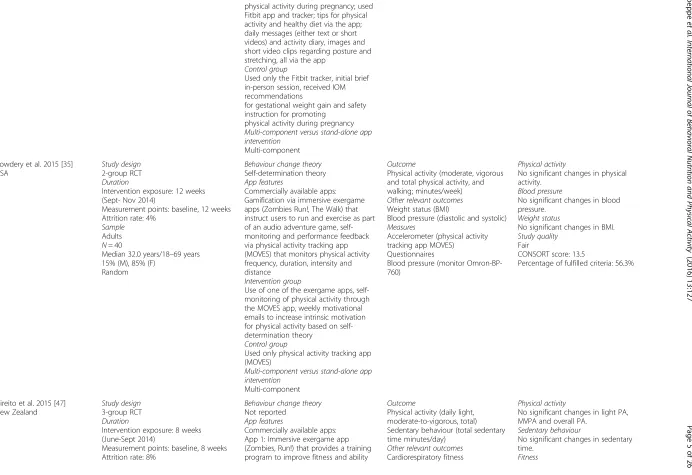
physical activity during pregnancy; used Fitbit app and tracker; tips for physical activity and healthy diet via the app; daily messages (either text or short videos) and activity diary, images and short video clips regarding posture and stretching, all via the app
Control group
Used only the Fitbit tracker, initial brief in-person session, received IOM recommendations
for gestational weight gain and safety instruction for promoting
physical activity during pregnancy Multi-component versus stand-alone app intervention
Multi-component
Cowdery et al. 2015 [35] USA
Study design 2-group RCT Duration
Intervention exposure: 12 weeks (Sept- Nov 2014)
Measurement points: baseline, 12 weeks Attrition rate: 4%
Sample Adults N= 40
Median 32.0 years/18–69 years 15% (M), 85% (F)
Random
Behaviour change theory Self-determination theory App features
Commercially available apps: Gamification via immersive exergame apps (Zombies Run!, The Walk) that instruct users to run and exercise as part of an audio adventure game, self-monitoring and performance feedback via physical activity tracking app (MOVES) that monitors physical activity frequency, duration, intensity and distance
Intervention group
Use of one of the exergame apps, self-monitoring of physical activity through the MOVES app, weekly motivational emails to increase intrinsic motivation for physical activity based on self-determination theory
Control group
Used only physical activity tracking app (MOVES)
Multi-component versus stand-alone app intervention
Multi-component
Outcome
Physical activity (moderate, vigorous and total physical activity, and walking; minutes/week) Other relevant outcomes Weight status (BMI)
Blood pressure (diastolic and systolic) Measures
Accelerometer (physical activity tracking app MOVES) Questionnaires
Blood pressure (monitor Omron-BP-760)
Physical activity
No significant changes in physical activity.
Blood pressure
No significant changes in blood pressure.
Weight status
No significant changes in BMI. Study quality
Fair
CONSORT score: 13.5
Percentage of fulfilled criteria: 56.3%
Direito et al. 2015 [47] New Zealand
Study design 3-group RCT Duration
Intervention exposure: 8 weeks (June-Sept 2014)
Measurement points: baseline, 8 weeks Attrition rate: 8%
Behaviour change theory Not reported
App features
Commercially available apps: App 1: Immersive exergame app (Zombies, Run!) that provides a training program to improve fitness and ability
Outcome
Physical activity (daily light, moderate-to-vigorous, total) Sedentary behaviour (total sedentary time minutes/day)
Other relevant outcomes Cardiorespiratory fitness
Physical activity
No significant changes in light PA, MVPA and overall PA.
Sedentary behaviour
No significant changes in sedentary time.
Fitness
et
al.
Internationa
lJournal
of
Behavioral
Nutrition
and
Physical
Activity
(2016) 13:127
Page
5
of
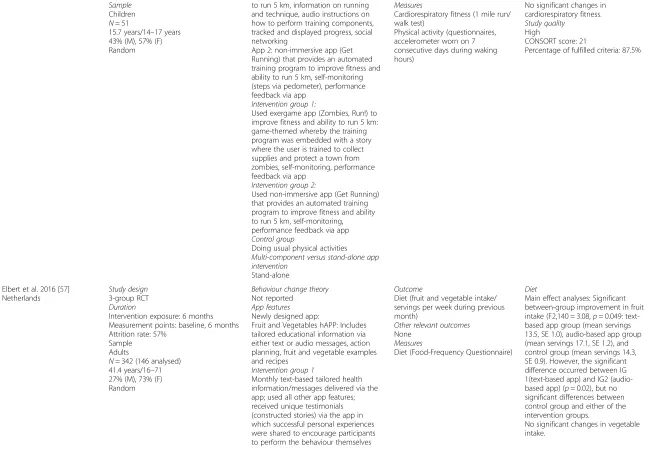
Sample Children N= 51
15.7 years/14–17 years 43% (M), 57% (F) Random
to run 5 km, information on running and technique, audio instructions on how to perform training components, tracked and displayed progress, social networking
App 2: non-immersive app (Get Running) that provides an automated training program to improve fitness and ability to run 5 km, self-monitoring (steps via pedometer), performance feedback via app
Intervention group 1:
Used exergame app (Zombies, Run!) to improve fitness and ability to run 5 km: game-themed whereby the training program was embedded with a story where the user is trained to collect supplies and protect a town from zombies, self-monitoring, performance feedback via app
Intervention group 2:
Used non-immersive app (Get Running) that provides an automated training program to improve fitness and ability to run 5 km, self-monitoring, performance feedback via app Control group
Doing usual physical activities Multi-component versus stand-alone app intervention
Stand-alone
Measures
Cardiorespiratory fitness (1 mile run/ walk test)
Physical activity (questionnaires, accelerometer worn on 7 consecutive days during waking hours)
No significant changes in cardiorespiratory fitness. Study quality
High
CONSORT score: 21
Percentage of fulfilled criteria: 87.5%
Elbert et al. 2016 [57] Netherlands
Study design 3-group RCT Duration
Intervention exposure: 6 months Measurement points: baseline, 6 months Attrition rate: 57%
Sample Adults
N= 342 (146 analysed) 41.4 years/16–71 27% (M), 73% (F) Random
Behaviour change theory Not reported
App features Newly designed app:
Fruit and Vegetables hAPP: Includes tailored educational information via either text or audio messages, action planning, fruit and vegetable examples and recipes
Intervention group 1
Monthly text-based tailored health information/messages delivered via the app; used all other app features; received unique testimonials (constructed stories) via the app in which successful personal experiences were shared to encourage participants to perform the behaviour themselves
Outcome
Diet (fruit and vegetable intake/ servings per week during previous month)
Other relevant outcomes None
Measures
Diet (Food-Frequency Questionnaire) Diet
Main effect analyses: Significant between-group improvement in fruit intake (F2,140 = 3.08,p= 0.049: text-based app group (mean servings 13.5, SE 1.0), audio-based app group (mean servings 17.1, SE 1.2), and control group (mean servings 14.3, SE 0.9). However, the significant difference occurred between IG 1(text-based app) and IG2 (audio-based app) (p= 0.02), but no significant differences between control group and either of the intervention groups.
No significant changes in vegetable intake.
et
al.
Internationa
lJournal
of
Behavioral
Nutrition
and
Physical
Activity
(2016) 13:127
Page
6
of
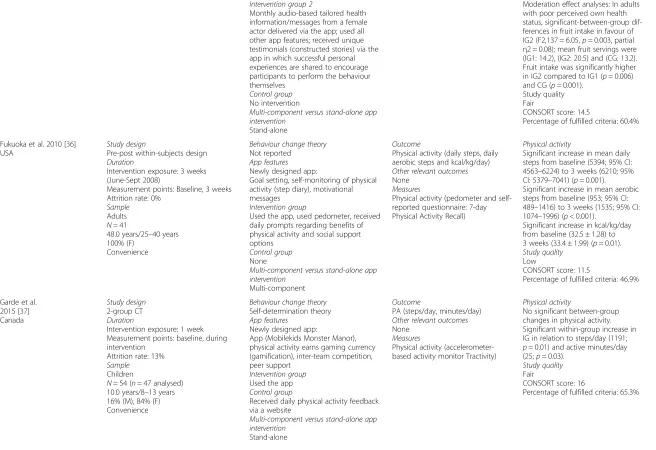
Intervention group 2
Monthly audio-based tailored health information/messages from a female actor delivered via the app; used all other app features; received unique testimonials (constructed stories) via the app in which successful personal experiences are shared to encourage participants to perform the behaviour themselves
Control group No intervention
Multi-component versus stand-alone app intervention
Stand-alone
Moderation effect analyses: In adults with poor perceived own health status, significant-between-group dif-ferences in fruit intake in favour of IG2 (F2,137 = 6.05,p= 0.003, partial η2 = 0.08); mean fruit servings were (IG1: 14.2), (IG2: 20.5) and (CG: 13.2). Fruit intake was significantly higher in IG2 compared to IG1 (p= 0.006) and CG (p= 0.001).
Study quality Fair
CONSORT score: 14.5
Percentage of fulfilled criteria: 60.4%
Fukuoka et al. 2010 [36] USA
Study design
Pre-post within-subjects design Duration
Intervention exposure: 3 weeks (June-Sept 2008)
Measurement points: Baseline, 3 weeks Attrition rate: 0%
Sample Adults N= 41
48.0 years/25–40 years 100% (F)
Convenience
Behaviour change theory Not reported
App features Newly designed app:
Goal setting, self-monitoring of physical activity (step diary), motivational messages
Intervention group
Used the app, used pedometer, received daily prompts regarding benefits of physical activity and social support options
Control group None
Multi-component versus stand-alone app intervention
Multi-component
Outcome
Physical activity (daily steps, daily aerobic steps and kcal/kg/day) Other relevant outcomes None
Measures
Physical activity (pedometer and self-reported questionnaire: 7-day Physical Activity Recall)
Physical activity
Significant increase in mean daily steps from baseline (5394; 95% CI: 4563–6224) to 3 weeks (6210; 95% CI: 5379–7041) (p= 0.001). Significant increase in mean aerobic steps from baseline (953; 95% CI: 489–1416) to 3 weeks (1535; 95% CI: 1074–1996) (p< 0.001).
Significant increase in kcal/kg/day from baseline (32.5 ± 1.28) to 3 weeks (33.4 ± 1.99) (p= 0.01). Study quality
Low
CONSORT score: 11.5
Percentage of fulfilled criteria: 46.9%
Garde et al. 2015 [37] Canada
Study design 2-group CT Duration
Intervention exposure: 1 week Measurement points: baseline, during intervention
Attrition rate: 13% Sample
Children
N= 54 (n= 47 analysed) 10.0 years/8–13 years 16% (M), 84% (F) Convenience
Behaviour change theory Self-determination theory App features
Newly designed app:
App (Mobilekids Monster Manor), physical activity earns gaming currency (gamification), inter-team competition, peer support
Intervention group Used the app Control group
Received daily physical activity feedback via a website
Multi-component versus stand-alone app intervention
Stand-alone
Outcome
PA (steps/day, minutes/day) Other relevant outcomes None
Measures
Physical activity (accelerometer-based activity monitor Tractivity)
Physical activity
No significant between-group changes in physical activity. Significant within-group increase in IG in relation to steps/day (1191; p= 0.01) and active minutes/day (25;p= 0.03).
Study quality Fair
CONSORT score: 16
Percentage of fulfilled criteria: 65.3%
et
al.
Internationa
lJournal
of
Behavioral
Nutrition
and
Physical
Activity
(2016) 13:127
Page
7
of
Gasser et al. 2015 Switzerland
Study design 2-group RCT Duration
Intervention exposure: 4 weeks Measurement points: baseline, 4 weeks Attrition rate: not reported
Sample
Children and adults N= 40 (39 analysed) 32.0 years/14–50 years 50% (M), 50% (F)
Random (but age and gender controlled)
Behaviour change theory Not reported
App features Newly designed app:
Self-monitoring of physical activity and food consumption (via diary in app), goal-setting, individual and team performance feedback on daily goal achievement, social support (teams), received messages, reminders and questionnaires
Intervention group Used smartphone app Control group
Used a similar web-based app that worked on any operating system/ browsers
Multi-component versus stand-alone app intervention
Stand-alone
Outcome
Physical activity (daily moderate-to-vigorous)
Diet (fruit and vegetable consumption, servings/day) Other relevant outcomes Weight status (BMI) Measures
Online questionnaire
Diet
No significant changes in fruit and vegetable consumption. Physical activity
No significant changes in physical activity.
Weight status
No significant changes in BMI. Study quality
Low
CONSORT score: 8.5
Percentage of fulfilled criteria: 34.0%
Gilliland et al. 2015 [38] Canada
Study design
Pre-post within-subjects design Duration
Intervention exposure: baseline, 8–10 weeks
Measurement points: Baseline, post intervention (varied weeks post baseline) Attrition rate: 44%
Sample Adults N= 208
33.0 years/age range not reported 34% (M), 66% (F)
Convenience
Behaviour change theory Not reported
App features Newly designed app:
App (SmartAPPetite) that includes education on diet and health, goal setting, rewards, motivational interviewing, time management tips, healthy eating tips, recipes, vendor spotlights and coupons, behaviour-health link
Intervention components Used the app Control group None
Multi-component versus stand-alone app intervention
Stand-alone
Outcome
Diet (weekly consumption of health food items)
Other relevant outcomes None
Measures
Diet (self-report questionnaire)
Diet
Significant correlation between app use (check-ins) and food
consumption (vegetablesr= 0.23; soft drinksr=−0.30, fruit juice r=−0.35;p <0.05).
Study quality Low
CONSORT score: 8.5
Percentage of fulfilled criteria: 34.7%
Gilson et al. 2016 [51] Australia
Study design
Pre-post within-subjects design Duration
Intervention exposure: 20 weeks Measurement points: Baseline, weeks 4, 8, 12, 16, 20
Attrition rate: 57% Sample
Adults
N= 44 (26 analysed)
47.0 years/age range not reported 100% (M)
Behaviour change theory Not reported
App features
Commercially available app: Jawbone Up that includes self-monitoring of daily step counts and logging dietary choices; includes news feeds, notifications and status updates, can connect with other users Intervention components
Used the app and received intervention guidance and support by the
Outcome
Diet (healthy dietary choices) Physical activity (daily/weekly step counts)
Other relevant outcomes None
Measures
Diet (self-report questionnaire)
Diet
No significant changes in healthy diet choices.
Physical activity
No significant changes in step counts.
Study quality Low
CONSORT score: 9.5
Percentage of fulfilled criteria: 39.6%
et
al.
Internationa
lJournal
of
Behavioral
Nutrition
and
Physical
Activity
(2016) 13:127
Page
8
of
Convenience researchers through connecting via the app
Control group None
Multi-component versus stand-alone app intervention
Stand-alone
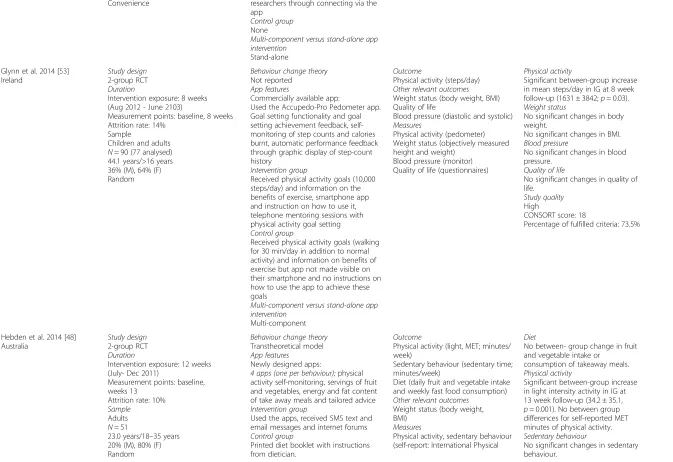
Glynn et al. 2014 [53] Ireland
Study design 2-group RCT Duration
Intervention exposure: 8 weeks (Aug 2012 - June 2103)
Measurement points: baseline, 8 weeks Attrition rate: 14%
Sample
Children and adults N= 90 (77 analysed) 44.1 years/>16 years 36% (M), 64% (F) Random
Behaviour change theory Not reported
App features
Commercially available app:
Used the Accupedo-Pro Pedometer app. Goal setting functionality and goal setting achievement feedback, self-monitoring of step counts and calories burnt, automatic performance feedback through graphic display of step-count history
Intervention group
Received physical activity goals (10,000 steps/day) and information on the benefits of exercise, smartphone app and instruction on how to use it, telephone mentoring sessions with physical activity goal setting Control group
Received physical activity goals (walking for 30 min/day in addition to normal activity) and information on benefits of exercise but app not made visible on their smartphone and no instructions on how to use the app to achieve these goals
Multi-component versus stand-alone app intervention
Multi-component
Outcome
Physical activity (steps/day) Other relevant outcomes Weight status (body weight, BMI) Quality of life
Blood pressure (diastolic and systolic) Measures
Physical activity (pedometer) Weight status (objectively measured height and weight)
Blood pressure (monitor) Quality of life (questionnaires)
Physical activity
Significant between-group increase in mean steps/day in IG at 8 week follow-up (1631 ± 3842;p= 0.03). Weight status
No significant changes in body weight.
No significant changes in BMI. Blood pressure
No significant changes in blood pressure.
Quality of life
No significant changes in quality of life.
Study quality High
CONSORT score: 18
Percentage of fulfilled criteria: 73.5%
Hebden et al. 2014 [48] Australia
Study design 2-group RCT Duration
Intervention exposure: 12 weeks (July- Dec 2011)
Measurement points: baseline, weeks 13
Attrition rate: 10% Sample
Adults N= 51
23.0 years/18–35 years 20% (M), 80% (F) Random
Behaviour change theory Transtheoretical model App features
Newly designed apps:
4 apps (one per behaviour);physical activity self-monitoring, servings of fruit and vegetables, energy and fat content of take away meals and tailored advice Intervention group
Used the apps, received SMS text and email messages and internet forums Control group
Printed diet booklet with instructions from dietician.
Outcome
Physical activity (light, MET; minutes/ week)
Sedentary behaviour (sedentary time; minutes/week)
Diet (daily fruit and vegetable intake and weekly fast food consumption) Other relevant outcomes
Weight status (body weight, BMI)
Measures
Physical activity, sedentary behaviour (self-report: International Physical
Diet
No between- group change in fruit and vegetable intake or
consumption of takeaway meals. Physical activity
Significant between-group increase in light intensity activity in IG at 13 week follow-up (34.2 ± 35.1, p= 0.001). No between group differences for self-reported MET minutes of physical activity. Sedentary behaviour
No significant changes in sedentary behaviour.
et
al.
Internationa
lJournal
of
Behavioral
Nutrition
and
Physical
Activity
(2016) 13:127
Page
9
of
Multi-component versus stand-alone app intervention
Multi-component
Activity Questionnaire; accelerometer) Sitting time (self-report, questionnaire)
Diet (self-report, takeaway and fruit and vegetable consumption) Weight status (objectively measured height and weight)
Weight status
No significant changes in weight status.
Study quality High
CONSORT score: 19.5
Percentage of fulfilled criteria: 79.6%
King et al. 2013 [39] USA
Study design
3-group randomised trial Duration
Intervention exposure: 8 weeks Measurement points: baseline, 8 weeks Attrition rate: 11%
Sample Adults
N= 68 (N 61 analysed) 59.1 years/>45 years 26% (M), 74% (F) Random
Behaviour change theory
Social cognitive theory, social influence theory
App features Newly designed apps: 3 different apps:
‘Analytic’motivational app including goal-setting and feedback, barriers ‘Social’motivational app including social norms, modelling, competition and collaboration.
‘Affective’motivational app including positive reinforcement, modelling, feedback and gamification.
In addition, all apps incorporated push and pull components, glance-able display, passive activity assessment, real time feedback, self-monitoring, reinforcement.
Intervention group Used the apps Control group None
Multi-component versus stand-alone app intervention
Stand-alone
Outcome
Physical activity (brisk walking, moderate-to-vigorous; minutes/ week)
Sedentary behaviour (television viewing; minutes/day) Other relevant outcomes None
Measures
Physical activity (self-report: CHAMPS Physical Activity Questionnaire) Sedentary behaviour (self–report: Measure of Older Adults Sedentary Time MOST)
Physical activity
Significant within-group increases in mean minutes/week of brisk walking across all 3 app groups at 8 week follow-up (100.8 ± 167.0;p< 0.001). Significant within-group increase in mean minutes/week of total MVPA across all 3 app groups at 8 week follow-up (188.6 ± 289.3;p< 0.001) No significant between-group changes in physical activity. Sedentary behaviour
Significant within-group decrease in minutes/day spent sitting whilst watching television (29.1 ± 84.5; p< 0.02) across all 3 app groups at 8 week follow-up.
No significant between-group changes in sedentary behaviour. Study quality
Low
CONSORT score: 12
Percentage of fulfilled criteria: 46.9%
Kirwan et al. 2012 [49] Australia
Study design
2-group CT (matched case-control trial) Duration
Intervention exposure: 12 weeks (August-October 2009)
Measurement points: baseline, 12 weeks Attrition rate: 0%
Sample Adults N= 200
39.7 years/17–64 years 52% (M), 48% (F) Convenience
Behaviour change theory Not reported
App features Newly designed app:
Self-monitoring of physical activity (steps via iSteplog)
Intervention group
Participants logged steps using either app or 10,000 steps website, goal-setting, performance feedback Control group
Participants logged steps using 10,000 step website, but no access to iSteplog app
Outcome
Physical activity (steps/day) Other relevant outcomes None
Measures Accelerometer
Physical activity
Between group increase in steps/day in IG at 12 week follow-up (11,140. ± 4,121vs CG: 6,274 ± 2,106,p< 0.001). Study quality
Fair
CONSORT score: 14.5
Percentage of fulfilled criteria: 59.2%
et
al.
Internationa
lJournal
of
Behavioral
Nutrition
and
Physical
Activity
(2016) 13:127
Page
10
of
Multi-component versus stand-alone app intervention
Multi-component
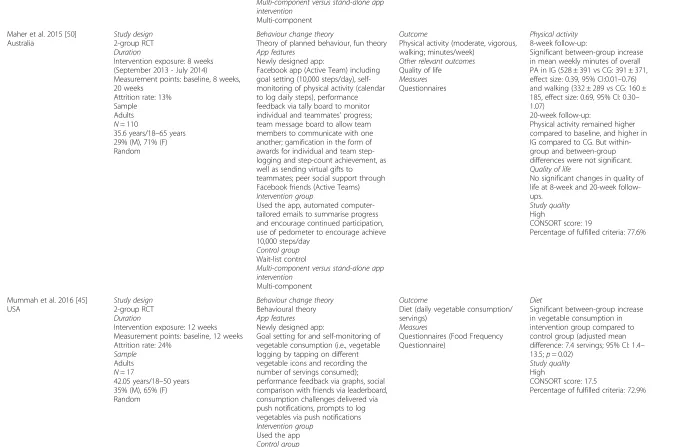
Maher et al. 2015 [50] Australia
Study design 2-group RCT Duration
Intervention exposure: 8 weeks (September 2013 - July 2014) Measurement points: baseline, 8 weeks, 20 weeks
Attrition rate: 13% Sample
Adults N= 110
35.6 years/18–65 years 29% (M), 71% (F) Random
Behaviour change theory
Theory of planned behaviour, fun theory App features
Newly designed app:
Facebook app (Active Team) including goal setting (10,000 steps/day), self-monitoring of physical activity (calendar to log daily steps), performance feedback via tally board to monitor individual and teammates’progress; team message board to allow team members to communicate with one another; gamification in the form of awards for individual and team step-logging and step-count achievement, as well as sending virtual gifts to
teammates; peer social support through Facebook friends (Active Teams) Intervention group
Used the app, automated computer-tailored emails to summarise progress and encourage continued participation, use of pedometer to encourage achieve 10,000 steps/day
Control group Wait-list control
Multi-component versus stand-alone app intervention
Multi-component
Outcome
Physical activity (moderate, vigorous, walking; minutes/week)
Other relevant outcomes Quality of life Measures Questionnaires
Physical activity 8-week follow-up:
Significant between-group increase in mean weekly minutes of overall PA in IG (528 ± 391 vs CG: 391 ± 371, effect size: 0.39, 95% CI:0.01–0.76) and walking (332 ± 289 vs CG: 160 ± 185, effect size: 0.69, 95% CI: 0.30– 1.07)
20-week follow-up:
Physical activity remained higher compared to baseline, and higher in IG compared to CG. But within-group and between-within-group differences were not significant. Quality of life
No significant changes in quality of life at 8-week and 20-week follow-ups.
Study quality High
CONSORT score: 19
Percentage of fulfilled criteria: 77.6%
Mummah et al. 2016 [45] USA
Study design 2-group RCT Duration
Intervention exposure: 12 weeks Measurement points: baseline, 12 weeks Attrition rate: 24%
Sample Adults N= 17
42.05 years/18–50 years 35% (M), 65% (F) Random
Behaviour change theory Behavioural theory App features Newly designed app:
Goal setting for and self-monitoring of vegetable consumption (i.e., vegetable logging by tapping on different vegetable icons and recording the number of servings consumed); performance feedback via graphs, social comparison with friends via leaderboard, consumption challenges delivered via push notifications, prompts to log vegetables via push notifications Intervention group
Used the app Control group Wait-list control
Outcome
Diet (daily vegetable consumption/ servings)
Measures
Questionnaires (Food Frequency Questionnaire)
Diet
Significant between-group increase in vegetable consumption in intervention group compared to control group (adjusted mean difference: 7.4 servings; 95% CI: 1.4– 13.5;p= 0.02)
Study quality High
CONSORT score: 17.5
Percentage of fulfilled criteria: 72.9%
et
al.
Internationa
lJournal
of
Behavioral
Nutrition
and
Physical
Activity
(2016) 13:127
Page
11
of
Multi-component versus stand-alone app intervention
Stand-alone
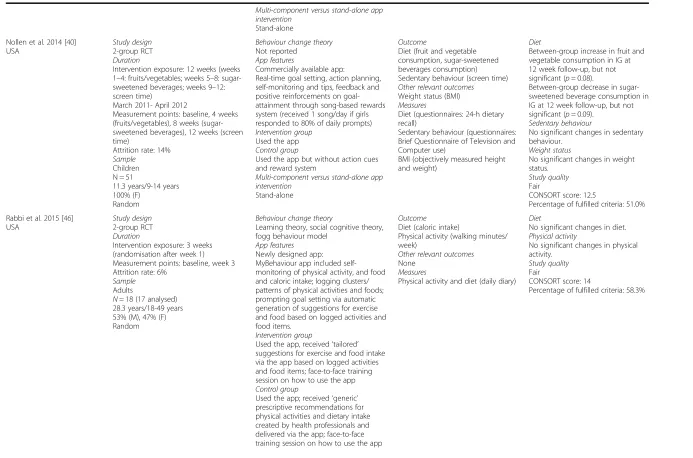
Nollen et al. 2014 [40] USA
Study design 2-group RCT Duration
Intervention exposure: 12 weeks (weeks 1–4: fruits/vegetables; weeks 5–8: sugar-sweetened beverages; weeks 9–12: screen time)
March 2011- April 2012
Measurement points: baseline, 4 weeks (fruits/vegetables), 8 weeks (sugar-sweetened beverages), 12 weeks (screen time)
Attrition rate: 14% Sample
Children N = 51
11.3 years/9-14 years 100% (F)
Random
Behaviour change theory Not reported
App features
Commercially available app:
Real-time goal setting, action planning, self-monitoring and tips, feedback and positive reinforcements on goal-attainment through song-based rewards system (received 1 song/day if girls responded to 80% of daily prompts) Intervention group
Used the app Control group
Used the app but without action cues and reward system
Multi-component versus stand-alone app intervention
Stand-alone
Outcome
Diet (fruit and vegetable consumption, sugar-sweetened beverages consumption) Sedentary behaviour (screen time) Other relevant outcomes
Weight status (BMI) Measures
Diet (questionnaires: 24-h dietary recall)
Sedentary behaviour (questionnaires: Brief Questionnaire of Television and Computer use)
BMI (objectively measured height and weight)
Diet
Between-group increase in fruit and vegetable consumption in IG at 12 week follow-up, but not significant (p= 0.08).
Between-group decrease in sugar-sweetened beverage consumption in IG at 12 week follow-up, but not significant (p= 0.09).
Sedentary behaviour
No significant changes in sedentary behaviour.
Weight status
No significant changes in weight status.
Study quality Fair
CONSORT score: 12.5
Percentage of fulfilled criteria: 51.0%
Rabbi et al. 2015 [46] USA
Study design 2-group RCT Duration
Intervention exposure: 3 weeks (randomisation after week 1) Measurement points: baseline, week 3 Attrition rate: 6%
Sample Adults
N= 18 (17 analysed) 28.3 years/18-49 years 53% (M), 47% (F) Random
Behaviour change theory
Learning theory, social cognitive theory, fogg behaviour model
App features Newly designed app:
MyBehaviour app included self-monitoring of physical activity, and food and caloric intake; logging clusters/ patterns of physical activities and foods; prompting goal setting via automatic generation of suggestions for exercise and food based on logged activities and food items.
Intervention group
Used the app, received‘tailored’ suggestions for exercise and food intake via the app based on logged activities and food items; face-to-face training session on how to use the app Control group
Used the app; received‘generic’ prescriptive recommendations for physical activities and dietary intake created by health professionals and delivered via the app; face-to-face training session on how to use the app
Outcome Diet (caloric intake)
Physical activity (walking minutes/ week)
Other relevant outcomes None
Measures
Physical activity and diet (daily diary) Diet
No significant changes in diet. Physical activity
No significant changes in physical activity.
Study quality Fair
CONSORT score: 14
Percentage of fulfilled criteria: 58.3%
et
al.
Internationa
lJournal
of
Behavioral
Nutrition
and
Physical
Activity
(2016) 13:127
Page
12
of
Multi-component versus stand-alone app intervention
Stand-alone
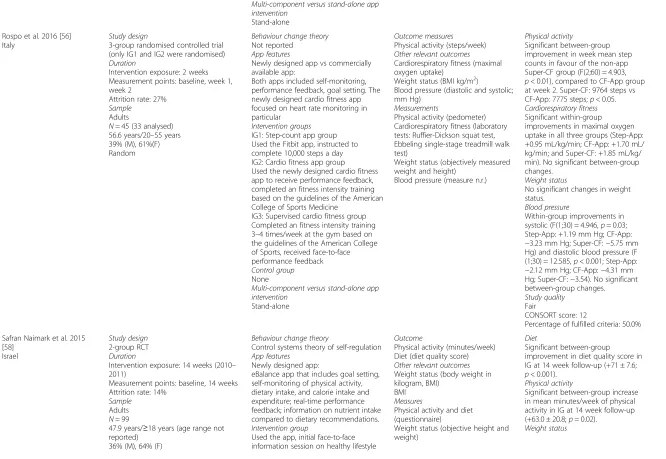
Rospo et al. 2016 [56] Italy
Study design
3-group randomised controlled trial (only IG1 and IG2 were randomised) Duration
Intervention exposure: 2 weeks Measurement points: baseline, week 1, week 2
Attrition rate: 27% Sample
Adults
N= 45 (33 analysed) 56.6 years/20–55 years 39% (M), 61%(F) Random
Behaviour change theory Not reported
App features
Newly designed app vs commercially available app:
Both apps included self-monitoring, performance feedback, goal setting. The newly designed cardio fitness app focused on heart rate monitoring in particular
Intervention groups IG1: Step-count app group Used the Fitbit app, instructed to complete 10,000 steps a day IG2: Cardio fitness app group Used the newly designed cardio fitness app to receive performance feedback, completed an fitness intensity training based on the guidelines of the American College of Sports Medicine
IG3: Supervised cardio fitness group Completed an fitness intensity training 3–4 times/week at the gym based on the guidelines of the American College of Sports, received face-to-face performance feedback Control group None
Multi-component versus stand-alone app intervention
Stand-alone
Outcome measures Physical activity (steps/week) Other relevant outcomes Cardiorespiratory fitness (maximal oxygen uptake)
Weight status (BMI kg/m2)
Blood pressure (diastolic and systolic; mm Hg)
Measurements
Physical activity (pedometer) Cardiorespiratory fitness (laboratory tests: Ruffier-Dickson squat test, Ebbeling single-stage treadmill walk test)
Weight status (objectively measured weight and height)
Blood pressure (measure n.r.)
Physical activity
Significant between-group improvement in week mean step counts in favour of the non-app Super-CF group (F(2;60) = 4.903, p< 0.01), compared to CF-App group at week 2. Super-CF: 9764 steps vs CF-App: 7775 steps;p< 0.05. Cardiorespiratory fitness Significant within-group improvements in maximal oxygen uptake in all three groups (Step-App: +0.95 mL/kg/min; CF-App: +1.70 mL/ kg/min; and Super-CF: +1.85 mL/kg/ min). No significant between-group changes.
Weight status
No significant changes in weight status.
Blood pressure
Within-group improvements in systolic (F(1;30) = 4.946,p= 0.03; Step-App: +1.19 mm Hg; CF-App: −3.23 mm Hg; Super-CF:−5.75 mm Hg) and diastolic blood pressure (F (1;30) = 12.585,p< 0.001; Step-App: −2.12 mm Hg; CF-App:−4.31 mm Hg; Super-CF:−3.54). No significant between-group changes. Study quality
Fair
CONSORT score: 12
Percentage of fulfilled criteria: 50.0%
Safran Naimark et al. 2015 [58]
Israel
Study design 2-group RCT Duration
Intervention exposure: 14 weeks (2010– 2011)
Measurement points: baseline, 14 weeks Attrition rate: 14%
Sample Adults N= 99
47.9 years/≥18 years (age range not reported)
36% (M), 64% (F)
Behaviour change theory
Control systems theory of self-regulation App features
Newly designed app:
eBalance app that includes goal setting, self-monitoring of physical activity, dietary intake, and calorie intake and expenditure; real-time performance feedback; information on nutrient intake compared to dietary recommendations. Intervention group
Used the app, initial face-to-face information session on healthy lifestyle
Outcome
Physical activity (minutes/week) Diet (diet quality score) Other relevant outcomes Weight status (body weight in kilogram, BMI)
BMI Measures
Physical activity and diet (questionnaire)
Weight status (objective height and weight)
Diet
Significant between-group improvement in diet quality score in IG at 14 week follow-up (+71 ± 7.6; p< 0.001).
Physical activity
Significant between-group increase in mean minutes/week of physical activity in IG at 14 week follow-up (+63.0 ± 20.8;p= 0.02).
Weight status
et
al.
Internationa
lJournal
of
Behavioral
Nutrition
and
Physical
Activity
(2016) 13:127
Page
13
of
Random Control group
Information session on healthy lifestyle only, instructed to continue living a healthy lifestyle as they understood it Multi-component versus stand-alone app intervention
Multi-component
Significant between-group decrease in body weight (kg) in IG at 14 week follow-up (−1.44 ± 0.40;p= 0.03). Significant between-group decrease in BMI in IG at 14 week follow-up (−0.48 k/m2± 0.13;p= 0.03). Study quality
High
CONSORT score: 16.5
Percentage of fulfilled criteria: 67.3%
Silveira et al. 2013 [33] Van Het Reve et al. 2014 [34] Switzerland
Study design 3-group CT Duration
Intervention exposure: 12 weeks Measurement points: baseline, 12 weeks Attrition rate: 25%
Sample Older adults N= 44
75.0 years/> 65 years 36% (M), 64% (F) Convenience
(participants in the intervention groups were randomised but not participants in the control group)
Behaviour change theory
Motivation theory, Transtheoretical model
App features
Commercially available app: ActiveLifestyle app that includes autonomous strength-balance physical training for independently living older adults. A strength-balance training plan with three levels: beginner, intermediate, and expert. Individual motivation strategies: positive and negative reinforcement, goal setting, self-monitoring, awareness. Social motivation strategies: social comparison, monitoring of peers, emotional support, collaboration with peers to reach common in-game goals. Additional features: a virtual training plan community and communication features (i.e., private text messaging in the app, a bulletin board with links to newspapers, videos, and websites) Intervention group
IG 1: Individual group that followed training using the individual version of ActiveLifestyle (=individual motivations strategies);
IG 2: Social group that followed training using the social version of the ActiveLifestyle app (= the individual and social motivation strategies, the virtual training plan community and communication features) Control group
Followed exercises with printed information without additional motivation strategy.
Multi-component versus stand-alone app intervention
Stand-alone
Outcome
Physical activity (gait speed: preferred and fast walking speed) Other relevant outcomes None
Measures
Physical activity (gait speed by GAITRite walkway)
Physical activity
Significant within-group increase in preferred gait speed across all groups at 12-week follow-up (p< .001). However, no significant between-group changes. Significant within-group and between-group increases in gait speed at 12-week follow-up. Participants walked significantly faster at post-test (1.72 m/s) than at pre-test (1.56 m/s;F=20.1,p< .001, ç =0.41). The main effect of group was also significant (F=5.3,p= .01 ç =0.27). The individual group (1.89 m/s) was significantly faster than the control group (1.45 m/s; t =3.94,p= .003, d = 1.31), and faster than the social group (1.58 m/s; t =2.05,p= .08, d = .89), though the latter did not reach statistical significance.
Study quality Low
CONSORT score: 12
Percentage of fulfilled criteria: 48.0%
et
al.
Internationa
lJournal
of
Behavioral
Nutrition
and
Physical
Activity
(2016) 13:127
Page
14
of
Smith et al. 2014 [29], Lubans et al. 2016 [30]
Australia
Study design 2-group cluster RCT Duration
Intervention exposure: 20 weeks (Dec 2012 - June 2013)
Measurement points: baseline, 8 months (post-intervention), 18 months Attrition rate: 19%
Sample Children N= 361
12.7 years/12–14 years 100% (M)
Random
Behaviour change theory Self-determination theory, social cognitive theory
App features Newly designed app:
Goal setting for physical activity and screen time, self-monitoring (uploading pedometer measured steps), tailored motivational and informational messages via‘push prompts’, assessment of resistance training skill competency, re-cording fitness challenge results, resistance training and aerobic exercises. Intervention group
Goal setting, self-monitoring (steps through pedometer), fitness challenge during school sport sessions, teacher professional development, provision of fitness equipment to schools, face-to-face physical activity sessions led by teachers, lunchtime student mentoring sessions, researcher-led educational sessions for children, a smartphone application and website, parental education and tips for reducing screen time through newsletter
Control group
Usual practice (regular school sports and PE lessons)
Multi-component versus stand-alone app intervention
Multi-component
Outcome
Physical activity (moderate-to-vigorous, total; minutes/day) Sugar-sweetened beverages consumption (glasses/day) Other relevant outcomes Fitness
Weight status (BMI, waist circumference, body fat) Measures
Accelerometer (worn on 7 consecutive days including weekend)
Diet
Significant between-group decrease in mean glasses/day of sugar-sweetened beverage consumption in IG (−0.6 ± 0.26;p= 0.01) at 8-months follow-up. No significant intervention effects at 18-months follow-up. Physical activity
No significant changes in daily MVPA or overall PA at 8-months and 18-months follow-ups.
Sedentary behaviour
Significant between-group difference in mean minutes/day screen-time in favour of IG at 8-months follow-up (−30.0 ± 10.08;p= 0.03) and 18-months follow-up (−32.2; 95% CI: −53.6- -10.8;p= 0.03).
Fitness
Significant between-group increase in muscular endurance in IG as mea-sured by mean push-ups repetitions (0.9 ± 0.49;p=0.04) and resistance training skills (mean units 5.7 ± 0.67; p<0.001) at 8–months follow-up. Intervention effect was sustained for resistance training skills at 18-months follow-up (mean units 5.9, 95% CI: 4.5-7.3;p< 0.001)
Weight status
No significant intervention effects for BMI, waist circumference and percent of body fat at 8-months and 18-months follow-ups.
Study quality High
CONSORT score: 21.5
Percentage of fulfilled criteria: 91.5%
Stuckey et al. 2011 [41] Canada
Study design
Pre-post within-subjects design Duration
Intervention exposure: 8 weeks Measurement points: baseline, week 4, week 8
Attrition rate: 8% Sample Adults N= 26
56.6 years/30–71 years 25% (M), 75%(F)
Behaviour change theory Transtheoretical model App features
Commercially available app:
Self-monitoring: a Smartphone received via Bluetooth info from a blood pressure monitor, a glucometer, and a
pedometer. Weight was manually entered. Smartphones transmitted self-monitoring measurements to the database and allowed participants to interface with the researchers as well as
Outcome measures
Physical activity (steps/day, vo2max) Other relevant outcomes
Weight status (BMI kg/m2, waist circumference)
Blood pressure (diastolic and systolic; mm Hg)
Blood glucose
Cholesterol (LDL, HDL, total, triglycerides; mmol/liter) Measurements
Physical activity (STEP test)
Physical activity
Significant increase in steps/day in IG at 8-week follow-up (+1,086 ± 1613, p= 0.003). Significant increase in vo2max (ml/kg/min) at 8-week follow-up (+5.139 ± 4.911,p< 0.001). Weight status
Significant reduction in BMI in IG at 8-week follow-up (−0.465 ± 0.987, p= 0.002).
Blood Glucose No significant changes.
et
al.
Internationa
lJournal
of
Behavioral
Nutrition
and
Physical
Activity
(2016) 13:127
Page
15
of
view graphical outputs of their personal health
indicators. Intervention group
App intervention plus tailored counselling (every 4 weeks) regarding physical activity and lifestyle
modifications with personal goal setting. Participants received a stage-matched activity booklet addressing self-efficacy, decisional balance, and stage-appropriate processes of change (a 2 month data plan).
Control group None
Multi-component versus stand-alone app intervention
Multi-component
Weight status (objectively measured weight and height)
Blood pressure (sphygmomanometer) Blood glucose and cholesterol (venepuncture)
Blood pressure
Significant reduction in diastolic blood pressure in IG at 8-week follow-up (−4.375 ± 5.640,p= 0.001) Total cholesterol
Significant reduction in total in cholesterol levels in IG at 8-week follow-up (−0.295 ± 0.508,p= .009). Study quality
Low
CONSORT score: 11
Percentage of fulfilled criteria: 45.0%
Van Drongelen et al. 2014 [54]
The Netherlands
Study design 2-group RCT Duration
Intervention exposure: not reported Measurement points: baseline, 3 months, 6 months
Attrition rate: 13.5% Sample
Adults N= 502
40.9 ± 8.4 years/age range: not reported 93% (M), 7% (F)
Random
Behaviour change theory Not reported
App features
Commercially available app: The MORE Energy app contained evidence-based advice tailored to flight schedules and personal characteristics aiming to reduce fatigue and circadian disruption as much as possible. Intervention group
The MORE Energy app + a website containing more background information was developed alongside the smartphone app.
Control group
The participants allocated to the control group received a minimal intervention consisting of access to a secure part of the project website, which contained basic, non-tailored, fatigue and health-related information that was already available within the airline company (such as information about sleep hygiene and the working mechanisms of the biological clock).
Multi-component versus stand-alone app intervention
Multi-component
Outcome
Physical activity (moderate, vigorous; days/week)
Diet (breakfast, meal composition, snacking, hydration, caffeine intake) Other relevant outcomes
None Measures
Self-report, questionnaires
Diet
Significant between-group improvement in snacking behaviour in IG at 6-months follow-up (β=−0.81,p< 0.001). Physical Activity
Significant between-group increase in vigorous physical activity in IG at 6-months follow-up (β= 0.17, p= 0.028)
Study quality High
CONSORT score: 17
Percentage of fulfilled criteria: 68.0%
Walsh et al. 2016 [55] Ireland
Study design 2-group RCT Duration
Intervention exposure: 5 weeks
Behaviour change theory
Capability, Opportunity, Motivation, Behaviour (COM-B) framework, Behavior Change Wheel
Outcome
Physical activity (steps/day) Other relevant outcomes None
Physical activity
Significant between-group improvements in favour of the app intervention group (F1,53 = 4.30,
et
al.
Internationa
lJournal
of
Behavioral
Nutrition
and
Physical
Activity
(2016) 13:127
Page
16
of
Measurement points: baseline, 5 weeks Attrition rate: 5%
Sample Adults
N= 58 (55 analysed) 20.55 years/17–26 years 27% (M), 73% (F) Random
App features
Commercially available app: The‘Accupedo-Pro’pedometer app includes goal setting, self-monitoring, performance feedback
Intervention group
Given a walking goal of 10,000 steps a day and information related to the benefits of exercise; instructed to use the app to achieve and monitor the goal
Control group
Given a walking goal of 30 min a day and information related to the benefits of exercise
Multi-component versus stand-alone app intervention
Stand-alone
Measures
Physical activity (Accupedo-Pro pedometer app)
p= 0.043,ηp2 = 0.08); significantly higher increase in steps in app intervention group (2393) compared to control group (1101; t53 = 2.07, p= 0.043. Significant within-group improvements for both intervention group (t27 =−6.14,p< .001) and control group (t26 =−2.25,p= .033). Study quality
Fair
CONSORT score: 12
Percentage of fulfilled criteria: 50.0%
Wharton et al. 2014 [42] USA
Study design 3-group RCT Duration
Intervention exposure: 8 weeks Measurement points: baseline, 8 weeks Attrition rate: 18%
Sample Adults
N= 57 (47 analysed) 42.0 years/18–65 years 26% (M), 74% (F)
Random (but controlled for sex, age and BMI)
Behaviour change theory Not reported
App features
Commercially available app:
The‘Lose It!’app includes self-monitoring of dietary intake; performance feedback via daily calorie gauge graphic, calculated energy allotment and individual anthropometric data
Intervention group 1
Goal setting for weight loss, app group self-monitored dietary intake via an app diary (Lose It!), instruction to expend 150 calories/day via structured exercise, received a chart of physical activity options with approx. energy expenditures for 30, 40, 50 and 60 min.
Intervention group 2
Goal setting for weight loss, personally written diet plan, memo group self-monitored dietary intake via the memo function of their smartphone, face-to-face nutrition counselling sessions prior to the start of study, weekly emails to encourage healthy eating, instruction to expend 150 calories/day via structured exercise, received a chart of PA options with approx. energy expenditures for 30, 40, 50 and 60 min
Intervention group 3
Goal setting for weight loss, personally written diet plan, self-monitoring of dietary intake via paper and pencil
Outcome Diet
Other relevant outcomes Weight status (weight in pounds, BMI)
Measures
Diet (self-report, questionnaire: Healthy Eating Index) Weight status (questionnaire)
Diet
No significant change in dietary intake.
Weight status
No significant difference in between-group change in weight, but significant within-group decrease in body weight in all groups (IG1:−3.5 ± 1.0, IG2:−6.5 ± 1.4, IG3:−4.4 ± 1.2; mean pounds).
No significant change in BMI. Study quality
Low
CONSORT score: 10.5
Percentage of fulfilled criteria: 43.0%
et
al.
Internationa
lJournal
of
Behavioral
Nutrition
and
Physical
Activity
(2016) 13:127
Page
17
of
notebook, personally written diet plan, face-to-face nutrition counselling sessions prior to the start of study, weekly emails to encourage healthy eating, instruction to expend 150 calories/ day via structured exercise, received a chart of PA options with approx. energy expenditures for 30, 40, 50 and 60 min Multi-component versus stand-alone app intervention
Stand-alone
Wang et al. 2015 [43] USA
Study design 2-group RCT Duration
Intervention exposure: 6 weeks Measurement points: baseline, weeks 1, 2, 3, 4, 5, and 6 (Fitbit), 6 weeks (accelerometer)
Attrition rate: 9% Sample Adults N= 67
49.3 years/18–69 years 9% (M), 91% (F) Random
Behaviour change theory Not reported
App features
Commercially available app:
The Fitbit One Tracker that include self-monitoring through a wearable tracker and website/mobile app.
Intervention group
Daily SMS-based physical activity prompts plus self-monitoring with the FitBit One
Control group
Self-monitoring with the FitBit One Multi-component versus stand-alone app intervention
Multi-component
Outcomes
Physical activity (moderate-to-vigorous, total; steps/day and minutes/week)
Measures
Physical activity (accelerometer, Fitbit)
Physical activity
Significant within-group increase in physical activity in IG at 1-week follow-up (steps/day: +1,266, SE: 491, p= 0.01; moderate-to-vigorous phys-ical activity minutes/week: +17.8, SE: 8.5,p= 0.04; total physical activity: +38.3, SE: 15.9,p= 0.02).
Significant within-group increase in moderate-to-vigorous physical activity minutes/week in CG (4.3; SE: 2.0;p= 0.04) at 6-week follow-up. However, the significant within-group changes were not maintained at the weeks 2–6 follow-ups. Moreover, no significant between-group changes in steps, as well as moderate-to-vigorous and total physical activity at 6-week follow-up. Study quality
High
CONSORT score: 17.5
Percentage of fulfilled criteria: 71.4%
Abbreviations:Mmale,Ffemale,IGintervention group,CGcontrol group
et
al.
Internationa
lJournal
of
Behavioral
Nutrition
and
Physical
Activity
(2016) 13:127
Page
18
of
Twenty-three studies [31
–
36, 38, 39, 41
–
46, 48
–
58]
tar-geted adults (mean age: 41.5 years, range: 18
–
71 years)
and four studies [29, 37, 40, 47] targeted children or
ado-lescents (mean age: 12.4 years, range: 8
–
17 years). The
total number of participants across the 27 studies was
2699 (510 children/adolescents, 2189 adults). Samples
sizes ranged from 17 to 502 (mean sample size: 100). The
duration of interventions ranged from 1
–
24 weeks, with
an average intervention duration of 10 weeks. Follow-up
assessments were at 4 weeks (
n
= 5), 8 weeks (
n
= 8),
12 weeks (
n
= 9), 20 weeks (
n
= 2), 6 months (
n
= 2),
9 months (
n
= 1) and 18 months (
n
= 1). Attrition rates
ranged from 0% [36] to 57% [51], with an average attrition
rate of 17%. The majority of studies [31, 33, 35
–
45, 47, 48,
50, 53, 55
–
58] reported higher rates of female
participa-tion (on average 64% of participants were female). The
tar-geted health behaviours were dietary intake (
n
= 13),
physical activity (
n
= 21) and sedentary behaviour (
n
= 5).
Other reported lifestyle-related health outcomes were:
weight status (
n
= 11); fitness (
n
= 3); blood pressure
(
n
= 4); blood glucose (
n
= 1); cholesterol (
n
= 1); and
quality of life (
n
= 2). Ten studies [33, 36
–
38, 43
–
45,
49, 50, 55, 57] targeted a single health behaviour,
whilst 17 studies [29, 31, 35, 39
–
42, 46
–
48, 50
–
56, 58]
tar-geted multiple health behaviours and related health
out-comes. Fourteen studies [33, 37
–
40, 42, 45
–
47, 51, 52,
55
–
57] involved interventions delivered solely via an app
(stand-alone intervention) and 13 studies [29, 31, 35, 36,
41, 43, 44, 48
–
50, 53, 54, 58] involved interventions that
used apps in conjunction with other intervention
strat-egies (multi-component intervention), such as physical
education, parental education, counselling sessions,
printed materials, motivational emails, websites and
pedometer use. Fifteen studies [29, 31, 36
–
39, 45, 46,
48
–
50, 52, 56
–
58] used a newly designed app in the
intervention and 12 studies [33, 35, 40
–
44, 47, 51,
53
–
55] used a commercially available app. Further, 15
of the 27 studies reported intervention designs based on
behaviour change theories, such as Self-determination
Theory (
n
= 3) [29, 35, 37], Transtheoretical Model (
n
= 4)
[31, 33, 41, 48], Social Cognitive Theory (
n
= 4) [29, 39, 44,
46], Theory of Planned Behaviour (
n
= 2) [45, 50], Control
Systems Theory of Self-regulation (
n
= 1) [58], and the
Behaviour Change Wheel (
n
= 1) [55].
Study quality
39, 41, 42, 51, 52]. Most of the 13 interventions that
used an app in combination with other intervention
strategies were of high quality (
n
= 9) [29, 31, 43, 44, 48,
50, 53, 54, 58], whilst most of the 14 stand-alone app
in-terventions were of fair (
n
= 6) [37, 40, 46, 55
–
57] or low
quality (
n
= 6) [33, 38, 39, 42, 51, 52]. Study quality did
not differ markedly between app interventions targeting
multiple health behaviours and related health outcomes
(high:
n
= 8, fair:
n
= 4, low:
n
= 5) and those targeting
a single health behaviour (high:
n
= 3, fair:
n
= 4, low:
n
= 3). On average, the included studies fulfilled 61%
of the assessment criteria (range: 34
–
92%). Most
studies met the CONSORT requirements to provide a
strong scientific rationale and described their
partici-pant eligibility, statistical methods and interventions
clearly. Fewer studies reported sample size
calcula-tions [29, 31, 35, 43, 47, 50, 53
–
55, 57, 58] and
in-cluded randomisation [29, 31, 35, 37, 39, 43
–
48, 50,
52
–
55, 58] and blinding procedures [31, 44
–
50, 53] in
their study design. Attrition rates were reported or
could be calculated for the majority of studies [29, 31, 33,
35
–
51, 53
–
58].
Intervention efficacy
A summary of intervention effects for the included
life-style behaviour outcomes (diet, physical activity, sedentary
behaviour) and related health outcomes (weight status,
fit-ness, blood pressure, glucose, cholesterol, quality of life)
are presented in Table 2. Overall, a slightly larger
propor-tion of single health behaviour intervenpropor-tions (5 out of 10;
50%) [33, 45, 49, 55, 57] showed significant
between-group improvements than multiple health behaviour
inter-ventions (7 out of 17; 41%) [29, 31, 48, 50, 53, 54, 58].
Fur-ther, a larger proportion of interventions that used an app
in conjunction with other interventi