Yang, Z., Rose, S.P., Yang, H.M. and Pirgozliev, V. 2018. Egg production in China. World's Poultry Science Journal.
Egg production in China
by Yang, Z., Rose, S.P., Yang, H.M. and Pirgozliev, V.
Copyright, Publisher and Additional Information: This is the author accepted manuscript. The final published version (version of record) is available online via Cambridge University Press
Please refer to any applicable terms of use of the publisher.
DOI: https://doi.org/10.1017/S0043933918000429
1
Egg production in China 2
Abstract 3
China has been the world’s largest producer of eggs for the last 30 years. There have been
4
considerable recent changes in the structure of the egg industry due to rapid economic growth,
5
improved supply chains and favorable prices. The objective of this report is to examine the
6
changes in the egg industry in China with a special focus on the methods used by poultry
7
producers for egg production within the country.
8
Egg production in China continues to provide the population with a high proportion of
9
their intake of high quality dietary protein. Egg consumption will continue to increase with the
10
rise in the urban population. It is probable that the major increase in demand for eggs will be
11
for out of home consumption and their use in processed food products. Higher levels of
12
production are associated with the spread of intensive systems. The poultry sector is no longer
13
dominated by hundreds of millions of smallholders keeping birds as a sideline activity and many
14
small farmers have ceased production. It is expected that the intensification process will
15
continue to increase. Chinese consumers are becoming more focused on the quality and safety
16
of eggs. Therefore the future developments in the egg production may concentrate on egg
17
quality, safety and traceability of eggs.
18
Keywords: egg production; laying hen; China
19
Introduction 21
China produces more than 40% of all the eggs in the world and its annual production keeps
22
increasing. China is the largest egg producer in the world (Aho, 2002; Magdelaine, 2011). Rapid
23
economic growth, improved supply chains and favourable prices have led to a constant rise in
24
egg consumption. Improving the national food security is a major long-term strategy of the
25
Government and so it has encouraged the development of the laying hen industry within the
26
country (Iddamalgoda et al., 2001; Windhorst, 2006). China has a 5000 year history of egg 27
production but, for almost all of this time, this has been achieved by small-scale backyard
28
family units. However, since the 1980s there has been a rapid expansion of the egg production
29
within the country. Early expansion of the egg industry was led by state-run farms, but the
30
private farming sector now dominates this area of poultry production (Yang, 2000). The
31
numbers of large-scale, vertically-integrated, intensive egg production units have increased
32
significantly at the start of the 21st century. However, smaller husbandry systems that are owned 33
and operated by individual farmers continue to represent a significant part of the overall egg
34
output in the country and still play a key role in a large number of people’s livelihoods (Yang,
35
2011).
36
China is self-sufficient in egg production although a significant proportion of feed
37
ingredients needed for this production is imported. Outbreaks of high pathogenic H5N1 avian
38
influenza virus in China since 2004 have caused serious concern to the laying hen industry and
39
the Chinese Government (Martin et al., 2011). The Government has taken measures to improve 40
biosecurity in the nation by, when necessary, prohibiting all live bird markets in the cities and
41
change in the Chinese egg production industry in the early years of the 21st century. 43
Egg production in China continues to be the largest in the world but there have been
44
considerable recent changes in the structure of the industry. It is important to not only
45
understand the structure of the current Chinese egg industry but also to understand the changing
46
demand for eggs in the Chinese egg market. The objective of this review is to examine the
47
recent changes in the egg industry in China. A further objective is to understand how the
48
industry manages to supply their eggs to the areas of demand and also to explain the methods
49
used by poultry farmers for egg production within China.
50
Production and demand for eggs in China 51
Egg production in China has continued to increase in each of the years since 2000. The average
52
annual growth rate of egg production was approximately 0.6 million tonnes per year from 2000
53
to 2016 (FAO, 2017). In 2016, the total eggs produced in China reached a peak of 31 million
54
tonnes. All of the increase in hen egg consumption in China has been achieved by increasing
55
the amount of domestic production. China is self-sufficient in shell egg production and has a
56
very small number of imported eggs that is offset by a larger, but still relatively small, net export
57
of eggs (FAO, 2017): In 2013, the quantities of imported and exported eggs were 175 and 100
58
000 tonnes, respectively. More than 70% of imported eggs are hatching eggs destined for use
59
as breeding stock. The majority of exported shell eggs are sent to Hong Kong (90%) and Macau
60
(10%). Exported eggs account for only 0.5% of the annual domestic production (USDA, 2014).
61
The egg consumption of the Chinese population has continued to increase in recent years.
62
Eggs contribute approximately 6% of the protein supply in the diets of Chinese citizens. This
63
proportion has increased slowly in recent years, although not at the same rate of increase that
has occurred for pig and poultry meat (Figure 1). Meanwhile, the contribution of protein from
65
cereals has markedly decreased. Urban residents eat approximately 70% more eggs than rural
66
residents but this difference is rapidly changing; The greatest increases in egg consumption
67
have been in the population living in rural areas, whereas egg consumption in the urban
68
population has remained approximately stable (Figure 2). Egg consumption in rural families is
69
still much lower than that in urban families (5.9 kg eggs per capita vs. 10.5 kg eggs per capita
70
in 2012), but with the rapid increase in urbanization it is expected that the future demand for
71
eggs will continue to increase (Wang et al., 2015). In 2010, home consumption of eggs 72
accounted for 53% of egg sales with out of home consumption accounting for 28% and 19%
73
further processed egg (Figure 3). Home consumption of shell eggs increased slowly whereas
74
further processed egg consumption more than doubled (144% increase) between 2000 and 2010,
75
and out of home consumption rose by approximately 40% during this time.
76
In the five years since 2012, the annual revenue for the poultry industry has grown at an
77
average rate of 8.7% per annum (NBSC, 2017). Eggs are mostly sold by the farmers to
78
wholesalers. The proportion of eggs sold through supermarkets is increasing, although not at
79
the rate of the wholesale market for eggs. There is an increasing number of small shops or street
80
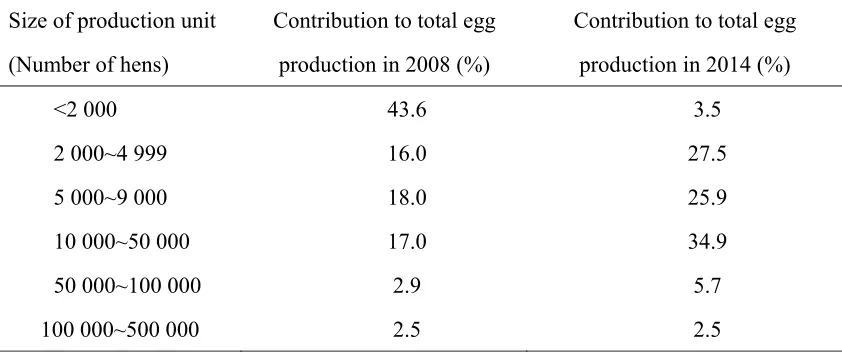
stalls that sell poultry products and this remains the dominant route for egg sales in the country.
81
The retail egg price is approximately 30-40% greater than the price received by the egg
82
producers. Urban families with high incomes are becoming increasingly concerned about their
83
long-term health and the state of the environment and some are prepared to buy organic or
free-84
range eggs. Speciality eggs are emerging in response to the demand from these affluent urban
85
branded and this yields a 2 to 5-fold premium in margin over the generic product (Ke and Han,
87
2007).
88
Egg price has relatively little effect on consumer demand for eggs: The egg market in
89
China is relatively price inelastic and this is particularly the case in urban residents and most
90
profound in those in high income brackets (Table 1) (Ke and Han, 2007). Demand for eggs is
91
more price elastic in rural communities but this is also less evident in high income households
92
with high protein intakes. Low income households have relatively low protein intakes (Popkin
93
and Du, 2003), and at times of high animal protein prices, they would change to buy cheaper
94
alternative foods such as pulses and a higher proportion of grains. The farm price of eggs is
95
therefore highly sensitive to changes in production levels and the supply of eggs. There are
96
seasonal fluctuations in egg price with the lowest prices occurring in late spring and the highest
97
in the autumn (CAAA, 2017) (Li et al., 2010). As discussed in the next section, there is a 98
significant proportion of egg production systems that do not use fully environment-controlled
99
buildings. These systems most probably have large seasonal changes in their egg production
100
from spring to autumn and so have a significant effect on the numbers of eggs that enter the
101
wholesale market at these times. A three year cycle in egg prices is also evident in the Chinese
102
market (Figure 4). Relatively small egg producers tend to have low-cost poultry houses and so
103
have low fixed capital costs for their egg production enterprise. These producers may delay
104
restocking their houses at times of low egg prices and so this results in this cycle of changing
105
egg prices (Gueye, 2009; Zhou and Li, 2012). The decision to
106
Table 1 Income elasticity estimates for eggs for urban and rural households in China, 2005 (Ke
107
and Han, 2007).
Urban households
109
Rural households
110
111
restock may also be affected by changes in the costs of production. In the last decade, egg
112
production costs at farm level have generally changed with the change in layer feed prices. Both
113
the production cost and the feed price reached a peak in 2013. Average cost of the egg
114
production was 8.7 Yuan/kg ($1.31 /kg) and the average feed price was 2350 Yuan/ tonne ($352
115
/tonne) (IEC, 2016). Variation in feed costs remain the major, but not the only, influence on
116
production costs.
117
In conclusion, the egg production continues to provide the population with a high
118
Income group
lowest low Lower
middle Middle
Upper
middle High Highest
10% 10% 20% 20% 20% 10% 10%
Egg
consumption(kg) 8.3 10.2 11 11.6 11.9 12.5 11.5
Elasticity for eggs - 0.469 0.158 0.167 0.081 0.213 -2.027
Income group
low Lower middle Middle Upper middle High
20% 20% 20% 20% 20%
Egg consumption
(kg)
2.6 3.7 4.6 5.6 7.3
Elasticity for
proportion of their intake of high quality dietary protein. Egg consumption will continue to
119
increase with the rise in the urban population. It is probable that the major increase in demand
120
for eggs will be for out of home consumption and their use in further-processed food products.
121
Structure of industry 122
Egg production in China has grown steadily over recent years and there was a 24% increase in
123
production in the ten years from 2006 to 2015. Eggs are produced in all provinces of China but
124
now production is concentrating in a relatively few provinces (Figure 5). Ten Chinese provinces
125
produces 80% of the national eggs. In order to meet the consumer’s demands in the whole
126
nation there is a substantial movement of eggs around the country. Eggs are transported from
127
North and Northeast China to Southeast and South China as well as into big cities like Beijing,
128
Tianjin and Shanghai. The province of Guangdong, in the south of China, has the largest gap
129
between supply and demand with an inflow of 2 million tonnes each year, followed by Shanghai
130
(0.75 million tonnes), Zhejiang (0.7 million tonnes) and Beijing (0.6 million tonnes) (Table 2).
131
The concentration of egg production in the North and North-East of China is probably mostly
132
due to the availability of locally produced cereals as well as good access to ports for imported
133
feedstuffs. Recent major improvements in the transport infrastructure by the Chinese
134
Government have facilitated this centralization in the egg production industry (Démurger,
135
2001).
136
137
Table 2 Net egg flows (million tonnes/ year) and resident population (year-end) (10 000
138
residents) of each province in China in 2015 (Adapted from China Animal Agriculture
139
Association, 2017 and National Bureau of Statistics of China, 2017).
Province Egg flows (million
tonnes/ year) The population (million)
Hebei 1.8 74.3
Henan 1.7 94.8
Liaoning 1.5 43.8
Shandong 1.0 98.5
Jilin 0.5 27.5
Hubei 0.4 58.5
Heilongjiang 0.4 38.1
Sichuan 0.3 82.0
Inner Mongolia 0.3 25.1
Shaanxi 0.1 37.9
Ningxia 0.1 6.7
Xinjiang 0.1 23.6
Tibet 0.1 3.2
Hunan 0.1 67.8
Qinghai 0.1 5.9
Hainan 0.1 9.1
Shanxi 0.1 45.7
Jiangsu 0.1 79.8
Gansu -0.08 26.0
Guizhou -0.1 35.3
Anhui -0.15 61.4
Yunnan -0.2 47.4
Chongqing -0.23 30.2
Guangxi -0.25 48.0
Jiangxi -0.3 45.7
Tianjin -0.4 15.5
Fujian -0.55 38.4
Zhejiang -0.7 55.4
Shanghai -0.75 24.2
Guangdong -2.0 108.5
*Positive number represents the quantity of the exported eggs to other provinces; Negative
141
number represents the quantity of the imported eggs to the province.
142
143
Henan, Shangdong, Hebei, Liaoning, Sichuan and Jiangsu, the six largest egg-producing
144
provinces, accounted for nearly 61% of the total production of the country (NBSC, 2017). Most
145
of these provinces have increased their egg production in recent years, except for Hebei. The
146
reduction in egg production in Hebei may be due to the relatively large number of small egg
147
producers in this province that may be ceasing production due to Government legislation, the
148
poorer viability of relatively small-scale production methods and the availability to them of
149
other employment opportunities in the nearby, rapidly developing, urban areas (Li et al., 2010). 150
Intensification of egg production has occurred throughout the country. In 2008, 43% of all
151
eggs produced were from flocks with sizes less than 2000 hens, but in 2014 this size of egg
152
producer only supplied 4% of the total eggs produced in China (Table 3). Large numbers of
153
relatively small independent egg producers still exist and, in 2014, over 50% of all eggs
154
produced were from flock sizes of less than 10 000 hens. However, large integrated companies
155
have also been established and many of these manage large operations. The top six largest egg
156
producers (Beijing Huadu Yukou Poultry Company, Beijing Pinggu Charoen Pokphand, Beijing
157
Deqingyuan Poultry Company, Anhui Rong Da and Shanxi Dajiang Nongke ) have flock sizes
158
of more than 5 million laying hens. Such companies are mostly vertically integrated and manage
159
the bird husbandry, feed milling, transport and distribution of the eggs. The recent increases in
the average size of Chinese egg production units are similar to the way which the egg production
161
industries of developed countries, such as European Union and United States, changed in
162
previous years (Mench et al., 2011).
163
164
Table 3 Size of laying hen units and their contribution to the proportion of total eggs produced
165
in China in 2008 and 2014 (Adapted from China Animal Agriculture Association, 2016)
166
167
Management methods 168
Eggs are primarily produced in cage systems regardless of the size of the enterprise. Ninety
169
percent of eggs are produced from cage systems with 9% in free-range systems and 1% in barn
170
systems (IEC, 2016). Large, modern egg production farms increasingly use
environment-171
controlled buildings in which cages incorporate automatic feed delivery and automatic egg
172
collection equipment (Table 4). Recently built egg production farms are typically on sites with
173
up to half a million hens. There are only a few sites that have more than a million birds.
174
Small egg production farms (less than 10 000 hens) typically use houses, such as polythene
175
Size of production unit
(Number of hens)
Contribution to total egg
production in 2008 (%)
Contribution to total egg
production in 2014 (%)
<2 000 43.6 3.5
2 000~4 999 16.0 27.5
5 000~9 000 18.0 25.9
10 000~50 000 17.0 34.9
50 000~100 000 2.9 5.7
tunnels, old greenhouses, or other farm buildings, that have little, or poor, environmental control.
176
The tiered cages that are installed in these buildings often have little automation and so feed is
177
delivered by hand and eggs are collected manually (Table 4). This type of production requires
178
a high labour input and this is mostly provided by farmers who are keeping birds as a sideline
179
activity. However less people now like to work in the rural countryside an there are better
180
employment opportunities in urban areas. Many small farmers have given up production.
181
There has been growth in the free-range and organic chicken production segments over
182
the past five years, but these account for a very small number of chickens farmed. However this
183
is slowly shifting as Chinese consumers are now increasingly willing to buy cage-free eggs
184
(Wang et al., 2017; Rakonjac et al., 2014; Zhang et al., 2016). 185
Laying hen strains that produce brown shelled eggs are the predominant stock used in the
186
Chinese industry. Approximately 70% of eggs sold are brown shelled (IEC, 2017). Hyline
187
supplies 77% of all the laying stock (brown shelled eggs) whereas a Chinese breeding company,
188
Jinghong and Jingfen, supply 12% of the birds (tinted brown shells) (NBSC, 2017). The
189
remaining 11% of laying stock are supplied by Lohmann (brown shelled eggs), Nongda (white
190
shelled eggs) and there are some traditional breeding companies that produce stock that lay
191
green shelled eggs.
12
Table 4 Management methods in different scale farms (Yang et al., 2014).
193
194
Number of hens/ farm
Percent in
tiered cages
Drinker type Feeding type Egg collection
Water
trough
Nipple or cup
drinker
Manual feeding Automated feeding
Manual egg
collection
Automated egg
collection
<2 000 92.5 22.2 77.8 98.5 1.5 99.5 0.5
2 000~4 999 87.2 15.1 84.9 96.9 3.1 99.7 0.3
5 000~9 000 87.7 11.1 88.9 88.9 11.1 99.4 0.6
10 000~50 000 92.9 8.6 91.4 61.6 38.4 96.1 3.9
50 000~100 000 91.4 2.3 97.7 31.8 68.2 88.1 11.9
There are no formal regulations for stocking densities in laying hen units, so farmers tend
195
to stock to the economic optimum. Most large integrated companies keep flocks for a 60 to 70
196
weeks laying period whereas small independent producers may use extended laying periods
197
depending on the market conditions that prevail.
198
Conclusions 199
Egg production continues to provide the population with a high proportion of their intake of
200
high quality dietary protein. Egg consumption will continue to increase with the rise in the
201
urban population. It is probable that the major increase in demand for eggs will be for out of
202
home consumption and their use in further-processed food products. The poultry sector is no
203
longer dominated by hundreds of millions of smallholders keeping birds as a sideline activity.
204
Many small farmers have given up production, especially in the economically more developed
205
eastern provinces of the country. In the future, it is expected that the intensification process will
206
continue. Small-scale and non-commercial farmers will continue their exit from the industry.
207
It is possible that the number of poultry farmers in China could halve by 2020. The egg
208
production is concentrated in some regions of China and there is a logistical network evolving
209
that distributes the eggs to the consumer. Chinese consumers are becoming more focused on
210
the quality and safety of eggs. Therefore the future developments in the egg production market
211
may concentrate on egg quality, safety and traceability of eggs.
212
Acknowledgments 213
This review was produced as part of the Project of Jiangsu Province Policy Leading Program
214
of the People’s Republic of China (SZ-HA2017010) and the Scientific Research Foundation
of PhD Student of Yangzhou University.
216
References 217
AHO, P. W. (2002) The World’s commercial chicken meat and egg industries. In: Bell D.D.,
218
Weaver W.D. (eds) Commercial Chicken Meat and Egg Production. pp. 3-17 (US, Springer). 219
CAAA (2017) China Animal Agriculture Association. http://www.caaa.cn/ (Accessed
220
15/11/2017).
221
DEMURGER, S. (2001) Infrastructure development and economic growth: an explanation for
222
regional disparities in China. Journal of Comparative Economics, 29: 95-117.
223
FAO (2017) FAO Country star. http://www.fao.org/faostat/en/#data/TP (Accessed 15/11/2017).
224
IDDAMALGODA, A., HAYASHI, S., GOTO, E., SUGIYAMA, M. and OGURI, K. (2001)
225
Current Asian trends in egg production and consumption: a demand analysis of selected
226
countries. World’s Poultry Science Journal57: 49-54. 227
IEC (2017) International Egg commission https://www.internationalegg.com/ (Accessed
228
15/11/2017).
229
GODFRAY, H. C. J., BEDDINGTON, J. R., CRUTE, I. R., HADDAD, L., LAWRENCE, 230
D., MUIR, J. F., PRETTY, J., ROBINSON, S., THOMAS, S. M. and TOULMIN, C. (2010)
231
Food security: the challenge of feeding 9 billion people. Science327: 812-818. 232
GUEYE, E. F. (2009) The role of networks in information dissemination to family poultry
233
farmers. World's Poultry Science Journal65: 115-124. 234
KE, B. and HAN, Y. (2007) Poultry sector in China: structural changes during the past decade
235
the International Poultry Conference, Bangkok. pp. 1-33. 237
LI, Z. M., XU, S. W., DONG, X. X., LI, G. Q., LIU, H. and WANG, Y. T. (2010) The
short-238
term market price transmission mechanism of egg industry chain in China. Scientia Agricultura 239
Sinica 43: 4951-4962. 240
MAGDELAINE, P. (2011) Egg and egg product production and consumption in Europe and
241
the rest of the world. In: Improving the safety and quality of eggs and egg products: Egg
242
chemistry, production and consumption, Vol. 1, pp. 3-16 (UK, Woodhead Publishing).
243
MARTIN, V., PFEIFFER, D. U., ZHOU, X., XIAO, X., PROSSER, D. J., GUO, F. and 244
GILBERT, M. (2011) Spatial distribution and risk factors of highly pathogenic avian influenza
245
(HPAI) H5N1 in China. PLoS pathogens 7: 1-11. 246
MENCH, J. A., SUMNER, D. A. and ROSEN-MOLINA, J. T. (2011) Sustainability of egg
247
production in the United States—The policy and market context. Poultry Science, 90: 229-240.
248
NBSC (2017) National Bureau of Statistics of China. http://data.stats.gov.cn/index.htm
249
(Accessed 16/11/ 17).
250
POPKIN, B. M. and Du, S. (2003) Dynamics of the nutrition transition toward the animal
251
foods sector in China and its implications: a worried perspective. The Journal of Nutrition, 133:
252
3898S-3906S.
253
RAKONJAC, S., BOGOSAVLJEVIĆ-BOŠKOVIĆ, S., PAVLOVSKI, Z., ŠKRBIĆ, Z., 254
DOSKOVIĆ, V., PETROVIĆ, M. D. and PETRIČEVIĆ, V. (2014) Laying hen rearing
255
systems: A review of major production results and egg quality traits. World's Poultry Science 256
TAN, Z., SHEN, Y. and YANG, D. (2013) The effect and influence of closing live poultry
258
markets to control and prevent human avian influenza infection. Chinese Journal of Health 259
Policy 6: 67-85. 260
USDA (2014) International egg and poultry review. United State Department of Agriculture.
261
https://www.usda.gov/ (Accessed 16/11/ 17).
262
WANG, J., CHEN, J. and LIU., H. (2015) China’s egg consumption and its influencing
263
factors. Agricultural Outlook1: 75-80. 264
WANG, J., YUE, H., WU, S., ZHANG, H. and QI, G. (2017) Nutritional modulation of
265
health, egg quality and environmental pollution of the layers. Animal Nutrition3: 91-96. 266
WINDHORST, H. W. (2006) Changes in poultry production and trade worldwide. World’s 267
Poultry Science Journal62: 585-602. 268
YANG, N. (2000) Review and prospect of Chinese egg industry on the eve of the new
269
century. China Poultry22: 1-3. 270
YANG, N., QIN, F., XU, G., ZHAO, Y., XUE, L. and ZHOU, X. (2014) Analysis of current
271
status of Chinese egg industry in 2013. China Poultry36: 2-9. 272
YANG, N. (2011) Social economic aspects of egg production in China. In: Improving the safety
273
and quality of eggs and egg products: Egg chemistry, production and consumption, Vol. 2, pp.
274
17-26 (UK, Woodhead Publishing).
275
ZHANG, G., CHEN, A., ZHAO, Y., XU, Z., CHEN, G. and YANG, S. (2016) Egg safety
276
standards in China need to be improved. Journal of Food Protection 79: 512-515. 277
Journal of Beijing University of Agriculture 27: 49-52. 279
280
Figure 1 The contribution of different human foods to the total protein supply in China (Adapted from FAO, 2017).
0.00 2.00 4.00 6.00 8.00 10.00 12.00 14.00 16.00 18.00
2000 2002 2004 2006 2008 2010 2012
Contribution of foods to dietary protein intake (% of total protein)
Year
Figure 2 Egg consumption of urban and rural people in China (Adapted from National Bureau of Statistics of China, 2017).
0 2 4 6 8 10 12
0 100 200 300 400 500 600 700 800
2005 2006 2007 2008 2009 2010 2011 2012
Egg consumption (kg/ person/ year) Number of
people (million)
Year The population of urban residents (million people)
The population of rural residents (million people)
Figure 3 Egg consumption in China from 2000 to 2010 (Adapted from National Bureau of Statistics of China, 2017).
0 5 10 15 20 25 30
2000 2001 2002 2003 2004 2005 2006 2007 2008 2009 2010
Egg consumption (million tonnes/year)
Year Out of home consumption
Home consumption
Figure 4 Annual trend of egg price in China from 1997 to 2013 (Yuan1/kg) (Adapted from China Animal Agriculture Association, 2017).
1Currency conversion used: One Chinese Yuan =0.15 US$
2Vertical lines indicate the duration of egg price cycle. 4
5 6 7 8 9 10 11 12
Jun-97 Jun-98 Jun-99 Jun-00 Jun-01 Jun-02 Jun-03 Jun-04 Jun-05 Jun-06 Jun-07 Jun-08 Jun-09 Jun-10 Jun-11 Jun-12 Jun-13
Egg price (Yuan1/kg)
Figure 5 The output of poultry eggs (million tonnes per year) and the resident population (year-end) of China in 2015 (Adapted from National Bureau of Statistics of China, 2017).