Routing Algorithm of Wireless Sensor Network and
Robustness Analysis Based on Fuzzy Mathematics
https://doi.org/10.3991/ijoe.v13i12.7888
Ying Xiang!!"
Changzhou Vocational Institute of Mechatronic Technology, Changzhou, China; [email protected]
Miaochao Chen Chaohu University, Chaohu, China;
Xiaohong Zhuang
Changzhou Vocational Institute of Mechatronic Technology, Changzhou, China;
Xiaoxing Li
Future Land Holdings Co., Ltd, Shanghai, China
Abstract—In order to reduce the energy consumption and enhance the ro-bustness of wireless sensor network (WSN), this paper proposes a hierarchical clustering routing algorithm based on fuzzy mathematics (HCRAFM). To make a comprehensive analysis of WSN, it is also necessary to detect the robustness of the network. Facing the multiple random variables, the traditional robustness detection models assume that all nodes have the same weight, making it impos-sible to quantify the analysis indices or obtain accurate results. Thus, the fuzzy mathematics theory was introduced to the WSN robustness detection, forming a fuzzy comprehensive evaluation method. The simulation results show that the HCRAFM strikes a load balance between WSN nodes, extends the life cycle of each node, and prolongs the service life of the network. In addition, the pro-posed algorithm is proved to have sound robustness and strong applicability.
Keywords—Routing Algorithms; Robustness Analysis; Wireless Sensor Net-work (WSN); Fuzzy Mathematics
1
Introduction
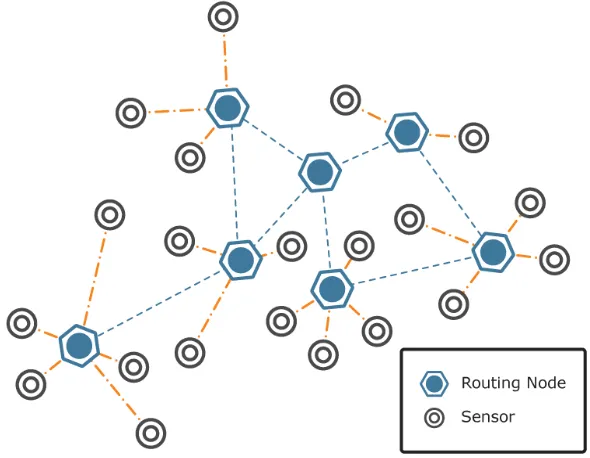
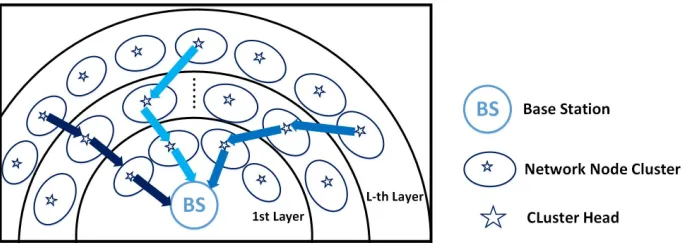
Fig. 1. Structure of a typical WSN
One of the most popular routing algorithm is clustering routing algorithm. The al-gorithm divides the network nodes into several clusters according to certain rules, such that each cluster contains a cluster head and a plurality of member nodes [4]. The overall closeness between cluster head and member nodes serves as the hallmark feature of the corresponding cluster [5]. The cluster head is selected from all nodes in the cluster by evaluating the residual energy of each node. In each round of computa-tion, the selection of cluster head and the construction of routing topology consume an even shorter time than the stabilization of data acquisition and transmission.
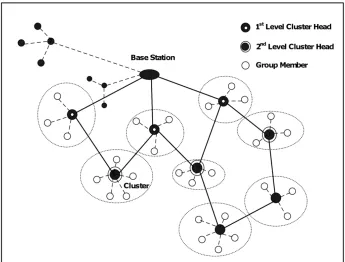
The clustering routing algorithm supports both single-hop routing with one cluster head and multi-hop routing with several cluster heads. With direct data transmission between the cluster head and other network nodes, the single-hop routing does not require lots of information on the routing table [6][7] or much node storage space for network expansion. In this case, the network scalability is positively proportional to the speed of the cluster head.
Fig. 2. Classical multi-hop clustering routing algorithm
As its name suggests, the WSN is a wireless network consisting of numerous sen-sor nodes with sensing, computing and communication functions. The network has been extensively applied to smart cities, precision agriculture, environmental monitor-ing and many other emergmonitor-ing fields. Since the sensor nodes are usually powered by a limited number of batteries, it is a hot topic and key point to reduce the energy con-sumption of WSN.
Proper routing is one of the most effective ways to lower the energy demand of WSN. Several clustering routing algorithms have been developed for this purpose. The first of this kind is the low energy adaptive clustering hierarchy (LEACH) algo-rithm, in which all nodes share the same probability of becoming cluster head. Thus, the energy consumption is evenly distributed across all nodes in the network [11]. Nonetheless, this algorithm also has a downside: the cluster heads are in single-hop mode and communicate with the base station (BS), so that the nodes far away from the BS inevitably consume an excessive amount of energy.
demand greater energy to forward the huge amount of head information from remote clusters [13].
To solve the above problems, some non-uniform clustering methods have been in-vented, namely the energy-efficient uneven clustering (EEUC) algorithm, the distrib-uted energy-balanced unequal clustering routing protocol (DEBUC), and the uneven clustering routing protocol based on dynamic partition (UCDP). These methods re-duce data forwarding tasks, shorten the communication radius of near-BS clusters, thereby improving the load balance of the whole network.
From single-hop clustering to multi-hop routing, and then to non-uniform cluster-ing, the research into WSN energy conservation has become increasingly extensive and in-depth. However, there is still great room for improving the rationality of clus-tering, especially cluster head communication, without obvious increase in computing load [14]. For instance, the hierarchical design model can be introduced to consider the energy consumption, density and centrality of nodes prior to selecting cluster head. After the selection, it is wise to adopt multi-hop routing for cluster head com-munication. These moves are likely to further balance node load and slash the energy consumption of the network. If there is no complicated mathematical modelling, the fuzzy algorithm can be employed to select cluster heads, as it is able to prioritize some factors after evaluating the multiple factors of WSN.
In light of the above, this paper proposes a hierarchical clustering routing algo-rithm based on fuzzy mathematics (HCRAFM) for WSN. First, the network was di-vided into multiple layers based on the distance to the BS. In each layer, the number of cluster heads is negatively correlated with the cluster-BS spacing. Then, the cluster heads were selected by fuzzy algorithm, considering the residual energy, density and centrality of nodes. Finally, the cluster heads transmitted data to establish a multi-hop routing with the BS. The proposed algorithm can balance network load and reduce energy consumption without pushing up the computing complexity.
2
HCRAFM
2.1 WSN and energy model
(
)
(
)
2
1 0
4
2 0
,
,
elec amp
t
elec amp
E
d E
k d d
E
E
d E
k d d
!
+
"
"
<
#
=
$
+
"
"
%
#&
(1)r elec
E k E
=
!
(2)whereEelecis the energy consumption of the transceiver;Eamp1and Eamp2are the en-ergy consumption of the amplifier in the free space model and multipath fading mod-el, respectively. The two models should be selected based on the communication distance d0.
2.2 Network stratification
The roulette strategy was employed in the HCRAFM. Each round is implemented in the following steps. First, the network was divided into several layers based on the relationship between energy and communication distance. Then, the layer of each node was determined according to the distance from the BS. Finally, the number of cluster heads in each layer was identified depending on the number of nodes in the layer and the distance of the layer from the BS [17]. The shorter distance between the layer and the BS means that its cluster is much closer to the BS.
The purpose of the HCRAFM is to reduce the data forwarding tasks of near-BS sensor nodes and achieve the load balance across the network. Considering the three variables (node energy, density and centrality) of each layer, multiple clusters were selected by fuzzy algorithm. The cluster heads did not die prematurely, and the intra-cluster communication consumed less energy. The other nodes joined the intra-clusters formed around the nearest cluster head. The intra-cluster communication followed the single-hop mode, while the inter-layer communication was completed via a multi-hop routing between the cluster heads and the BS. Thus, there was no long-distance transmission of signals [18].
According to the residual energy of cluster heads and the time of each round, the cluster heads were re-selected and a new route was established to maintain the rout-ing.
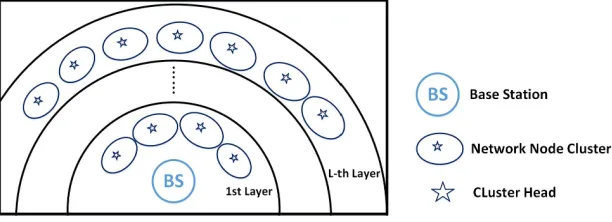
As shown in Figure 3, the network has been divided to L layers based on the d0 in the energy model. Let d be the distance from a node to the BS. Then, the maximum node-BS distance Dmaxis:
(
)
(
)
max j
,
d
=
MAX d SN BS
(3) max 0
2
d
L
d
!
"
=
$
#
%
&
'
(4)The sensor node
SN
j belongs to the number of thel
-th layer,0
2
d
jl
d
!
"
=
$
#
%
&
'
(5)In this way, the communication distance between cluster heads and layers became shorter than
d
0, thus lowering the energy consumed in remote communication. The number of cluster heads in each layer is inversely proportional to the number of layers L, and positively proportional to the number of nodesN
lin thel
-th layer. Thus, both the number of cluster headsCl
in the near-BS layer and the energy consumption of intra-cluster communication exhibited a decreasing trend. TheCl
is calculated as follows: lN
Cl K
l
=
!
(6)2.3 Cluster head selection
The fuzzy algorithm has the advantages of simple structure and good robustness, without needing to go through complicated mathematical modelling [8][9]. Fuzzy variables and rules were applied to the sensor network layer of each layer, and the nodes prioritized by fuzzy algorithm were selected as cluster heads.
Fuzzy variables.
Relative energy. The relative energy RE is the ratio the residual energy Eiof node
i
SNto the maximum residual energy Emax.
Relative density. The node density refers to the density of nodes in the vicinity of a node. It is expressed as the number
D
i of neighbouring nodes in the communication ranged
0 of nodeSN
i. The higher the density, the less energy is needed to transmit data from the node to the neighbouring nodes. The relative density RD is the ratio of the density Diof nodeSN
ito the maximum density Dmax of the nodes in the cluster of node SNi.max i
D
RD
D
=
(8)Relative centrality. The node centrality Cidescribes the proximity of node
SN
i to its neighbouring nodes. It is expressed as the formula below.2 2
1 1
1
n1
ni i j i j
j j
C
x
x
y
y
n
=n
=!
"
!
"
=
$
#
%
+
$
#
%
&
(
'
&
(
'
(9)where
x
i andy
iare respectively the x- and y- coordinates of nodeSN
i. The higher the cen-trality, the less energy is needed to transmit data from the node to the neighbouring nodes. The relative centrality RC is the ratio of the centrality Ci of nodeSN
i to the minimum centralitymin
C of the nodes in the cluster of node SNi.
min i
C
RC
C
=
(10) Fuzzification of variables. The fuzzification of variables is to map each input val-ue to the corresponding fuzzy set and assign membership functions to each fuzzy set [10]. Assuming that the relative energyRE e
i=
*, relative densityRD d
i=
* and relative centralityRC c
i=
*, the corresponding fuzzy inputsE e
*( )
,D d
*( )
and( )
*
C d
can be represented as:( )
**
*
1,e e
0,e e
E e
=
!
"
=
( )
**
*
1,
0,
c c
C d
c c
!
=
=
"
#
$
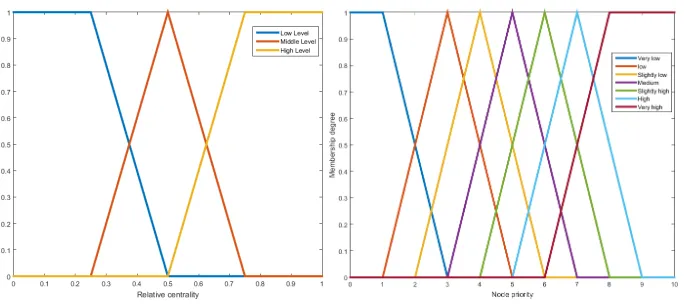
(13)Triangular and trapezoidal membership functions were adopted because of their applicability to real-time computing. Based on the 3 fuzzy input variables, i.e., rela-tive energy, relarela-tive density and relarela-tive centrality [17], the HCRAFM outputted an output variable: node priority. The output variable depicts whether a node has been selected as a cluster head.
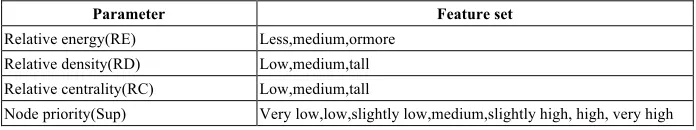
By empirical experience, the fuzzy subsets and fuzzy membership functions were established corresponding to the input and output variables. The resulting variables and fuzzy sets are listed in Table 1.
Table 1. Parameters and feature set
Parameter Feature set
Relative energy(RE) Less,medium,ormore
Relative density(RD) Low,medium,tall
Relative centrality(RC) Low,medium,tall
Node priority(Sup) Very low,low,slightly low,medium,slightly high, high, very high
(a) Relative energy vs. Membership degree (b) Relative density vs. Membership degree Fig. 4. Relative energy and relative density vs. membership degree
(a) Relative centrality vs. Membership degree (b) Node priority vs. Membership degree Fig. 5. Relative centrality and node priority vs. membership degree
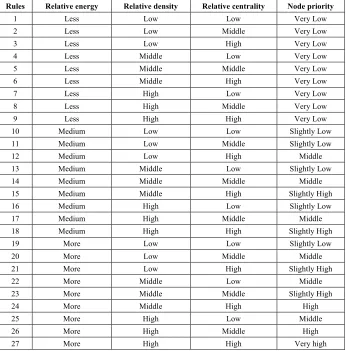
Table 2. Fuzzy rules
Rules Relative energy Relative density Relative centrality Node priority
1 Less Low Low Very Low
2 Less Low Middle Very Low
3 Less Low High Very Low
4 Less Middle Low Very Low
5 Less Middle Middle Very Low
6 Less Middle High Very Low
7 Less High Low Very Low
8 Less High Middle Very Low
9 Less High High Very Low
10 Medium Low Low Slightly Low
11 Medium Low Middle Slightly Low
12 Medium Low High Middle
13 Medium Middle Low Slightly Low
14 Medium Middle Middle Middle
15 Medium Middle High Slightly High
16 Medium High Low Slightly Low
17 Medium High Middle Middle
18 Medium High High Slightly High
19 More Low Low Slightly Low
20 More Low Middle Middle
21 More Low High Slightly High
22 More Middle Low Middle
23 More Middle Middle Slightly High
24 More Middle High High
25 More High Low Middle
26 More High Middle High
27 More High High Very high
Defuzzification. Defuzzification is the transformation of the output generated by fuzzy rules into practical variables [7]. The centroid point method was adopted for defuzzification. The process is expressed as follows:
( )
( )
supsup
sup
x
x dx
x dx
µ
µ
!
=
"
"
(14)Here we set the relative energy, relative density and relative centrality of SNito
0.765, 0.5, 0.5
RE= RD= RC= . Thus, the relative energy falls into the middle level when the membership degree is µ3=0.325, and it falls into the high level when the membership degree is µ4=0.175. The relative density and the relative centrality belong to middle level when the membership degree is equal to 1. The node priority stays on the middle level when the membership degree wasµ3=0.325, and the high level when the membership degree is µ4=0.175.
Therefore, the value of the priority of the SNi node is:
* *
3 4
* *
3 4
sup
sup
sup
midµ
highµ
5.73
µ
µ
!
+
!
=
=
+
(15)2.4 Clustering and routing
Once a node was selected as a cluster head, it would broadcast information to its neighbouring nodes. Upon receiving the information, each neighbouring node would join the cluster of the nearest cluster head, and transmit the information to the cluster head. The purpose is to minimize the cost of the communication between nodes and cluster heads [13].Then, the cluster head would collect, process and send the infor-mation to the BS. The energy consumption of data fusion is denoted as EDA.
The inter-layer routing is shown in Figure 6. In the figure, CHli is the cluster head of the l-th layer. The data to be transmitted to the BS was forwarded by this layer to the nearest cluster head
CH
l!1of l!1-th layer. Then, the cluster headCH
l!1wouldforward the data to the BS. After that, the BS would transmit these data to the nearest cluster head
CH
l!2ofl!2layer. The cluster headCH
1pof each layer would transmitdata to the BS in turns until that of the first layer completed the transmission. At this moment, the multi-hop routing of data was established between the layers and the BS.
If the energy of a cluster head in the l-thlayer was less than half of the average re-sidual energy in the cluster, a new cluster head should be selected and a new cluster should be established within the l-thlayer. Next, a new path would be established to forward the data of the cluster head from the 1st layer to the l-thlayer. After a time of
T has elapsed, the entire network would start a new round of routing.
3
Robustness Evaluation
3.1 Overview
The robustness of WSN means the communication performance of the network is not affected by random external interference under normal conditions. During the robustness evaluation of WSN, the quantitative analysis was transformed into qualita-tive membership principle of fuzzy mathematics. The difference nodes were analysed through inference.
The HCRAFMis very accurate and effective in handling the fuzzy issues that are hard to quantify [5]. In view of the difficulties in quantify the qualitative variables of WSN with mathematical language, the robustness of the network was roughly catego-rized into four levels in the evaluation: extra-high, high, middle and low.
Whereas neither qualitative method or general data analysis can obtain the accurate robustness of WSN, the comprehensive analysis of fuzzy mathematics is capable of measure the exact robustness of the network through detailed discussion of various factors [8], making it possible to acquire quantitative analysis results.
Featuring profound fuzziness, the information vector exists as a fuzzy subset with no specific value. Thus, it is an ideal tool to depict the robustness of the network. The robustness of WSN can be analysed accurately and objectively through fuzzy com-prehensive analysis [10].
3.2 Implementation
Step 1: The robustness of the procedure was explicitly determined by the robust-ness of the target area
U
=
{
U U
1, , , , ,
2!
U
i!
U
m}
, which is a set of comprehensive evaluation indices. Thei th
-
level indices are denoted as{
1,
2,
, ,
}
i i i ij in
U
=
U U
!
U
!
U
and the indices on both thei th
-
and j-th levels are denoted asU
ij.Step 2: The comment set is denoted as V, which is expressed as
{
1, , ,
2 n}
V V V
=
!
V
. Different scores were assigned to the fuzzy subsets to depict the different levels.the requirements of different factors, and the membership evaluation of fuzzy subsets of different scores.
1 11 12 1
2 21 22 2
1 2
n
m
m m m mn
R r r r
R r r r
R
R r r r
! " ! "
# $ # $
# $ # $
= =
# $ # $
# $ # $
% & % &
! ! " " " " "
! (16)
The R matrix is responsible for depicting the relationship between the fuzzy rela-tion matrix U and the comment set V.
Step 4: The fuzzy weight vector of the evaluation factor was clearly defined as A = (A1, A2). This is because the single factors differ in the analysis function.
Step 5: The fusion operation was reasonably configured to fuse A with different metrics R. The different metrics R were used to describe the analysis objects accord-ing to the membership degree of fuzzy subsets obtained in saccord-ingle factor analysis. After fusing different rows with the fuzzy weight vector, the author obtained the dif-ferent metrics relative to the membership degree of fuzzy subsets of difdif-ferent scores. The vector is called the structural vector B for fuzzy comprehensive evaluation. Hence, the model is constructed as:
(
)
(
)
1 2
11 12 1
21 22 2
1 2 1 2 , , , , , n n m m
m m mn
B A R b b b
r r r
r r r
a a a
r r r
= = ! " # $ # $ = # $ # $ % & ! " " " " # # # #
" (17)
The weighted average model was introduced to describe the accurate value of dif-ferent factors, that is, the weighted average operator was adopted for the fuzzy com-prehensive evaluation.
4
Simulation
4.1 Simulation settings
In the MATLAB simulation, the HCRAFM was contrasted with the LEACH and the EECU. A total of 400 wireless sensor nodes were deployed within a 200*200
m
2Table 3. Simulation parameters
Parameters Values
Network coverage area (0,0)200,200)m
Node number 400
Base station location (100, -50) m
Initial energy of node 0.5 J
do 87 m
Eelec 50 nJ/bit
Eamp1 10 pJ/bit/m2
Eamp2 0.0013 pJ/bit/m4
EDA 5 nJ/ (bit.signal)
T 1s
Packet length 4 000 bit
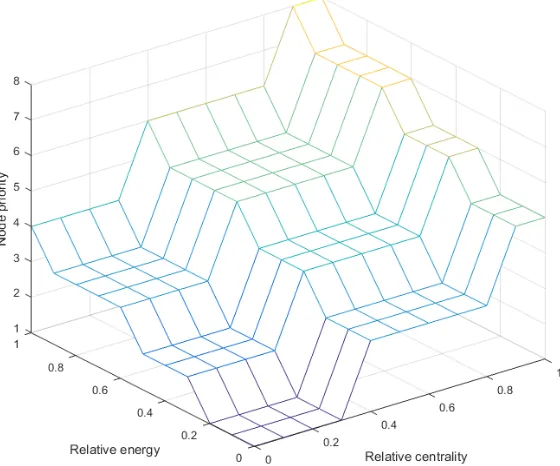
4.2 Fuzzy mathematics model
According to the simulation results in Figure 7, the node priority was small when the relative energy was 0, regardless of the relative centrality or relative density. When the relative energy reached a certain value, the node priority increased with the relative density and relative centrality. The trend indicates that the relative energy is the primary influencing factor on node priority. Of course, the relative density and centrality also have a significant impact on the node priority.
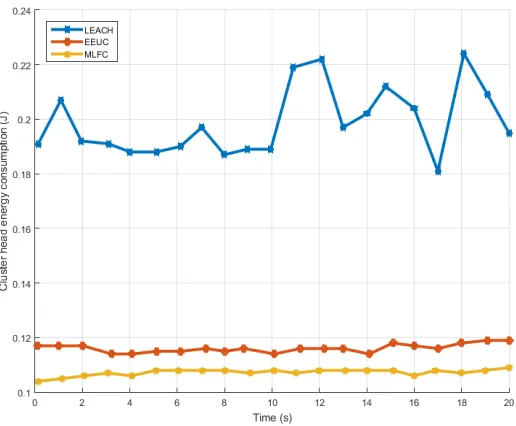
4.3 Energy consumption of cluster head
This section compares the cluster head energy consumption curves obtained by the HCRAFM, the LEACH and the EEUC. The energy consumption in the first 20s is recorded in Figure 8. It can be seen that the energy consumptions calculated by the HCRAFM and the EEUC were smaller and more stable than that obtained by the LEACH. A possible reason lies in the different selection methods of cluster head in these algorithms. The LEACH chooses cluster head randomly by voting, resulting in significant fluctuation in the energy consumption of cluster head. The HCRAFM and the EEUC select cluster head more stably under stricter conditions. Besides, the two algorithms also save more energy than the LEACH, thanks to the adoption of the multi-hop routing. The cluster head energy consumption is further reduced in the HCRAFM due to the integration of the fuzzy mathematics algorithm, which considers the energy and location information of cluster heads. Therefore, the HCRAFM algo-rithm achieved the most balanced energy consumption effect.
Fig. 8. Energy consumption curves of cluster heads with different algorithms
4.4 Network energy consumption
Fig. 9. Network energy consumption curves with different algorithms
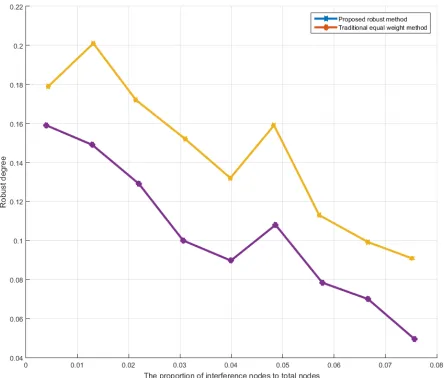
4.5 System robustness analysis
Under the same selective interference, this section analyses the robustness of the network obtained by the HCRAFM and the traditional equal weight method. Accord-ing to the results in Figure 10, the HCRAFM achieved much better network robust-ness than the traditional method with the increase in the number of network interfer-ence nodes, indicating that it is an efficient WSN robustness detection method. This is because the fuzzy mathematics method can accurately analyse the selective interfer-ence factors of the network, and, in turn, detect the exact robustness of the network.
5
Conclusions
This paper puts forward the HCRAFM to reduce the energy consumption and im-prove the robustness of WSN. The proposed algorithm first divides the network into several layers, then selects multiple cluster heads using the fuzzy algorithm based on node energy, density and centrality in each layer. Then, the residual nodes joined the cluster of the nearest cluster head in the same layer, which transmitted data and estab-lished multi-hop routing by themselves. To make a comprehensive analysis of WSN, it is also necessary to detect the robustness of the network. Facing the multiple ran-dom variables, the traditional robustness detection models assume that all nodes have the same weight, making it impossible to quantify the analysis indices or obtain accu-rate results. Thus, the fuzzy mathematics theory was introduced to the WSN robust-ness detection, forming a fuzzy comprehensive evaluation method. The simulation results show that the HCRAFM strikes a load balance between WSN nodes, extends the life cycle of each node, and prolongs the service life of the network. In addition, the proposed algorithm is proved to have sound robustness and strong applicability.
6
Acknowledgment
This work is supported bythe University Natural Science Key Foundation of Anhui (No. KJ2017A453), the University Teaching Research Foundation of Anhui (No. 2016 jyxm0693).
7
References
[1] Han, G., Jiang, J., Shu, L., Niu, J., & Chao, H. C. (2014). "Management and applications of trust in Wireless Sensor Networks: A survey." Journal of Computer and System Scienc-es, 80(3): 602-617. https://doi.org/10.1016/j.jcss.2013.06.014
[2] Shamshirband, S., Amini, A., Anuar, N. B., Kiah, M. L. M., Teh, Y. W., & Furnell. (2014). "D-FICCA: A density-based fuzzy imperialist competitive clustering algorithm for intrusion detection in wireless sensor networks." Measurement, 55: 212-226. https://doi.org/10.1016/j.measurement.2014.04.034
[3] Oda, T., Elmazi, D., Barolli, A., Sakamoto, S., Barolli, L., & Xhafa, F. (2016). "A genetic algorithm-based system for wireless mesh networks: analysis of system data considering different routing protocols and architectures." Soft Computing, 20(7): 2627-2640. https://doi.org/10.1007/s00500-015-1663-z
[4] Guo, W.J., Zhang, W. (2014) "A survey on intelligent routing protocols in wireless sensor networks." Journal of Network and Computer Applications, 38: 185-201. https://doi.org/10.1016/j.jnca.2013.04.001
[5] Hammoudeh, M., and Robert N. (2015). "Adaptive routing in wireless sensor networks: QoS optimisation for enhanced application performance." Information Fusion, 22: 3-15. https://doi.org/10.1016/j.inffus.2013.02.005
[7] Javidi, T., and Eric V.B. (2016). "Opportunistic Routing in Wireless Networks." Founda-tions and Trends® in Networking, 11(1-2): 1-137.
[8] Xiao-Chen, H., Wei-Jing, L., Min-Jie, X., Ning, Y., & Xiao-Yue, R . "Energy balance and robustness adjustable topology control algorithm for wireless sensor networks." Acta Physica Sinica 64.8 (2015).
[9] Ozturk, C., Emrah H., and Dervis K. (2015). "A novel binary artificial bee colony algo-rithm based on genetic operators." Information Sciences, 297: 154-170. https://doi.org/10.1016/j.ins.2014.10.060
[10] Shelke, M., Tefera, G., Malhotra, A., & Mahalle, P. (2016). "Fuzzy-based fault-tolerant low-energy adaptive clustering hierarchy routing protocol for wireless sensor network." In-ternational Journal of Wireless and Mobile Computing, 11(2: 117-123. https://doi.org/10.1504/IJWMC.2016.080183
[11] Gao, T., Song, J.Y., Zou, J.Y., Ding, J.H., Wang, D.Q., & Jin, R.C. (2016). "An overview of performance trade-off mechanisms in routing protocol for green wireless sensor net-works." Wireless Networks, 22(): 135-157.
[12] Ying, L., Qi, H., and Li W.Q. (2013). "Load-balanced clustering algorithm with distributed self-organization for wireless sensor networks." IEEE sensors journal, 13(5): 1498-1506. https://doi.org/10.1109/JSEN.2012.2227704
[13] Alanazi, A., and Khaled E. (2015). "Real-time QoS routing protocols in wireless multime-dia sensor networks: Study and analysis." Sensors, 15(9): 22209-22233. https://doi.org/10.3390/s150922209
[14] Li, P., Yu, X., Xu, H., Qian, J., Dong, L., & Nie, H. (2017). "Research on secure localiza-tion model based on trust valualocaliza-tion in wireless sensor networks." Security and Communi-cation Networks 2017.
[15] Abhishek K., Sharma, R.K., Burnwal, A. (2015). "Energy Consumption Model in Wireless Ad-hoc Networks using Fuzzy Set Theory." Global Journal of Advanced Research, 2(2): 419-426.
[16] Kong, L., Pan, J.S., Sná!el, V., Tsai, P.W., & Sung, T.W. (2017). "An energy-aware rout-ing protocol for wireless sensor network based on genetic algorithm." Telecommunication Systems, 2017: 1-13.
[17] Mary, S.A, Sahaaya, A., and Jasmine, B.G. (2016). "Fuzzy Logic Approach to Zone-Based Stable Cluster Head Election Protocol-Enhanced for Wireless Sensor Networks." KSII Transactions on Internet and Information Systems (TIIS), 10(4): 1692-1711.
[18] Mann, P.S., and Satvir, S. (2017). "Energy-Efficient Hierarchical Routing for Wireless Sensor Networks: A Swarm Intelligence Approach." Wireless Personal Communications, 92.(2): 785-805. https://doi.org/10.1007/s11277-016-3577-1
8
Authors
Ying Xiang received her Bachelor Degree in School of Mathematical Sciences, Nanjing Normal University, Nanjing, China in 2003 and the Master Degree in School of Mathematics, Southeast University, Nanjing, China in 2012. She is a lecturer work-ing in Changzhou Vocational Institute of Mechatronic Technology, Basic Department of Culture, Changzhou 213164, China. She has published 12 papers. Her current re-search interests include mathematics pedagogy and Mathematical statistics.
School of Mathematics, Southeast University, Nanjing, China in 2012. He is a lectur-er working at the School of Applied Mathematics, Chaohu Univlectur-ersity, Chaohu 238000, China.
Xiaohong Zhuang received her Bachelor Degree in School of Mathematical Sci-ences, Soochow University, Suzhou, China in 1986. She is an associate professor working at the Basic Department of Culture, Changzhou Vocational Institute of Mechatronic Technology, Changzhou 213164, China.
Xiaoxing Li received his Bachelor Degree in Automation College, Southeast Uni-versity, Nanjing, China in 2002. He is a Mechanical and electrical manager working in Future Land Holdings Co. Ltd., Shanghai 200000, China.