__________
* Corresponding author
E-mail addresses:[email protected](A.Hadavand);[email protected]
(
M. Saadatseresht);[email protected](S.Homayouni) DOI: 10.22059/eoge.2019.282354.1048
84 ABSTRACT
for any estimated parameters
optimally needs
of remote sensing images Efficient segmentation
segmentation algorithm. These optimal parameters help algorithms avoid both over- and under- segmentation of image data and provide high-quality inputs for further processing.Recently, the super-pixels method has been introduced as a powerful tool to over-segment the images and replace the super-pixels with higher-level inputs. Automatic aggregation of super-pixels with image segments is a challenge in the remote sensing and computer programming community. In this paper, a new automated segmentation method, namely density-based super-pixel aggregation (DBSPA), is proposed. This method is based on the spatial clustering algorithm for integrating the obtained super-pixels from the Simple Linear Iterative Clustering (SLIC). The DBSPA algorithm uses a Normalized Difference Vegetation Index (NDVI) and a normalized Digital Surface Model (nDSM) to form core segments and defines the primary structure of geographic features in an image scene. Then, the box-whisker plot was used to analyze the statistical similarity of super-pixels to each core-segment, and spatially cluster all super-pixels. In our experiments, two ultra-high-resolution datasets selected from ISPRS semantic labelling challenge were used. As for the Vaihingen dataset, the overall accuracy was 83.7%, 84.8%, and 89.6% for pixel-based, object-based, and the proposed method respectively. The values for the Potsdam dataset are 85.2%, 85.6%, and 86.4%. The evaluation of results revealed an overall accuracy improvement in Random Forest classification results, while the number of image objects reduced by about 4%.
S
KEYWORDS
Image Segmentation Super-Pixel
Density-Based Spatial Clustering
Ultra-High-Resolution
Image Classification
1. Introduction
Producing optimal image segments or decomposing an image into homogeneous regions is a critical and challenging task in most remote sensing applications. This process, namely image segmentation, is a significant step in geographic object-based image analysis (GEOBIA) of remote sensing data (Aplin, 2014). In GEOBIA, the image segments are considered as processing units. Accordingly, their quality directly affects further processing of different object recognition such as building (Belgiu and Drǎguţ,
2014), roads (Maboudi et al., 2018), land cover (Antonarakis
et al., 2008), and land use mapping (Gholoobi et al., 2010).
Each image segment must include similar pixels with
minimumsimilarity toneighboringsegments(Pal and Pal, 1993). Several image segmentation techniques have been introduced in the literature, including thresholding techniques, edge-based methods, region-based methods, and hybrid methods which are the combination of different techniques(Shih and Cheng, 2005).
One of the most critical and essential parameters in the
segmentation process is the scale parameter (Liu et al., 2017). The scale parameter is directly related to the size of image segments. In urban areas, there are features with different sizes such as buildings and trees whose sizes are entirely different from those of roads and pavements. An optimized scale parameter should prevent merging various
w e b s i t e : h t t p s : / / e o g e . u t . a c . i r
A novel density-based super-pixel aggregation for automatic segmentation
of remote sensing images in urban areas
Ahmad Hadavand1*, Mohammad Saadatseresht1, Saeid Homayouni2
1 School of Surveying and Geospatial Information Engineering, College of Engineering, University of Tehran, Tehran, Iran 2 Centre Eau Terre Environnement, Institut National de la Recherche Scientifique, Quebec, Canada
Article history:
85 geographic features into a segment, e.g.,
under-segmentation, and also dividing a feature into several image segments, e.g., over-segmentation, (Rao and Dempster, 2002). While estimating a single scale parameter for the whole image scene has been the goal of several types of research, the high variation of geographic features size and high diversity of their spectral properties prevent obtaining the best possible results, and consequently, over- or under-segmentation are inevitable.
Recently, a new strategy has been developed to optimally segment an image by adding an intermediate layer between image pixels and segments, namely super-pixels (Achanta et
al., 2012). Super-pixels are a small group of pixels sharing
common properties in the local vicinity. Super-pixels are potent means to deal with local variations in gray values and contextual image information. As a result, their borders are in good coincidence with edges of geographic features in the image scene (Hadavand et al., 2017b).
The super-pixels layer may be considered as a higher-level input, rather than merely pixels, in different algorithms, e.g., multi-resolution image segmentation (Csillik, 2017). However, grouping the pixels into super-pixels impressively reduces the complexity and computational cost of further processing and are rarely investigated by researchers. In remote sensing applications, super-pixels are used to reduce the effect of noises compared to pixel-level processing of optical (Guangyun Zhang et al., 2015) and RADAR (Qin et
al., 2015) image data.
To the best of our knowledge, super-pixels have been rarely used in GEOBIA. This is mostly because super-pixels do not possess the properties of image objects as required in GEOBIA. In order to solve such a gap between super-pixels and image objects, super-pixels should be merged. Merging super-pixels necessitates careful defining of several criteria and tune-required parameters. The proposed algorithm in this paper generates image objects using super-pixels. A novel spatial clustering methodology is proposed for merging super-pixels. The parameters used in the algorithm were mostly tuned adaptively through statistical analysis of values prepared in the dataset.
In this paper, in order to investigate the potential of super-pixels in the segmentation of ultra-high resolution (UHR) imagery, an automated method was proposed to integrate super-pixels and to automatically segment the images merely. The method, which is named density-based super-pixel aggregation (DBSPA), uses statistical analysis of normalized difference vegetation index (NDVI) and normalized digital surface model (nDSM) values, as well as spatial clustering paradigm to merge super-pixels and generate ideal image objects.
In the DBSPA method, the simple linear iterative clustering (SLIC) algorithm was selected to generate super-pixels. SLIC is known for its performance and simplicity
(Achanta et al., 2012). Then, a novel algorithm inspired by
density-based spatial clustering of application with noise (DBSCAN) was developed and implemented to integrate super-pixels. To avoid tuning parameters, all parameters were adaptively selected based on statistical analysis of data using the box-whisker plot and Otsu’s thresholding. Finally, the results were evaluated using an unsupervised image segmentation evaluation criterion and also based on its accuracy in creating an object-based land cover map.
2. Density-based super-pixel aggregation
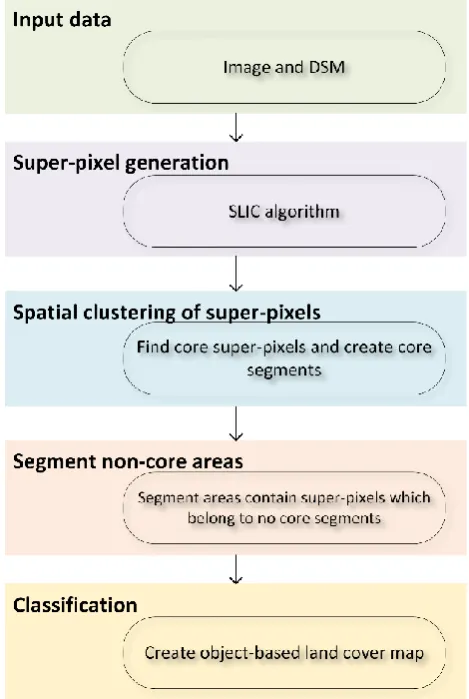
Figure 1 presents the DBSPA methodology, which consists of four main steps. These steps are including super-pixel generation, spatial clustering of super-pixels, segmenting non-core areas, and classification. Each of the steps will be discussed in details in the following sections.
Figure 1. Flowchart of the DBSPA method Super-pixel generation
The first step is to create super-pixels using the SLIC algorithm. SLIC is a well-known algorithm whose performance has been proven in different research areas
(Achanta et al., 2012; Hadavand et al., 2017b; Kavzoglu and
86 to the k-means clustering algorithm with some
modifications. In the k-means algorithm, each pixel is compared to all cluster centers in the dataset, while in SLIC, merely, a local window around the pixels is considered to calculate the similarity. In other words, a combination of
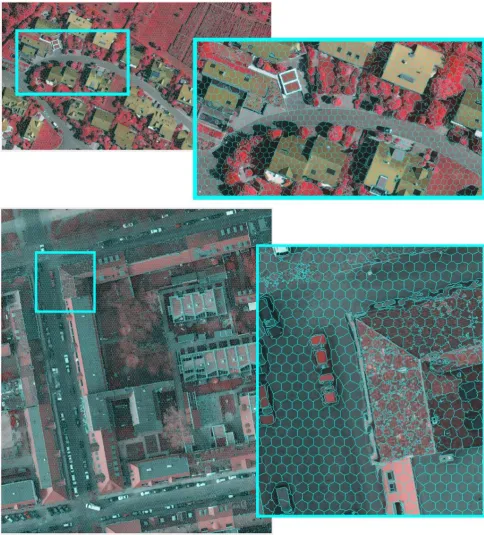
spatial and spectral distance is used to compute the similarity between each pixel and super-pixel center. The result of this step is an over-segmentation of the image, as presented in Figure 2.
Spatial clustering of super-pixels
The DBSPA method is inspired by the DBSCAN algorithm
(Ester et al., 1996). The DBSCAN algorithm was initially
developed for datasets with spatial distribution in
87 reachable, and those in an ϵ-distance from density reachable
points are called connected density points. Disconnected points considered as outliers or noises and the core points, together with density reachable and connected density points construct the clusters.
In this paper, we presented a modification to the DBSCAN algorithm to deal with super-pixels with two-dimensional distributions in the image space. The first difference between the two methods is the definition of core super-pixels. In order to find core super-pixels, we used both NDVI and nDSM information. Otsu’s thresholding (Otsu, 1979) was used to convert super-pixels into four classes, including vegetated, non-vegetated, elevated and non-elevated (Hadavand et al., 2017a). Consequently, each super-pixel gets two labels that define its elevation and vegetation situation. For each super-pixel, if all of itsneighborsare in the same situation with the central super-pixel, it is labelled as a core super-pixel. Connected core super-pixels form core image segments. Due to the variations in gray values and heights in the image, the core image segments fail to reach the borders of the terrestrial image object. Therefore, a loop was designed to find and merge density reachable super-pixels into the proper core segment. In this loop, the non-core super-pixels that have a mutual border with each core-segment were then selected.
Afterwards, the box-whisker plot(Tukey, 1977)was used to make the decision whether a non-core super-pixel is a density connected super-pixel and could be merged into the current core-segment. This decision is ultimately made based on statistical analysis of nDSM, NDVI, and gray values image. Box-whisker plot is an efficient outlier detection method used in statistical analysis of different types of data. The structure of the plot is shown inFigure. This method works based on data quartiles. The low, median, and lower quartiles of data, divide it into four equal groups. The distance between the lower and upper quartiles are called the interquartile range (IQR). The interval between Q1-1.5×IQR andQ3+1.5×IQR is called an inner fence, and the interval between Q1-3×IQR and Q3+3×IQR is called an outer fence. In this method, the data out of the inner fence are known as mild outliers, and the data out of the outer fence are known as extreme outliers. Inorder to determinewhetherthe super-pixel is similar to the core-segment, we compared each non-core super-pixel and non-core-segment based on gray values and nDSM.
Figure 3.An overview of the box-whisker plot(Chunsen Zhang et al., 2018)
Segmenting non-core areas
Next, the main structure of geographic features in the image scene is segmented without setting any parameters. However, some heterogeneous parts remain un-segmented. In the next step, these parts are separated from the core-segments and in each local area, un-segmented super-pixels are merged as a group of super-pixels. In order to deal with the heterogeneity in a group, the Otsu’s thresholding was employed, and the super-pixels were segmented based on vegetation and height classification. Then, the small segments with the area of a single super-pixel were selected, and based on their NDVI and nDSM contrast toneighboring segments, they remain individual or are merged by other segments.
Classification
In the final step, the land cover map is produced usingthe random forest classifier(Breiman, 2001).
3. Experiments
3.1. Remote sensing data
The proposed method was applied to two datasets,
captured over urban districts in Vaihingen, and Potsdam, provided by the International Society for Photogrammetry and Remote Sensing (ISPRS). This data includes near-infrared (NIR), red (R) and green (G) spectral bands, and DSM generated through dense stereo image matching. The nDSM is generated using a morphological reconstruction method described in(Arefi and Hahn, 2005).
88 Figure 4. Image and DSM data used in the experiments
3.2. Results
The SLIC algorithm with hexagonal super-pixels with an area of one square meter was employed in the first step to generate the super-pixels. The size of super -pixel is selected based on our previous experiments (Hadavand et al., 2017b), and it fulfils the detection of all objects in urban areas. Then, the super-pixels were merged based on the DBSCAN
were iteratively core segments
this end, To
algorithm.
generated, and then the neighboring super -pixels with spectral and nDSM values within inner fence obtained from statistical analysis of pixel values of the core segment, were merged to grow the core segments. Then, the NDVI and nDSM values of the un-segmented super-pixels were statistically analyzed to segment the remained areas. Finally, the small segments with the area less than one square meter were merged with the most similar neighboring segments. Figure 5 shows an overview of the core segments, the result of spatial clustering to grow core segments, and the ultimate segments created by the DBSPA algorithm in each dataset.
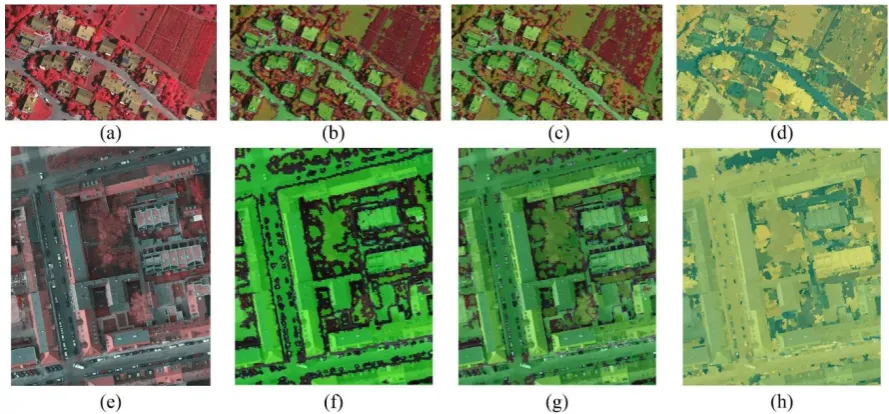
Figure 5. Core segments, the result of DBSCAN on core segments and the final segmentation result for Vaihingen (a-c) and Potsdam (e-g) dataset
Visual inspection of the results shows the ability of the proposed method to detect the main structure of geographic features in an image scene (Figures 5a and 5e). Also, after running the proposed DBSCAN algorithm on the core segments, most of the image areas are segmented. At the end of this step, unsegmented parts of images include geographic features with high gray values and height difference with core segments in a local neighborhood. These areas, which contain less proportion of image area, are segmented by taking the NDVI and nDSM values into account. The final segmentation result also looks to coincide well with the borders of geographic features.
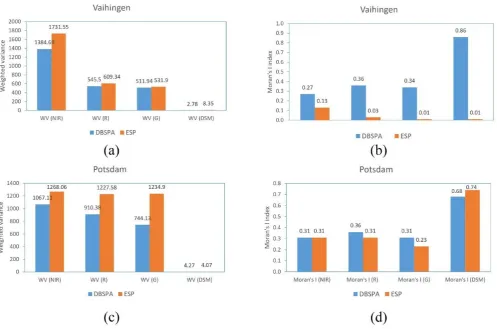
Unsupervised evaluation measures were used to demonstrate the quality of the proposed method. Figure 6 shows the result
89 Figure 6. Comparing WV and Moran’s I index for both datasets
The number of segments is an essential and straightforward criterion in the evaluation of results. The ideal number of image segments is the smallest number of segments that avoid under-segmentation or the most significant number that prevents over-segmentation. In the final step of the proposed method, the image objects are evaluated based on their ability to generate land cover maps. The Random Forest classifier was trained using 5000 samples in each class, and the results of assessing the land cover map obtained for different segmentation methods are evaluated based on the overall accuracy and the kappa coefficient. The number of segments and results of a classification in pixel level, ESP objects, and objects created by the proposed method is presented in Table 1. In Vaihingen dataset, the OA improved from %84.8 to %89.6, and for Potsdam dataset, from %85.6 to %86.4. These improvements were achieved concurrently with decreasing the number of image segments. As the results showed, the number of image segments have been decreased by %4 for both datasets.
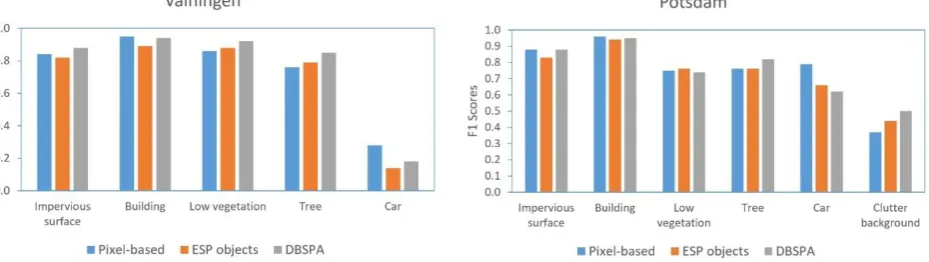
Finally, using the F1 score, the classification results were evaluated for each class. The results are shown in Figure 7. The F1 score is the harmonic mean of precision and recall
(Sasaki, 2007). This measure varies between 0 and 1, where
higher values mean better classification results. The
evaluation results using the F1 score shows the superiority of the DBSPA method to detect trees much better compared to other classes. Trees are complex features with respect to height information and spectral variations.
Table 1. Comparing the number of segments and the accuracy of land cover mapping
Potsdam dataset Vaihingen dataset
k OA (%) # of
segmen ts k OA (%) # of segm ents
0.8 0 85.2 -
0.77 83.7 -
Pixel-based
0.8 85.6 842
0.78 84.8 992
ESP objects
0.8 1 86.4 806
0.85 89.6 954
DBSPA
Moreover, the objects generated by the DBSPA led in more successful detection of clutter/background class in Potsdam dataset. The information in this class seems to be mixed with other classes. Consequently, ESP’s objects or pixels might be misclassified.
90 shadows and low contrast of cars and road asphalt. There is
a straightforward connection between spatial resolution and car detection capability. The F1 score of this class was
increased significantly for Potsdam dataset with 5 cm GSD, compared to Vaihingen dataset with 9 cm GSD.
Figure 7. Results of per-class accuracy assessment
4. Discussion
The need for higher-level image information is increasing due to the rapid development and application of image data. Compared to pixels, super-pixels provide more information, but the result is over-segmented, and the image objects are not fully detected. In this paper, an automatic algorithm was proposed to integrate the super-pixels and create image segments for GEOBIA applications.
statistically The method segmented an image by
integrating the SLIC super-pixels. Spatial clustering paradigm is the processing core of the proposed method. Moreover, the parameters were statistically adapted from the dataset itself to decide on forming spatial clusters and their integration.
The results of two UHR imagery shows visually satisfying results. As the super-pixel algorithms search locally for similar pixels, the result matches the local borders of objects in the image scene. The quantitive evaluations also represent the success of the method in generating homogenous image objects. Also, the quality of the land-cover map shows the superiority of the proposed method for finding land cover patches in the study area. Referring to Table 1, in Vaihingen dataset, the OA improved from %84.8 to %89.6, and for Potsdam dataset, from %85.6 to %86.4. It seems that the success of the proposed method in creating a higher quality land cover map is mainly due to the power of super-pixels in detecting the borders of different objects.
One notable achievement of the proposed method is reducing the number of objects compared to the ESP method. The lower number of objects and maintaining accuracy means that the method is capable of avoiding over-segmentation. This is very important when a high volume of image data and a lower number of objects are processed, which consequently reduce the memory requirements and processing costs.
5. Conclusion
Applications of super-pixels are increasing in remote
sensing and computer programming community. The proposed method introduced a new strategy simplifying the use of super-pixels in GEOBIA. The results of the proposed method on two ultra-high-resolution urban remote sensing datasets demonstrated the relative superiority of the proposed method. Unsupervised segmentation evaluation and classification accuracy measures were used to evaluate the efficiency of the method.
The experiments revealed the quality of image segments from both the intra- and inter-segment heterogeneity point of view. Besides, the use of image objects provided by the proposed method resulted in a more accurate land cover map. Furthermore, using a lower number of image objects could reduce the processing time and cost. In order to improve the proposed method and move toward optimal image segmentation approaches and more advanced image features, the relational features of classes should be also considered in the future works.
Acknowledgment
workgroup III/4 and ISPRS
Special thanks to the
datasets valuable
these making for
Gerke Dr. Markus available. References
Achanta, R., Shaji, A., Smith, K., Lucchi, A., Fua, P., & Susstrunk, S. (2012). SLIC superpixels compared to state-of-the-art superpixel methods. Pattern Analysis and Machine Intelligence, IEEE Transactions on, 34(11), 2274-2282.
Antonarakis, A., Richards, K. S., & Brasington, J. (2008). Object-based land cover classification using airborne LiDAR. Remote Sensing of Environment, 112(6), 2988-2998.
Aplin, P. 24 (2014) 'GEOBIA state of the art, science or technology' Proceedings of the 5th International GEOBIA Conference, Thessaloniki, Greece.
91 Sensi
Archives of Photogrammetry, Remote ng and Spatial Information Sciences, 36(3/W19).
Belgiu, M., & Drǎguţ, L. (2014). Comparing supervised and unsupervised multiresolution segmentation approaches for extracting buildings from very high resolution imagery. ISPRS Journal of Photogrammetry and Remote Sensing, 96, 67-75.
forests.
Breiman, L. (2001). Random Machine learning, 45(1), 5-32.
Csillik, O. (2017). Fast segmentation and classification of very high resolution remote sensing data using SLIC superpixels. Remote Sensing, 9(3), 243.
Drǎguţ, L., Tiede, D., & Levick, S. R. (2010). ESP: a tool to estimate scale parameter for multiresolution image segmentation of remotely sensed data. International Journal of Geographical Information Science, 24(6), 859-871.
Ester, M., Kriegel, H.-P., Sander, J., & Xu, X. 96 (1996) 'A density-based algorithm for discovering clusters in large spatial databases with noise' Kdd. pp. 226-231 34. Gholoobi, M., Tayyebib, A., Taleyi, M., & Tayyebi, A.
(2010) 'Comparing pixel based and object based approaches in land use classification in mountainous areas' Proceeding of the ISPRS Commission VIII Mid-Term Symposium “Networking the World with Remote Sensing”. Kyoto (Japan). pp. 9-12.
Hadavand, A., Saadatseresht, M., & Homayouni, S. (2017a). Segmentation parameter selection for object-based land-cover mapping from ultra high resolution spectral and elevation data. International Journal of Remote Sensing,
38(12), 3586-3607.
doi:10.1080/01431161.2017.1302107.
Hadavand, A., Saadatseresht, M., Homayouni, S., & Gharib Bafghi, Z. (2017b). Evaluation of SLIC superpixel and DBSCAN clustering algorithms in segmentation of ultra-high resolution remote sensing imagery over urban areas (Research). Journal of Geospatial Information Technology, 5(1), 89-109. doi:10.29252/jgit.5.1.89. Kavzoglu, T., & Tonbul, H. (2018). An experimental
comparison of multi-resolution segmentation, SLIC and K-means clustering for object-based classification of VHR imagery. International Journal of Remote Sensing, 1-17. doi:10.1080/01431161.2018.1506592.
Liu, J., Du, M., & Mao, Z. (2017). Scale computation on high spatial resolution remotely sensed imagery multi-scale segmentation. International Journal of Remote Sensing, 38(18), 5186-5214.
Maboudi, M., Amini, J., Malihi, S., & Hahn, M. (2018). Integrating fuzzy object based image analysis and ant colony optimization for road extraction from remotely sensed images. ISPRS Journal of Photogrammetry and Remote Sensing, 138, 151-163.
Otsu, N. (1979). A threshold selection method from gray-level histograms. IEEE transactions on systems, man, and cybernetics, 9(1), 62-66.
image review on A
(1993). Pal, N. R., & Pal, S. K.
techniques.
segmentation Pattern recognition, 26(9), 1277-1294.
Qin, F., Guo, J., & Lang, F. (2015). Superpixel segmentation for polarimetric SAR imagery using local iterative
clustering. IEEE Geoscience and Remote Sensing Letters, 12(1), 13-17.
Rao, K. M., & Dempster, A. (2002) 'Modification on distance transform to avoid over-segmentation and under-segmentation' Video/Image Processing and Multimedia Communications 4th EURASIP-IEEE Region 8 International Symposium on VIPromCom. IEEE, pp. 295-301.
Sasaki, Y. (2007). The truth of the F-measure. Teach Tutor mater, 1(5), 1-5.
Shih, F. Y., & Cheng, S. (2005). Automatic seeded region growing for color image segmentation. Image and vision computing, 23(10), 877-886.
Tukey, J. W. (1977). Exploratory data analysis. Reading, Mass.
Zhang, C., Li, G., & Cui, W. (2018). High-Resolution Remote Sensing Image Change Detection by Statistical-Object-Based Method. IEEE Journal of Selected Topics in Applied Earth Observations and Remote Sensing. Zhang, G., Jia, X., & Hu, J. (2015). Superpixel-Based
Graphical Model for Remote Sensing Image Mapping. Geoscience and Remote Sensing, IEEE Transactions on, 53(11), 5861-5871.