systems
Article
A Multi-Methodology Approach to Creating a Causal
Loop Diagram
NiNa Dhirasasna1,* and Oz Sahin2,3
1 Griffith Institute for Tourism, Griffith University, Gold Coast Campus 4222, Australia
2 School of Engineering and Built Environment, Griffith University, Gold Coast Campus 4222, Australia 3 Griffith Climate Change Response Program, Griffith University, Gold Coast Campus 4222, Australia * Correspondence: [email protected]; Tel.:+614-04747678
Received: 7 May 2019; Accepted: 15 August 2019; Published: 16 August 2019
Abstract:Developing causal loop diagrams (CLDs) involves identifying stakeholders and endogenous variables and formulating variable causal relationships. Traditionally, the CLDs are developed mainly using a qualitative approach such as literature review, observations and interviews with stakeholders. However, modellers may question which stakeholders should be approached, whether the relevant variables are selected, and what to do when stakeholders perceive different variable relationships in the CLDs differently. Applying in a case study, this research proposes a multi-method approach by combining both quantitative and qualitative methods to select stakeholders, identify endogenous/exogenous variables, and develop the CLDs. The proposed quantitative method is expected to provide modellers with a justifiable stakeholder and variable selection process. The method also highlights possible hidden variables and relationships, which were further explored with a traditional qualitative approach.
Keywords: causal loop diagram; multi-methodology approach; structural analysis
1. Introduction
The systems thinking approach is a research lens that follows a holistic worldview and non-linear system behaviour over time [1]. Using this method, researchers can demonstrate system connectivity through modelling, and illustrate system behaviours of different scenarios [1–3]. The modelling process includes turning a qualitative conceptual model into a final quantitative simulation [4,5]. Experts and stakeholders are crucial to illuminating variable relationships in the system under investigation [6]. This research focuses on developing a qualitative conceptual model using causal loop diagrams (CLDs). CLDs map the hypotheses of system structures by linking causal relationships between variables [2]. The easy-to-view CLDs help to engage stakeholders during the modelling process and facilitate their mind maps [7]. CLDs are not the final simulation and are not a mandatory part of the system dynamics modelling process [8]. However, the CLDs allow a smoother transition to the final quantitative stock-and-flow diagrams used in simulation [9].
Developing the CLDs involves identifying stakeholders and endogenous variables, and formulating variable causal relationships [2]. Modellers collect, refine and revalidate data multiple times using a mainly qualitative approach including literature reviews, observations, interviews, and consultations with stakeholders [6]. These traditional CLDs developed with stakeholders [8] limit researchers to the qualitative approach. This research contends that the paradigm is a world view [10] which, by default, can illuminate certain phenomena while concealing other paradigms [11]. Thus, combining the qualitative and quantitative approaches will complement different system aspects and deepen the modellers’ understanding and interpretation [12]. This research adopts the
multimethodological approach for a systems modelling, which favours more than one methodology from different paradigms to examine an intervention more effectively [13–17].
We recommend integrating quantitative methods including stakeholder identification, a systematic quantitative literature review, and a structural-analysis MICMAC (Impact Matrix Cross-Reference Multiplication Applied to a Classification), with qualitative methods including the modeller’s judgement or revalidation with stakeholders. This research contributes to the multi-methodology approach from different paradigms in complex settings [18]. The next section reviews the CLDs developing process and limitations. Section3presents the proposed multi-methodology. Section4
applies the methods to a case study and compares the result with relationships obtained from the literature. Section5concludes and suggests further work.
2. CLDs Developing Process
Developing the CLDs incorporates two steps: Problem articulation and formulation of dynamic hypothesis [2].
2.1. Step 1: Problem Articulation
Step 1: In problem articulation, modellers identify research problems and key variables or concepts [2]. Problem articulation is also called ‘conceptualisation’ [19], and ‘problem identification and definition’ [20]. Common practices to articulate problems are client interview, stakeholder engagement and data collection [2,8]. This section focuses on traditional stakeholder and variable identification, and its limitations.
First, stakeholders are human entities, as individuals, groups or organisations; non-human entities include the environment; and mental constructs such as the respect for the past generation and the future generation’s well-being [21–23]. In the system modelling process, stakeholders provide knowledge, develop the actual model, interpret the results, and/or create the alternate policies [24–26]. Modellers can involve a group of stakeholders to build a conceptual model [27], joint individual stakeholder’s models [28], or record stakeholder interactions in a simulation [26]. The review of stakeholder participation in the modelling process can be found in [26,29,30].
This research argues that despite a vast literature on stakeholder and modelling processes, the fundamental questions of ‘who’s in’ and ‘why’ are not explicit and remain a difficult issue in the
systems’ thinking literature [26]. Modellers often select stakeholders on an ad hoc basis, simply because they hold a ‘stake’ in research problems or ignore them all together [22,31,32]. Unclear and unjustifiable stakeholder lists may hinder result acceptance, model boundary, and system perception [33,34].
This research does not argue why stakeholders are important, because the reasons vary according to a modeller’s stakeholder theories. Examples of stakeholder theories are: Perceiving stakeholders as an instrument to understand phenomenon versus as a ‘right thing to include them’ [35]; judging which stakeholders are more important versus avoiding this altogether; or focusing on the organisation’s interests versus engaging stakeholders [36]. This research simply calls for articulating which stakeholders are omitted. Thus, this research suggests a structured stakeholder identification method to illuminate who’s in and who’s omitted at Step 1: Problem articulation.
Following creating a stakeholder list, modellers identify relevant variables to serve as a model boundary [2]. Compiling variables reflects a modeller’s two epistemologies, both have their own limitations. Should modellers assume an objective epistemology that human knowledge reflects the reality, then the modellers’ knowledge is sufficient and does not involve stakeholders [32]. However, modellers with the objective epistemology may sweep-in many variables and create a large model to reflect reality rather than the problem [34,37]. On the other hand, should modellers assume a subjective epistemology that humans construct the realities, then modellers would appreciate different perspectives and engage stakeholders [32].
Systems2019,7, 42 3 of 36
However, extracting variables from stakeholders depends on the success of the stakeholder engagement. A structured group model building (GBM) facilitator is instructed to ask stakeholders, “What are the key variables affecting the process and outcomes of the (project name) project?”, and write on the whiteboard [38]. Yet two GBM case studies found that eliciting variables are subject to the stakeholder’s organisation’s culture, stakeholder personalities, and the problem dynamics [39]. This research suggests integrating a systematic quantitative literature review to quantify and justify a variable list. The list can be expanded when engaging stakeholders.
2.2. Step 2: Formulating a Dynamic Hypothesis
Step 2: Formulating a dynamic hypothesis aims to explain the problem dynamics [2]. Formulating a dynamic hypothesis is referred to as ‘conceptualisation’ in [19], and ‘system conceptualisation’ in [20]. Developing a dynamic hypothesis process includes: (1) Identifying endogenous variables, and (2) mapping system structures using CLD [2]. This section focuses on the limitations of variable classifications such as endogenous/exogenous, and the CLD developing process.
First, modellers and/or stakeholders must identify variables into endogenous (arising from within) and exogenous variables (beyond the system) [2]. Exogenous variables are important considerations to understanding a system, however, do not have important feedback compared to endogenous variables. Otherwise, they should be considered as endogenous variables and the model boundary must be expanded [2]. Incorrectly identified endogenous variables will result in narrow boundaries and a limited ability to propose solutions [40,41]. Despite the importance of variable classifications, how variables are classified as endogenous or exogenous is unclear and depends on the stakeholders’ and modellers’ interpretations. This leads us back to ‘who’-the-stakeholders-are argument. Furthermore, the endo/exogenous variable classifications are binomial and lead a modeller to focus on what lies within the model. The endo/exogenous classification does not discriminate the different degrees of variability that may arise within or beyond the model boundary. Such a classification could portray the importance or otherwise of variables in the decision-making process, and their opportunity to manipulate the system. However, our world is entangled with overlapped or embedded systems. Therefore, modellers must look inside, between and outside the system boundary [32].
After identifying endogenous variables, modellers map the system structure to communicate the model boundary and causal relationships between variables [2]. Mapping tools are model boundary diagrams, subsystem diagrams, CLDs, stock-and-flow maps, and policy structure diagrams, some of which have not been adopted in recent literature [2]. This research focuses on CLDs. The CLDs comprise variables connected with arrows representing causal relationships. Each arrow is assigned with ‘+’ or ‘s’ for a relationship that moves in the same direction (i.e., if A increases, then B increases and vice versa); with ‘-’or ‘o’ for the opposite direction (i.e., if A increases, then B decreases and vice versa); and with ‘//’ for the delay impact [2]. If the relationships can be traced back to the starting variable and form a feedback loop, then the loop is called either a reinforcing loop (for a loop that causes exponential growth/decay, denoted with ‘R’) or a balancing loop (for a loop that stabilises behaviour over time, denoted with ‘B’) [2]. The R and B denotations appear in a 1.pdf 1.pdf
Systems 2019, 7, 42 3 of 36
engagement. A structured group model building (GBM) facilitator is instructed to ask stakeholders,
“What are the key variables affecting the process and outcomes of the (project name) project?”, and
write on the whiteboard [38]. Yet two GBM case studies found that eliciting variables are subject to
the stakeholder’s organisation’s culture, stakeholder personalities, and the problem dynamics [39].
This research suggests integrating a systematic quantitative literature review to quantify and justify
a variable list. The list can be expanded when engaging stakeholders.
2.2. Step 2: Formulating a Dynamic Hypothesis
Step 2: Formulating a dynamic hypothesis aims to explain the problem dynamics [2].
Formulating a dynamic hypothesis is referred to as ‘conceptualisation’ in [19], and ‘system
conceptualisation’ in [20]. Developing a dynamic hypothesis process includes: (1) Identifying
endogenous variables, and (2) mapping system structures using CLD [2]. This section focuses on the
limitations of variable classifications such as endogenous/exogenous, and the CLD developing
process.
First, modellers and/or stakeholders must identify variables into endogenous (arising from
within) and exogenous variables (beyond the system) [2]. Exogenous variables are important
considerations to understanding a system, however, do not have important feedback compared to
endogenous variables. Otherwise, they should be considered as endogenous variables and the model
boundary must be expanded [2]. Incorrectly identified endogenous variables will result in narrow
boundaries and a limited ability to propose solutions [40,41]. Despite the importance of variable
classifications, how variables are classified as endogenous or exogenous is unclear and depends on
the stakeholders’ and modellers’ interpretations. This leads us back to ‘
who
’-the-stakeholders-are
argument. Furthermore, the endo/exogenous variable classifications are binomial and lead a
modeller to focus on what lies within the model. The endo/exogenous classification does not
discriminate the different degrees of variability that may arise within or beyond the model boundary.
Such a classification could portray the importance or otherwise of variables in the decision-making
process, and their opportunity to manipulate the system. However, our world is entangled with
overlapped or embedded systems. Therefore, modellers must look inside, between and outside the
system boundary [32].
After identifying endogenous variables, modellers map the system structure to communicate
the model boundary and causal relationships between variables [2]. Mapping tools are model
boundary diagrams, subsystem diagrams, CLDs, stock-and-flow maps, and policy structure
diagrams, some of which have not been adopted in recent literature [2]. This research focuses on
CLDs. The CLDs comprise variables connected with arrows representing causal relationships. Each
arrow is assigned with ‘
+
’ or ‘
s
’ for a relationship that moves in the same direction (i.e., if A increases,
then B increases and vice versa); with ‘
-
‘or ‘
o
’ for the opposite direction (i.e., if A increases, then B
decreases and vice versa); and with ‘//’ for the delay impact [2]. If the relationships can be traced back
to the starting variable and form a feedback loop, then the loop is called either a reinforcing loop (for
a loop that causes exponential growth/decay, denoted with ‘R’) or a balancing loop (for a loop that
stabilises behaviour over time, denoted with ‘B’) [2]. The R and B denotations appear in a
for
loops that read anti-clockwise, and in
for loops that read clockwise.
Modellers develop, refine, and revalidate CLDs several times through literature review,
observation, interview, questionnaire and consultation [2]. This research argues that the CLDs
development process and its visualisation has some limitations. For example, the CLDs’ drawing
process relies on existing literature or on qualitative stakeholders/experts knowledge [2], posing
challenges on emerging research topics. Some literature may explore heavily using a linear approach,
or lightly, if at all, on emerging topics. Thus, solely relying on the literature may not equip modellers
with the knowledge to interview stakeholders [42]. Another example is that the CLDs’ drawing
process does not describe how to manage different stakeholders’ perceived causal relationships [43].
As systems thinking contends that “everything is connected to everything else” [44], all variables in
CLDs could be inter-related with arrows should all the stakeholders’ opinions be considered. In
addition, a consensus among stakeholders about variable relationships may reflect invisible conflict
for loops that read anti-clockwise, and in 2.pdf 2.pdf
Systems 2019, 7, 42 3 of 36
engagement. A structured group model building (GBM) facilitator is instructed to ask stakeholders,
“What are the key variables affecting the process and outcomes of the (project name) project?”, and
write on the whiteboard [38]. Yet two GBM case studies found that eliciting variables are subject to
the stakeholder’s organisation’s culture, stakeholder personalities, and the problem dynamics [39].
This research suggests integrating a systematic quantitative literature review to quantify and justify
a variable list. The list can be expanded when engaging stakeholders.
2.2. Step 2: Formulating a Dynamic Hypothesis
Step 2: Formulating a dynamic hypothesis aims to explain the problem dynamics [2].
Formulating a dynamic hypothesis is referred to as ‘conceptualisation’ in [19], and ‘system
conceptualisation’ in [20]. Developing a dynamic hypothesis process includes: (1) Identifying
endogenous variables, and (2) mapping system structures using CLD [2]. This section focuses on the
limitations of variable classifications such as endogenous/exogenous, and the CLD developing
process.
First, modellers and/or stakeholders must identify variables into endogenous (arising from
within) and exogenous variables (beyond the system) [2]. Exogenous variables are important
considerations to understanding a system, however, do not have important feedback compared to
endogenous variables. Otherwise, they should be considered as endogenous variables and the model
boundary must be expanded [2]. Incorrectly identified endogenous variables will result in narrow
boundaries and a limited ability to propose solutions [40,41]. Despite the importance of variable
classifications, how variables are classified as endogenous or exogenous is unclear and depends on
the stakeholders’ and modellers’ interpretations. This leads us back to ‘
who
’-the-stakeholders-are
argument. Furthermore, the endo/exogenous variable classifications are binomial and lead a
modeller to focus on what lies within the model. The endo/exogenous classification does not
discriminate the different degrees of variability that may arise within or beyond the model boundary.
Such a classification could portray the importance or otherwise of variables in the decision-making
process, and their opportunity to manipulate the system. However, our world is entangled with
overlapped or embedded systems. Therefore, modellers must look inside, between and outside the
system boundary [32].
After identifying endogenous variables, modellers map the system structure to communicate
the model boundary and causal relationships between variables [2]. Mapping tools are model
boundary diagrams, subsystem diagrams, CLDs, stock-and-flow maps, and policy structure
diagrams, some of which have not been adopted in recent literature [2]. This research focuses on
CLDs. The CLDs comprise variables connected with arrows representing causal relationships. Each
arrow is assigned with ‘
+
’ or ‘
s
’ for a relationship that moves in the same direction (i.e., if A increases,
then B increases and vice versa); with ‘
-
‘or ‘
o
’ for the opposite direction (i.e., if A increases, then B
decreases and vice versa); and with ‘//’ for the delay impact [2]. If the relationships can be traced back
to the starting variable and form a feedback loop, then the loop is called either a reinforcing loop (for
a loop that causes exponential growth/decay, denoted with ‘R’) or a balancing loop (for a loop that
stabilises behaviour over time, denoted with ‘B’) [2]. The R and B denotations appear in a
for
loops that read anti-clockwise, and in
for loops that read clockwise.
Modellers develop, refine, and revalidate CLDs several times through literature review,
observation, interview, questionnaire and consultation [2]. This research argues that the CLDs
development process and its visualisation has some limitations. For example, the CLDs’ drawing
process relies on existing literature or on qualitative stakeholders/experts knowledge [2], posing
challenges on emerging research topics. Some literature may explore heavily using a linear approach,
or lightly, if at all, on emerging topics. Thus, solely relying on the literature may not equip modellers
with the knowledge to interview stakeholders [42]. Another example is that the CLDs’ drawing
process does not describe how to manage different stakeholders’ perceived causal relationships [43].
As systems thinking contends that “everything is connected to everything else” [44], all variables in
CLDs could be inter-related with arrows should all the stakeholders’ opinions be considered. In
addition, a consensus among stakeholders about variable relationships may reflect invisible conflict
for loops that read clockwise.
among stakeholders about variable relationships may reflect invisible conflict and marginalisation [45]. Finally, CLDs lack an explicit decision-making process, because they portray the system structure as several connected feedback loops [46]. Upon viewing CLDs, one cannot simply identify where the decisions start or what information is important to decision makers [46]. The ability to capture such decision-making processes is crucial to understanding the operational policies and how internal information is used [47].
Given the limitation of binomial variable classifications and the CLDs’ developing process, this research suggests the integration of a structural-analysis MICMAC method to expand the variable categories, illuminate causal relationships, and deal with causal relationship discrepancies. CLDs produced using this method are expected to assist modellers for further discussion with stakeholders.
3. Multi-Methodology Approach for CLDs’ Development
This research acknowledges a current debate on paradigm incommensurability and the multi-methodology approach. On the one hand, different paradigms cannot be merged because the underlying assumption about objective/subjective ontologies and epistemologies are irreconcilable [18]. On the other hand, the separation of paradigms is questioned altogether and the pluralist view is recommended to elucidate phenomena [48]. This research follows the latter school of thought. See [49,50] for discussion on paradigms for systems’ thinking.
Systems2019,7, 42 5 of 36
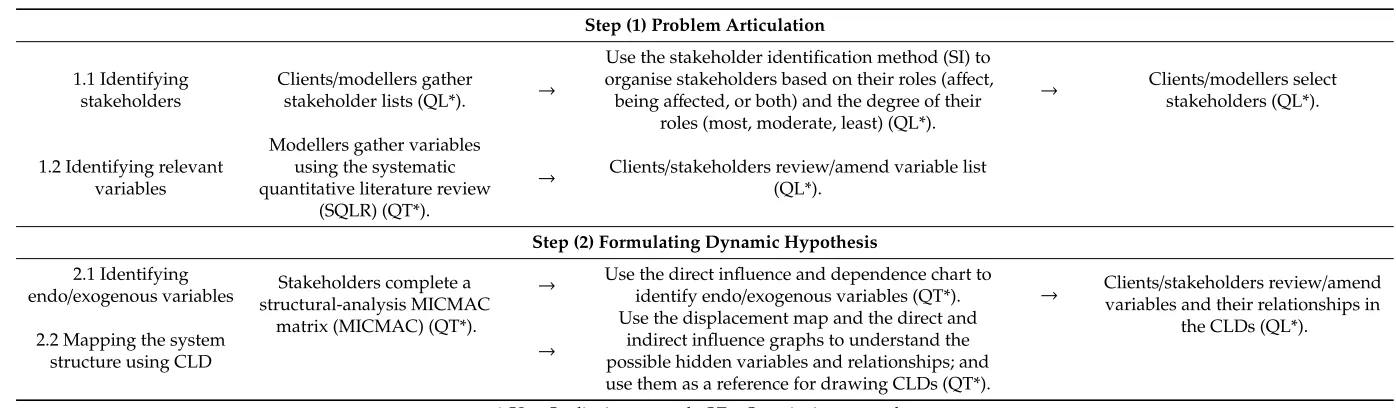
Table 1.The multi-methodology approach for causal loop diagrams (CLDs) development proposed by this research.
Step (1) Problem Articulation
1.1 Identifying stakeholders
Clients/modellers gather
stakeholder lists (QL*). →
Use the stakeholder identification method (SI) to organise stakeholders based on their roles (affect, being affected, or both) and the degree of their
roles (most, moderate, least) (QL*).
→ Clients/modellers select
stakeholders (QL*).
1.2 Identifying relevant variables
Modellers gather variables using the systematic quantitative literature review
(SQLR) (QT*).
→ Clients/stakeholders review/amend variable list
(QL*).
Step (2) Formulating Dynamic Hypothesis
2.1 Identifying
endo/exogenous variables structural-analysis MICMACStakeholders complete a
matrix (MICMAC) (QT*).
→ Use the direct influence and dependence chart to
identify endo/exogenous variables (QT*). → Clients/stakeholders review/amend
variables and their relationships in the CLDs (QL*).
2.2 Mapping the system
structure using CLD →
Use the displacement map and the direct and indirect influence graphs to understand the possible hidden variables and relationships; and use them as a reference for drawing CLDs (QT*).
Systems2019,7, 42 6 of 36
3.1. Step 1: Problem Articulation
3.1.1. A Stakeholder Identification (SI)
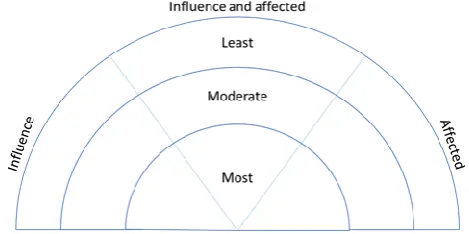
This research proposes SI to show ‘who’s in’and who is omitted. SI [52] allows modellers to identify stakeholders through experts, other stakeholders, announcements, population records or census, oral or written accounts of major events, or using [52]’s suggested stakeholders. Modellers can group stakeholders if the list is too long. Then, modellers sort stakeholders on a rainbow diagram by whether stakeholders can (1) ‘affect’, (2) ‘are affected by’, or (3) ‘affect and are affected by’ the phenomenon; by their role degrees of ‘most’, ‘moderate’ or ‘least’ (Figure1).
3.1. Step 1: Problem Articulation
3.1.1. A Stakeholder Identification (SI)
This research proposes SI to show ‘
who’s in’
and who is omitted. SI [52] allows modellers to
identify stakeholders through experts, other stakeholders, announcements, population records or
census, oral or written accounts
of major events, or using [52]’s suggested stakeholders. Modellers
can group stakeholders if the list is too long. Then, modellers sort stakeholders on a rainbow diagram
by whether stakeholders can (1) ‘affect’, (2) ‘are affected by’, or (3) ‘affect and are affected by’ the
phenomenon; by their role degrees of ‘most’, ‘moderate’ or ‘least’ (Figure 1).
The clear stakeholder division based on their roles and role degree are flexible according to the
stakeholder theories modellers may hold. For example, working on an environmental pollution,
modellers may adopt an inclusive perspective and include all stakeholders in the diagram based on
moral ground. If the research objective concerns the effectiveness of a given project, then stakeholders
who ‘most’ and ‘moderately’ affect the project function should be included [53]. In both cases, SI
illuminates which stakeholders are in/excluded with justifications. SI is limited to the subjective
stakeholder selection of experts and modellers. Using several experts or multiple sources can
minimise, but not completely eliminate such biases.
Other stakeholder identification methods in systems thinking exist. Vennix [54] recommends
including stakeholders who can implement the decisions. Yet the process for identifying those
stakeholders is rather superficial and lacks detail [55]. Müller, et al. [55] propose the four-phase
stakeholder identification with a distinction between actors, experts and agents. However, their
method is based on the inclusive perspective stakeholder theory and is not suitable for research
adopting other stakeholder theories [55].
Figure 1. Stakeholder identification method’s rainbow diagram. Source [52].
3.1.2. Systematic Quantitative Literature Review (SQLR)
This research proposes SQLR to create a quantifiable variable list. SQLR [56] allows modellers
to assess and select literature systematically based on preset-inclusion criteria such as search
keywords, databases, publication years, manuscript types, etc.
SQLR is flexible with a modeller’s epistemol
ogy. Should stakeholders be excluded, the variable
list is a quantifiable and justifiable literature scope [57]. Should stakeholders be included, they can
review and amend the variable list. SQLR is useful for the novice researcher and on an emerging
topic [58]. However, SQLR limits the inclusion criteria leading modellers to search only relevant
literature. This bias can be minimised by expanding the inclusion criteria and engaging stakeholders
for they too have a mental database [59].
Other literature rev
iew methods are the narrative method and Cochrane review’s meta
-analysis.
With the narrative method, modellers read relevant literature as much as possible. However,
selecting ‘relevant’ literature is highly subjective and relies on a modeller’s expertise
[60]. The
Cochrane review’s meta
-analysis requires an expert team to weight the literature based on the
methodology, sample size and effect size [61]. However, meta-analysis is inadequate for the sole
modeller or small research team, and for an emerging topic with limited data [58]. Thus, because Step
Figure 1.Stakeholder identification method’s rainbow diagram. Source [52].
The clear stakeholder division based on their roles and role degree are flexible according to the stakeholder theories modellers may hold. For example, working on an environmental pollution, modellers may adopt an inclusive perspective and include all stakeholders in the diagram based on moral ground. If the research objective concerns the effectiveness of a given project, then stakeholders who ‘most’ and ‘moderately’ affect the project function should be included [53]. In both cases, SI illuminates which stakeholders are in/excluded with justifications. SI is limited to the subjective stakeholder selection of experts and modellers. Using several experts or multiple sources can minimise, but not completely eliminate such biases.
Other stakeholder identification methods in systems thinking exist. Vennix [54] recommends including stakeholders who can implement the decisions. Yet the process for identifying those stakeholders is rather superficial and lacks detail [55]. Müller, et al. [55] propose the four-phase stakeholder identification with a distinction between actors, experts and agents. However, their method is based on the inclusive perspective stakeholder theory and is not suitable for research adopting other stakeholder theories [55].
3.1.2. Systematic Quantitative Literature Review (SQLR)
This research proposes SQLR to create a quantifiable variable list. SQLR [56] allows modellers to assess and select literature systematically based on preset-inclusion criteria such as search keywords, databases, publication years, manuscript types, etc.
SQLR is flexible with a modeller’s epistemology. Should stakeholders be excluded, the variable list is a quantifiable and justifiable literature scope [57]. Should stakeholders be included, they can review and amend the variable list. SQLR is useful for the novice researcher and on an emerging topic [58]. However, SQLR limits the inclusion criteria leading modellers to search only relevant literature. This bias can be minimised by expanding the inclusion criteria and engaging stakeholders for they too have a mental database [59].
Systems2019,7, 42 7 of 36
and effect size [61]. However, meta-analysis is inadequate for the sole modeller or small research team, and for an emerging topic with limited data [58]. Thus, because Step 1 evaluates the breadth rather than the depth of the research, SQLR has an advantage over a meta-analysis.
3.2. Step 2: Formulating a Dynamic Hypothesis
Structural-Analysis MICMAC
This research integrates a structural-analysis MICMAC to identify endogenous variables and develop the CLDs quantitatively. MICMAC determines variable roles and theirdirect and
indirectinfluence/dependence specified by stakeholders [62]. The MICMAC process [62] includes: (1) Identifying relevant variables recommended under 80 variables for the presentation purpose; (2) arranging variables into a matrix in a horizon and vertical lines; (3) asking experts to rate adirect
relationship between variables from zero (no influence), one (weak influence), two (moderate influence), and three (strong influence) line by line. Arcade et al. [63] recommends that stakeholders fill in the matrix together in seminars spread over three to six months. See the algorithm behind MICMAC in [64].
The MICMAC variable role analysis helps modellers quantify their endo/exogenous variable selection. MICMAC produces thedirectinfluence and dependence chart and positions each variable in a quadrant based on itsdirectrelationship. MICMAC sorts variables into four main and five sub-categories. These categories are: (1)Determinant variable, which is very influential with little dependence and can act on the system. Included in determinant variables are (1.1)environmental variable, which conditions the system and cannot be controlled; (2)relay variable, which is very influential and very dependent. Included in relay variables are: (2.1)Stake variable, that is the ‘potential breakpoint of the system’ or has a strong influence on the system; (2.2)target variable, that is more dependent than influent but influences the system if conducted in a desirable way; (3)depending variable, that is the system result, little influent, very dependent, and sensitive to the determinant and relay variable changes; (4)autonomous variable, that is incapable of changing the system or benefits from such change. Among the autonomous variables are: (4.1)Secondary leverthat is more influent than dependent and is the possible secondary system actor; and (4.2)Disconnected variablewhose origin is excluded from the studied system [63]. This research contends that the autonomous category, particularly the disconnected variable, is equivalent to the traditional exogenous variable. Thus, MICMAC quantifies the exogenous variable justification. This research recommends triangulating decisions to exclude any variables with stakeholders. In addition, different variable roles may illuminate where the decision starts in the system, hence, enhance the CLDs’ visualisation.
MICMAC also produces a displacement map displaying changes in variable roles underindirect
relationships. Changes in variable roles may indicate possible hidden influential variables through the feedback loop. This displacement map is based on MICMAC’s principle that if A directly influences B, and B directly influences C then changes in A would influence C. Thus, A and C have an indirect relationship which is hidden in the direct influence and dependence chart above [65]. Research shows that 20% of variables would change their categories under indirect relationships, a result considered to be important [66]. Modellers should explore the hidden variables with stakeholders.
The MICMACdirectandindirectrelationship analysis helps modellers develop the CLDs. MICMAC produces the directand indirect influence graph, illustrating weak, moderate, or strong variable relationships indicated by stakeholders. Modellers may refer to these relationships when drawing the CLDs. Relationships indicated by MICMAC are provisional, unclear whether they are negative or positive relationships, and need validation with stakeholders. Yet, this research contends that variable relationships could be numerous and missed without the help of computers.
as a group or the silence of the minority [63]. Time consumption to complete the matrix is another limitation. Arcade et al. [63] recommends organising a two to three-day seminar for 70 variables.
Other structural-analysis approaches exist that could conceptualise the CLDs. Among these, the interactive cross impact simulation (INTERAX) and trend impact analysis (TIA) are more well-known [67]. INTERAX requires numerous experts to analyse and develop alternative future scenario databases and strategies, sometimes up to 100 events with 50 trend forecasts [68,69]. Thus, INTERAX is expensive and difficult to use [67]. TIA times future events and their impacts by combining historical data and expert identified probabilities [70]. However, TIA is inappropriate when historical data are unavailable or unreliable [67]. The previous effort to combine MICMAC and CLD can be
found in [71–74]. This present research provides the justification for combining MICMAC and CLD.
4. Application in a Case Study
We demonstrate the multi-methodology approach on renewable energy technology (RET) adoption as a case study in the hotel sector in Queensland, Australia. We focus on the application of the multi-methodology approach and its contribution to the CLDs’ development. The explanations and interpretation of the social, economic and environmental impact of RET are beyond the scope of this paper. Other research that has applied the multi-methodology approach to develop a final quantitative model on renewable energy exist such as [75–77]. However, discussing them is beyond the scope of this paper.
Australia is the world’s 15th largest greenhouse gases (GHG) emitter mainly from burning fossil fuel for electricity [78]. As per the Paris Agreement, Australia is committed to reducing its emissions by 26–28% below the 2005 level by 2030 [79]. Promoting the RET adoption is one of Australia’s strategies to mitigate GHG emission [80]. The Australian government requires its electricity sector to source 20% of the power from renewable energy resources by 2020 [81]. Aided by some incentive policies such as Feed-in Tariffand large-scale RET investment funds [82], the national renewable energy production level has increased by 12% in 2016–2017, accounting for 16% of the total electricity production Australia-wide [83,84]. However, at the state level, Queensland has the lowest share of electricity generated by RET at 7% when compared with other states (Tasmania (87%), Southern Australia (43%), Victoria (14%), Western Australia (8%), and New South Wales (13%)) [84]. Queensland remains the largest emitter of the states/territories produced mainly by the coal-fired electricity sector [85]. Queensland needs to do more to assist Australia to meet the nation’s emissions target.
This research proposes that the hotel sector in Queensland has the potential to reduce emissions by adopting RET. This is because the hotel sector is one of the biggest electricity consumers among commercial buildings, spending approximately 10% of their budget on energy to provide 24-h services such as air-conditioning, space and water heating, lighting, lifts, and kitchen equipment [86,87]. In 2016, Queensland had 1235 establishments including hotels, motels, guesthouses, and serviced apartments with more than 15 rooms [88]. The number of hotel establishments and their energy consumption are expected to rise as the tourist visitor nights in Queensland increased by 5.7% in 2017–2018 [89]. The electrical grid distribution is not available Queensland-wide [90]. It is assumed that some hotels still rely on diesel generators, which further emit GHG through combustion. No significant findings of how many hotels are adopting RET currently worldwide, except for [91] who found that the RET adoption in the hotel sector globally is low with the exception of the thermal solar. Thus, research about the variables contributing to the RET adoption in the hotel sector in Queensland is required to promote the RET adoption.
Systems2019,7, 42 9 of 36
can hinder the RET breakthrough [96]. The RET adoption is also influenced by the energy storage price, and grid distribution and skilled workforce availability [96–98].
Different perspectives on the RET adoption highlight interactive components which affect an RET adoption decision, and their inherent non-linear relationships. In addition, different perspectives indicate possible multiple stakeholders and an interdisciplinary topic; warranting a systematic approach to identify stakeholders and measure the literature breadth. The given RET adoption in the hotel sector is an emerging topic, integrating that a structural-analysis would provide modellers with a system preunderstanding. Thus, this research adopts a multi-methodology approach to develop the CLDs.
4.1. Step 1: Problem Articulation
4.1.1. Stakeholder Identification
Experts identified stakeholders related to the hotel RET adoption in Queensland in this research. Experts can represent different stakeholder perspectives [55] suitable for this multi-disciplinary topic. In this research, one tourism industry and one engineering expert have identified 19 stakeholders (see Table2), classified into seven categories: The hotel sector, tourists, the government, RET companies, the community, the financial sector and electricity providers. Both experts agree that: The RET industry can influence RET adoption the most, the hotel sector can influence and is affected by RET adoption the most, and the local community and the environment are affected by such decision the most. No stakeholder is identified in the ‘least’ category. This research aims to understand the variables contributing to the hotel RET adoption from different perspectives, thus we avoid any trade-off and include all identified stakeholders. Modellers reserve the right to represent the environment. This research does not seek expert consensus about stakeholder identification.
Table 2.Expert identified stakeholders influencing, both influencing and affected by, and affected by the hotel RET adoption in Queensland, Australia.
Expert Influencing Influencing and Affected Affected
Most Moderate Most Moderate Most Moderate
Tourism
RET consulting
company
-Federal Gov. * -Guest -Hotel chain
head office
-Hotel engineer -Hotel manager -Hotel owner
-Bank -State Gov. -Electricity company
Atmosphere Community
Engineering RET
industry
-Hotel owner -State Gov. -Financial institution
-Tourists
-Local Gov. -Local community -Koalas
* Gov.=Government.
4.1.2. Variable Inventory
even if they are used in tourist accommodation and fuelled by renewable energy resources. Papers must collect data from existing or modelled tourist accommodation. Research on a hybrid system with RET was included. The review includes electricity generation from renewable energy resources and multi-purpose functions such as cooling and heating. Electricity produced from RET must be used to support the tourist accommodation. A total of 52 research journal papers and 81 variables related to tourist accommodation and RET were identified. Discussing the SQLR result is beyond this paper’s scope.
One tourism and two engineering experts revised the 81 variables, their names and interpretations. Experts can represent stakeholder perspectives and are appropriate for a validating task [55]. Experts merged and split some variables for clarity, resulting in 38 variables (see AppendixA). Thirty-eight variables serve as a starting point for CLDs’ development but not a final list.
4.2. Step 2: Formulating a Dynamic Hypothesis
4.2.1. Identifying Endogenous Variables
Next, we identified endo/exogenous variables by using a quantitative MICMAC method, followed by a qualitative stakeholder review. For the MICMAC method, the 38 variables identified in the previous process were arranged into a matrix, equivalent to 1444 questions (38×38). Two governmental
departments related to energy and innovation, two RET companies, two hotel accountants, two hotel engineers, two hotel managers, and one financial institution were approached. However, we were unable to organise a workshop for the MICMAC completion due to the stakeholders’ other commitments. Therefore, we sent the matrix and variable definitions to stakeholders to be filled in individually. Space was given at the end of the matrix should stakeholders wish to add their own variables. None has taken this option. Stakeholders had 14 days to complete the matrix, with an email reminder sent on the seventh day. Two hotel accountants, two hotel engineers, and two hotel managers completed the matrix. The low response rate could be due to the length of time needed to complete the matrix. The small sample size is acceptable because the MICMAC process is based on the experts’ opinions rather than a statistical mean [63]. The stakeholders’ responses were summarised using the geometric mean and analysed in the MICMAC software version 6.1.2. The geometric mean is selected over the mean and median because it is insensitive to the skewed data and works well with the small sample size [99].
We identified endo/exogenous variables through MICMAC’sdirectinfluence and dependence chart. Based on the stakeholders’ ranking, MICMAC classified 38 variables into nine roles (Figure2). The MICMAC categories suggest that ‘availability of the workforce’ and ‘public engagement in RET policy’ are disconnected variables. Decisions to exclude disconnected variables were discussed during stakeholder interviews.
4.2.2. Structural-Analysis MICMAC Results
MICMAC produces a displacement map and direct/indirect influence graph, which can be used to illustrate the complex system of the RET adoption in the hotel sector. First, MICMAC’s displacement map shows that seven variables changed their categories when comparing theirdirectandindirect
Systems2019,7, 42 11 of 36
Systems 2019, 7, 42 10 of 36
must be used to support the tourist accommodation. A total of 52 research journal papers and 81
variables related to tourist accommodation and RET were identified. Discussing the SQLR result is
beyond this paper’s scope.
One tourism and two engineering experts revised the 81 variables, their names and
interpretations. Experts can represent stakeholder perspectives and are appropriate for a validating
task [55]. Experts merged and split some variables for clarity, resulting in 38 variables (see Appendix
A). Thirty-
eight variables serve as a starting point for CLDs’ development but not a final list.
4.2. Step 2: Formulating a Dynamic Hypothesis
4.2.1. Identifying Endogenous Variables
Next, we identified endo/exogenous variables by using a quantitative MICMAC method,
followed by a qualitative stakeholder review. For the MICMAC method, the 38 variables identified
in the previous process were arranged into a matrix, equivalent to 1444 questions (38 × 38). Two
governmental departments related to energy and innovation, two RET companies, two hotel
accountants, two hotel engineers, two hotel managers, and one financial institution were approached.
However, we were unable to organise a workshop for the MICMAC completion due to the
stakeholders’ other commitments. Therefore, we sent the matrix and variable definitions to
stakeholders to be filled in individually. Space was given at the end of the matrix should stakeholders
wish to add their own variables. None has taken this option. Stakeholders had 14 days to complete
the matrix, with an email reminder sent on the seventh day. Two hotel accountants, two hotel
engineers, and two hotel managers completed the matrix. The low response rate could be due to the
length of time needed to complete the matrix. The small sample size is acceptable because the
MICMAC process is based on the
experts’ opinions rather than a statistical mean [63].
The
stake
holders’ responses were summarised using the geometric mean and analysed in
the MICMAC
software version 6.1.2. The geometric mean is selected over the mean and median because it is
insensitive to the skewed data and works well with the small sample size [95].
We identified endo/exogenous variables through MICMAC’s
direct
influence and dependence
chart. Based on the stakeholders’ ranking, MICMAC classified 38 variables into nine roles (Figure 2).
The MICMAC categories suggest that ‘availability of the workforce’ and ‘public engagement in RET
policy’ are disconnected variables. Decisions to exclude disconnected variables were discussed
during stakeholder interviews.
Figure 2.Roles of variables related to the renewable energy technology adoption in the hotel sector in Queensland, based on Impact Matrix Cross-Reference Multiplication Applied to a Classification (MICMAC)’s direct influence and dependence map.
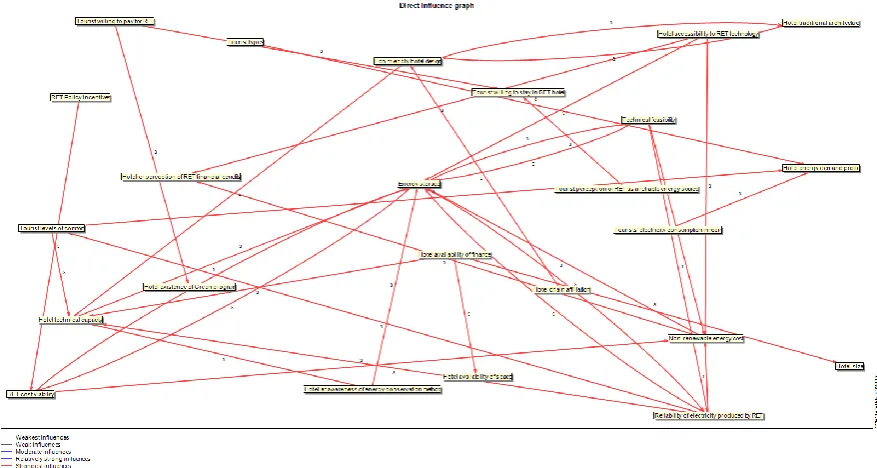
Second, MICMAC maps weak, moderate and strongdirect influence relationships between variables. For clarity, Figure3displays only strongdirectinfluence relationships. Figure3shows 24 variables are strongly related in the Queensland context. Arrows concentrate particularly on energy storage, hotel technical capacity, and non-renewable energy cost. However, MICMAC does not indicate whether the relationships are positive or negative. We used these arrows to draw the CLDs. The CLDs and direct relationships were later discussed with stakeholders.
Systems 2019, 7, 42 11 of 36
Figure 2. Roles of variables related to the renewable energy technology adoption in the hotel sector in Queensland, based on Impact Matrix Cross-Reference Multiplication Applied to a Classification (MICMAC)’s direct influence and dependence map.
4.2.2. Structural-Analysis MICMAC Results
MICMAC produces a displacement map and direct/indirect influence graph, which can be used
to illustrate the complex system of the
RET adoption in the hotel sector. First, MICMAC’s
displacement map shows that seven variables changed their categories when comparing their
direct
and
indirect
influence and dependence. T
hese changes include: (1) ‘hotel availability of finance’ from
relay to determinant variable; (2) ‘eco
-
friendly hotel design’ from stake to target variable; (3) ‘tourist
willing to stay in RET hotel’ and ‘tourists’ electricity consumption in room’ from aut
onomous to
depending variables; (4) ‘travel season’ from secondary to disconnected variable; and (5) ‘tourist
willing to pay for RET’ from determinant to disconnected variable. These changes indicate possible
hidden variables that connect between them and the hotel RET adoption. Modellers referred to this
information during stakeholder interviews.
Second, MICMAC maps weak, moderate and strong
direct
influence relationships between
variables. For clarity, Figure 3 displays only strong
direct
influence relationships. Figure 3 shows 24
variables are strongly related in the Queensland context. Arrows concentrate particularly on energy
storage, hotel technical capacity, and non-renewable energy cost. However, MICMAC does not
indicate whether the relationships are positive or negative. We used these arrows to draw the CLDs.
The CLDs and direct relationships were later discussed with stakeholders.
MICMAC also indicates three strong
indirect
influence relationships from: (1) ‘hotel availability
of finance’ to ‘existence of Green program in hotel’; (2) ‘hotel rating’ to ‘hotel energy demand profile’;
(3) ‘hotel chain affiliation’ to ‘hotel energy demand profile’, indicating hidden variables between the
pair. We discussed these relationships with stakeholders during interviews.
Figure 3. Direct influence graph representing the strongest influence of variables of the RET adoption in the hotel sector in Queensland.
4.2.3. Mapping System Structure Using CLD
Developing the CLDs of the hotel RET adoption went through five main stages, using the
VENSIM software version DSSx32 6.3E (Ventana Systems, Inc., Harvard, MA, USA.). In the first stage,
we developed a preliminary CLD based on variables and relationships found in the SQLR. In the
second stage, we added MICMAC’s
direct
strong variable relationships and marked the role of each
Figure 3.Direct influence graph representing the strongest influence of variables of the RET adoption in the hotel sector in Queensland.
(3) ‘hotel chain affiliation’ to ‘hotel energy demand profile’, indicating hidden variables between the pair. We discussed these relationships with stakeholders during interviews.
4.2.3. Mapping System Structure Using CLD
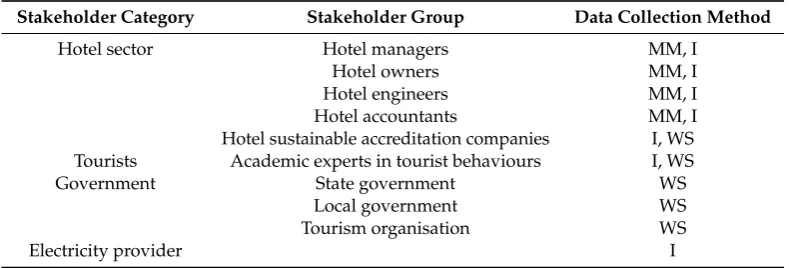
Developing the CLDs of the hotel RET adoption went through five main stages, using the VENSIM software version DSSx32 6.3E (Ventana Systems, Inc., Harvard, MA, USA.). In the first stage, we developed a preliminary CLD based on variables and relationships found in the SQLR. In the second stage, we added MICMAC’sdirectstrong variable relationships and marked the role of each variable, resulting in the CLD1. In the third stage, we asked individual stakeholders face-to-face to review CLD1. In these meetings, we explained the concept of systems thinking and the research problem and asked stakeholders if the CLD1coincided with their opinions. Changes to CLD1from one interview were incorporated to the next. Any disagreements between interviews were clarified in the stakeholder engagement workshop. Interviews results in CLD2. In the fourth stage, we organised a stakeholder engagement workshop to review CLD2. Stakeholders received an information package about systems thinking, CLD2copied, and variable definitions one week prior to the workshop. At the workshop, CLD2was presented and stakeholders were asked to amend variables and relationships with justifications. The stakeholder engagement workshop resulted in CLD3. At the final stage, CLD3 was presented at the 2017 International Congress on Modelling and Simulation Conference, held in Tasmania, Australia [100] and again at the 2018 Council of Australasian Tourism and Hospitality Education Conference, held in Newcastle, Australia [101]. Conference attendees were invited to amend variables and their relationship. These revisions resulted in the final CLD. No changes to CLD3were made at either conference. Stakeholders present at each research stage are summarised in Table3.
Table 3. Involving stakeholders at each stage of the CLD’s development (MM =MICMAC, I= one-on-one interview, WS=stakeholder engagement workshop).
Stakeholder Category Stakeholder Group Data Collection Method
Hotel sector Hotel managers MM, I
Hotel owners MM, I
Hotel engineers MM, I
Hotel accountants MM, I
Hotel sustainable accreditation companies I, WS Tourists Academic experts in tourist behaviours I, WS
Government State government WS
Local government WS
Tourism organisation WS
Electricity provider I
1. Preliminary CLD
Systems2019,7, 42 13 of 36
Systems 2019, 7, 42 14 of 36
Figure 4. The preliminary CLDs of RET adoption in the hotel sector based on the systematic quantitative literature reviews.
31.Technology feasibility
30.RET cost viability 32.Reliability of electricity
produced by RET
33.Energy Storage
S
38.Reliability/availability of non-renewable supply 37.Non-renewable energy cost
Hotel RET adoption
S
S
5. Australia's annual emissions rate 4. Australia's 2030
climate change target S
3. The Renewable Energy Target Scheme
2. RET policy incentives
S
S
14.Hotel accessibility to RET technology
24.Hotel availability of finance 23.Hotel
availability of space
8. Hotel energy demand profile
17.Hotel size
19.Hotel rating
16.Hotel chain affiliation S
18. Hotel traditional architecture
22. Hotel technical capacity
15.Eco-friendly hotel design
O O
25.Hotel existence of green program
O
26.Hotel accessibility to electricity grid
20.Hotel location O 21.Hotel land/building ownership S O S S
11.Tourist willing to pay for RET
10. Tourist willing to stay in RET hotel
S
34.Tourist evels of comfort 9.Tourist perception of
RET as a reliable energy source
S
7. Tourists' electricity consumption in room
S
6. Travel season
S 27.Hotelier perception
of RET as selling point S
28.Hotelier perception of RET financial benefits
S
S
29.Hotelier awareness of energy conservation
method
S S
35.Green job creation
13.Tourist perceived quality of service
S S 12.Tourist types S S S S S O S S S S S S O S S S S S S S S S O S
Hotelier Tourists Technology Policy Others
36.Availability of workforce
1.Public engagement in RET policy
S
O
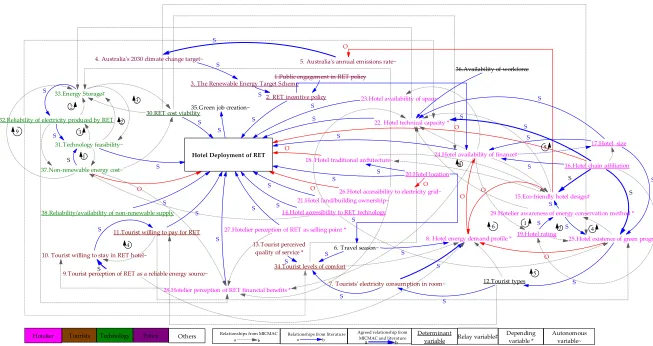
Figure 5. CLD1 of RET adoption in the hotel sector within Queensland, based on the systematic quantitative literature review and MICMAC.
31.Technology feasibility~
30.RET cost viability
32.Reliability of electricity produced by RET 33.Energy Storage#
S
38.Reliability/availability of non-renewable supply 37.Non-renewable energy cost~
Hotel Deployment of RET
S
S
5. Australia's annual emissions rate~ 4. Australia's 2030 climate change target~
S
3. The Renewable Energy Target Scheme
2. RET incentive policy S
S
14.Hotel accessibility to RET technology
24.Hotel availability of finance# 23.Hotel availability of space~
8. Hotel energy demand profile *
17.Hotel size
19.Hotel rating
16.Hotel chain affiliation S
18. Hotel traditional architecture~
22. Hotel technical capacity *
15.Eco-friendly hotel design#
O O
25.Hotel existence of green program#
O
26.Hotel accessibility to electricity grid~ 20.Hotel location
O
21.Hotel land/building ownership~
S O
S
S
11.Tourist willing to pay for RET
10. Tourist willing to stay in RET hotel~ S
34.Tourist levels of comfort 9.Tourist perception of RET as a reliable energy source~S
7. Tourists' electricity consumption in room~
S
6. Travel season~ S
27.Hotelier perception of RET as selling point * S
28.Hotelier perception of RET financial benefits * S
S
29.Hotelier awareness of energy conservation method *
S S 35.Green job creation~
13.Tourist perceived quality of service *
S S 12.Tourist types S S S S S O S S S S S S O S O S S S S S S S S O S
Hotelier Tourists Technology Policy Others a b
Relationships from MICMAC Relationships from literature
a b
Agreed relationship from MICMAC and literature
a b
Determinant variable
Depending variable *
Relay variable# Autonomous variable~ 36.Availability of workforce
1.Public engagement in RET policy
2 3 1 3 2 4 1 4 5 6 7 5 8 9
Systems2019,7, 42 15 of 36
2. CLD1
Figure5shows CLD1produced by integrating MICMAC’s and SQLR’s variable relationships. The integration reveals three system complexities. First, CLD1 exposes additional relationships unexplored in the previous research (see dotted arrows), indicating limited research about the hotel RET adoption. Only six stakeholder-identified relationships have been researched previously (see thick arrows), including: Australia’s annual emission rate—Australia’s 2030 climate change target, tourists’ perception of RET as a reliable energy source—tourists willing to stay in the RET hotel, tourists’ electricity consumption in room-hotel energy demand profile, hotel chain affiliation—eco-friendly hotel design, hotel affiliation—hotel implementing a green program, and hotel chain affiliation—hotel technological capacity.
Second, CLD1has 14 feedback loops, including five counter clockwise and nine clockwise loops (Table4). The next stakeholder interview can illuminate whether these loops are reinforcing (creating exponential growth/decline over time) or balancing (stabilising the system overtime) loops. Third, CLD1 illuminates each variable’s role to the hotel RET adoption, enhancing the modellers’ understanding of the system.
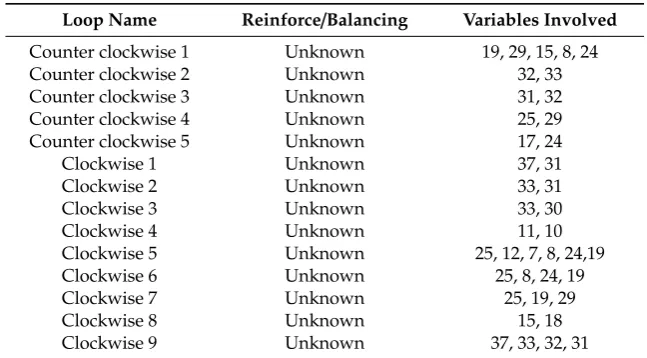
Table 4.Descriptions of the feedback loops within Figure5.
Loop Name Reinforce/Balancing Variables Involved
Counter clockwise 1 Unknown 19, 29, 15, 8, 24
Counter clockwise 2 Unknown 32, 33
Counter clockwise 3 Unknown 31, 32
Counter clockwise 4 Unknown 25, 29
Counter clockwise 5 Unknown 17, 24
Clockwise 1 Unknown 37, 31
Clockwise 2 Unknown 33, 31
Clockwise 3 Unknown 33, 30
Clockwise 4 Unknown 11, 10
Clockwise 5 Unknown 25, 12, 7, 8, 24,19
Clockwise 6 Unknown 25, 8, 24, 19
Clockwise 7 Unknown 25, 19, 29
Clockwise 8 Unknown 15, 18
Clockwise 9 Unknown 37, 33, 32, 31
The modellers prepared stakeholder interviews based on these insights. Careful interview preparation can actively engage and interest stakeholders [102].
3. CLD2, CLD3, and Final CLD
During the interviews and workshop, each stakeholder group had its own concerns. For example, the hotel sector prioritised customer satisfaction, and identified RET adoption drivers as ‘tourist’s levels of comfort’ and tourist’s perceived value for money, ‘the reliability of electricity produced by RET’, and ‘the hotel owner’s perceptions of RET financial benefits’. The government representatives were interested in variable contributing RET policy incentives; the electrical provider in future demand for grid electricity and RET incentive policy; and the hotel’s sustainable accreditation in reducing the hotel’s impact on the environment.
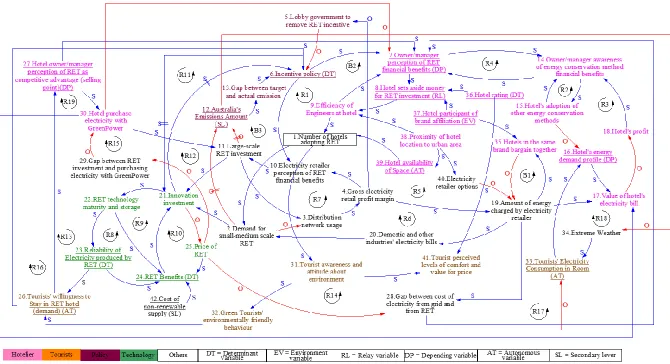
The final CLD produced from the stakeholders’ engagement workshop and conference discussion is shown in Figure6. Many variable names changed after interviews and workshop. Only 14 out of 36 variables identified by the SQLR remained, while seven were deleted, 12 were evolved, three dissolved, and 13 newly added, resulting in a total of 42 variables in the final CLD (see list of variables in AppendixA).
loops include: (1) The influence of energy storage on the RET electricity reliability, and the RET benefit; (2) the influence of a hotel owner/manager’s perception of the RET financial benefits on the RET adoption, and the perception’s reliance on the RET incentive policy, the RET benefits on marking and expense savings, and grid price; (3) the impact of the hotel’s electricity expense on the hotel’s revenue and the RET adoption decision; and (4) the importance of a hotel engineer’s efficiency to lead hotels to adopt RET.
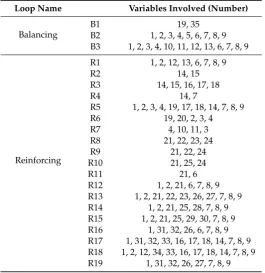
Table 5.The feedback loop descriptions within Figure6.
Loop Name Variables Involved (Number)
Balancing
B1 19, 35
B2 1, 2, 3, 4, 5, 6, 7, 8, 9 B3 1, 2, 3, 4, 10, 11, 12, 13, 6, 7, 8, 9
Reinforcing
R1 1, 2, 12, 13, 6, 7, 8, 9
R2 14, 15
R3 14, 15, 16, 17, 18
R4 14, 7
R5 1, 2, 3, 4, 19, 17, 18, 14, 7, 8, 9
R6 19, 20, 2, 3, 4
R7 4, 10, 11, 3
R8 21, 22, 23, 24
R9 21, 22, 24
R10 21, 25, 24
R11 21, 6
R12 1, 2, 21, 6, 7, 8, 9 R13 1, 2, 21, 22, 23, 26, 27, 7, 8, 9 R14 1, 2, 21, 25, 28, 7, 8, 9 R15 1, 2, 21, 25, 29, 30, 7, 8, 9 R16 1, 31, 32, 26, 6, 7, 8, 9 R17 1, 31, 32, 33, 16, 17, 18, 14, 7, 8, 9 R18 1, 2, 12, 34, 33, 16, 17, 18, 14, 7, 8, 9 R19 1, 31, 32, 26, 27, 7, 8, 9
SystemsSystems 20192019,, 77, 42, 42 18 of 36 17 of 36
Figure 6. The final CLD for the RET adoption in the hotel sector in Queensland, Australia, developed from the systematic literature review, MICMAC, stakeholder interviews and workshop.
5. Conclusions and Further Work
This research presents a multi-methodology approach to develop the causal loop diagrams (CLDs). We integrate the quantitative approach including stakeholder identification method (SI), a systematic quantitative literature review (SQLR), and a structural-analysis MICMAC, with the traditional qualitative approach including stakeholder interviews and an engagement workshop. Our proposed multimethod maintains the essence of the original CLD process but adds new stages to define stakeholders, variables, their roles and relationships in a quantitative and logical way. The key findings and main contributions to developing the CLD process are:
• Allowing detailed stakeholder identification based on their roles and the role degrees.
• Providing a quantifiable literature scope to identify relevant variables.
• Identifying endogenous and exogenous variables quantitatively.
• Illuminating possible direct and indirect relationships between variables quantitatively.
• Indicating possible hidden variables quantitatively.
The multi-methodology approach was applied to develop the CLDs in a case study. In our opinion, the case complexity illustrates the multi-methodology application advantages and may be useful for other studies.
However, the multi-methodology approach to develop the CLDs has some limitations. First, SI obscures how to deal with different identified stakeholders. In this research, both stakeholders have identified similar results. However, other research may encounter different stakeholder identification. We recommend future research to use more than two experts and seek consensus when identifying stakeholders. Second, the MICMAC matrix is time-consuming, and took more than three hours for stakeholders. Future research is recommended to reduce the variable numbers. We conclude that managing the vagueness in the stakeholder and modeller judgement will improve the CLDs developing process. Hence, the multimethod approach can be helpful.
We acknowledge that translating the CLDs to the quantitative model is a non-trivial process. Our motivation underlying this work is that modelling the quantitative model through the CLDs would benefit from engaging early with the stakeholders, understanding their mental models, and formulating the dynamic hypotheses [2]. We focus on improving the CLDs developing process before translating into the quantitative model. This research is limited to a qualitative conceptualization. Developing a quantitative model of the hotel RET adoption in Queensland is ongoing and will be published in a subsequent paper. The literature on converting the CLDs to a quantitative model can be found in [2,103].
We also acknowledge a low agreement about whether to use the CLDs or quantitative model to conceptualize the studied phenomenon. Engaging in such a debate is beyond the scope of this paper, but can be found in [8,104].
Author Contributions:N.D. performed the literature review, collecting and analysing the data, conceptualising the model and drafting the paper. O.S. revised the manuscript.
Funding:This research received no external funding.
Acknowledgments:This research acknowledges three reviewers for their detailed comments; and Susanne Becken for her input.
Systems2019,7, 42 19 of 36
Appendix A.
Table A1.List of Variables Related to the RET Adoption in the Hotel Sector, Queensland
Stage
Used Variable Name Description References
Role (As Per
MICMAC) Action
M * Public Engagement in RET policy
Public perception is considered when designing renewable
energy policy. [105,106] Disconnected Delete by researchers.
M * RET incentive policy Feed-in-tariffand investment funding through the
Australia Renewable Energy Agency (ARENA). [107,108] Determinant
Keep. Name change to ‘Incentive policy’ as per
stakeholders.
M * The Renewable Energy Target scheme
The RET scheme operates in two parts: Large Renewable Energy Target (LRET) and Small-Scale Renewable Energy Scheme (SRES)
The LRET creates a financial incentive for the expansion of renewable energy power stations. The new target for LRET is 33,000 GWh in 2020 or equivalent to 23.5% of Australia’s electricity generation.
The SRES creates financial incentives for households, small businesses and community groups to install small-scale renewable energy system.
[109] Determinant
Dissolve into ‘Incentive policy’, ‘Large-scale RET
investment’, and ‘Demand for small-medium scale RET’
as per stakeholders.
M * Australia’s 2030 climate change target
Australia will reduce emissions to 26–28% on 2005 levels by 2030.
This target represents a 50–52% reduction in emissions per capita and a 64–65% reduction in the emissions intensity of the economy between 2005 and 2030.
[110] Secondary lever
Evolve to ‘Gap between the target and actual
emission’ as per modelling experts.
M * Australia’s annual emissions rate
The amount of Australia’s annual emissions. For example, in 2014–2015 Australia emitted 549.3 Mt CO2-e. This figure is the second lowest emissions level since, and 1.9 per cent below, 2000 levels (560.2 Mt CO2-e) and 10.2 per cent below 2005 levels (611.4 Mt CO2-e).
The level of atmospheric gases including carbon dioxide (CO2), methane (CH4), and nitrous oxide (N2O) which are responsible for the greenhouse effect and climate change.
[111,112] Secondary lever
Keep. Name change to ‘Australia’s emission
Table A1.Cont.
Stage
Used Variable Name Description References
Role (As Per
MICMAC) Action
M * Travel season
Certain seasons (i.e., winter, summer) are perceived by tourists to be favourable to visit a certain destination. For example, a favourable season for a coastal hotel is summer, and winter for a ski resort.
Electrical load of a hotel varies according to a variable tourist presence during travel season.
[113] Secondary lever
Evolve to ‘Extreme weather’ as per
stakeholder.
M *
Tourists’ electricity consumption in the
room
The amount of electricity consumed by tourists during their stay at the hotel.
Tourists consume higher rate of energy during their stay in the hotel when compared with when they are at home. This irrational behaviour results from tourists paying a flat rate for their room irrespective of amount of energy consumed. Tourists also wish to enjoy the hotel’s available service to the maximum during their stay.
[114] Autonomous Keep
M * Hotel energy demand profile
The amount of electricity used by the hotel on heating, cooling and food processing.
Types of hotel and star rate determine the availability of guest facilities such as a swimming pool, spa, air
conditioner, heater, etc. In addition, the hotel operates 24 h per day.
[115,116] Depending Keep
M *
Tourist’s perception of RET as a reliable
energy source
Tourist’s perception of RET as a reliable source of energy for
the hotel. [117] Secondary lever
Evolve to ‘Tourists’ perceived levels of comfort and value for price’ as per stakeholders.
M * Tourist willing to stay
in RET hotel Tourists willing to stay in hotels that invest in RET. [117–119] Autonomous
Keep. Name change to ‘Tourists’ willingness to
stay in RET hotel (demand)’ as per stakeholders.
M * Tourist willing to pay
for RET Tourists willing to pay extra for hotels that invest in RET. [117–119] Determinant
Delete as per stakeholders as it is covered in ‘Tourist willing to stay in RET