M E T H O D
Open Access
Hidden Markov models lead to higher
resolution maps of mutation signature
activity in cancer
Damian Wojtowicz
1†, Itay Sason
3†, Xiaoqing Huang
1†, Yoo-Ah Kim
1, Mark D. M. Leiserson
2*,
Teresa M. Przytycka
1*and Roded Sharan
3*Abstract
Knowing the activity of the mutational processes shaping a cancer genome may provide insight into tumorigenesis and personalized therapy. It is thus important to characterize the signatures of active mutational processes in patients from their patterns of single base substitutions. However, mutational processes do not act uniformly on the genome, leading to statistical dependencies among neighboring mutations. To account for such dependencies, we develop the first sequence-dependent model, SigMa, for mutation signatures. We apply SigMa to characterize genomic and other factors that influence the activity of mutation signatures in breast cancer. We show that SigMa outperforms previous approaches, revealing novel insights on signature etiology. The source code for SigMa is publicly available at https://github.com/lrgr/sigma.
Keywords: Mutational process, Hidden Markov model, Mutation signature, Breast cancer
Background
Cells acquire somatic mutations over time from expo-sure to different combinations of mutational processes, potentially leading to cancer. Understanding the activity of mutational processes is critical for cancer treatment, as many standard treatments introduce DNA damage or inhibit DNA damage repair genes [1, 2]. Presently, clinicians use specialized assays for specific biomark-ers to characterize DNA damage repair deficiencies, such as microsatellite instability (see, e.g., [3]). Large-scale cancer sequencing efforts have recently opened up new avenues for characterizing the activity of muta-tional processes. The key insight is that mutamuta-tional pro-cesses leavesignaturesof their activity in cancer genomes, the most well-studied of which are patterns of base substitutions.
*Correspondence:[email protected];[email protected];
†Damian Wojtowicz, Itay Sason and Xiaoqing Huang contributed equally to
this work.
2Center for Bioinformatics and Computational Biology, University of Maryland, 8125 Paint Branch Dr, College Park 20740, USA
1National Center for Biotechnology Information, National Library of Medicine, National Institutes of Health, 8600 Rockville Pike, Bethesda 20894, USA Full list of author information is available at the end of the article
An increasing body of research aims at inferring signa-tures and their exposures from large datasets of mutations from cancer whole-exome and whole-genome sequences [4–10], and the Catalogue of Somatic Mutations in Cancer (COSMIC) consortium has collected a census of 30 vali-dated mutation signatures [11]. Many of these signatures are associated with deficient DNA damage repair path-ways; some have been validated experimentally [12, 13], expanding the opportunity for targeted therapy. For exam-ple, Davies et al. [14] provided evidence that muta-tion signatures reveal patients deficient in homologous recombination repair (HR) and thus may benefit from PARP inhibitor treatment. Importantly, some of these patients do not harbor biallelic inactivations in known HR genes. Other signatures are associated with environmen-tal exposures to carcinogens such as tobacco smoke [15] or aflatoxin [16], and two are associated with aging [17] indicating that the underlying mutational processes may be active in healthy cells.
Despite these advances, uncovering etiology of muta-tion signatures and inferring their exposures remain
significant challenges, e.g., about half of the COSMIC signatures have no known etiology. Even with validated mutation signatures, it can be difficult to infer their exposures and assign individual mutations to the corre-sponding signature, in part because there may be multiple signatures of the same mutational process. One key factor to inferring signature exposure is the sequential depen-dency of the signatures. This is the idea that mutations that are adjacent in a given cancer genome are more likely to be the result of the same mutation signature. In their seminal work, Nik-Zainal et al. [18] identified clus-ters of mutations in breast cancers (termedkataegis) that display a particular base substitution signature. Kasar et al. [7] uncovered a signature of “canonical” activation-induced cytidine deaminase (AID) pathway activity in chronic lymphocytic leukemia that was missed by Alexan-drov et al. [4]. Part of the reason for their discovery was that they incorporated the “nearest mutation distance” into their model, since AID is known to cause multiple mutations within local regions of the genome. Morganella et al. [19] identified the so-called processive groups of up to 20 mutations believed to come from the same signa-ture. Morganella et al. [19] and Haradhvala et al. [20] both characterized signatures in terms of the transcriptional and replicative strands and replication timing. Supek and Lehner [21] identified mutation signatures that are specif-ically associated with clusters of mutations and showed that the activity of these signatures is associated with an increase in the mutation rate of expressed genes.
Motivated by this earlier work, we set out to model the genomic factors that bias mutational process activ-ity, such as genome position, CpG islands, and replication origins. We hypothesized that by capturing the statisti-cal dependencies introduced by these genomic factors, our models would yield more precise estimates of muta-tion signature exposure, and would further reveal genomic features that correlate with mutational process activi-ties. Our contribution is threefold: (i) we suggest the first probabilistic model to account for sequential depen-dency among mutation signatures; (ii) we use this model to rigorously assign mutation signatures to individual mutations and characterize the genomic and phenotypic preferences of mutation signatures; and (iii) we study the transition probabilities between different mutation signatures.
Methods
A hidden Markov model of mutation signatures
Following previous work, we categorize mutations in a cancer genome intoL=96 categories that include its base substitution (C:G>A:T, C:G>T:A, C:G>G:C, A:T>C:G, A:T>T:A, A:T>G:C), and left- (4) and right-flanking (4) nucleotides [4]. We model an observed sequence of muta-tions using a hidden Markov model (HMM). The model
assumes that each observation, representing a mutation category, is emitted by one ofKstates in a Markov chain, representing a mutation signature. The sequence of states that generated the observed sequence is unknown, but as the states form a Markov chain, each state depends on the previous state, thus capturing sequential dependencies between states. An HMM is parameterized by a vectorπ ofK starting probabilities, aK×K transition matrixA, and aK×Lemission matrixE.
The above HMM can capture sequential dependen-cies but is less motivated for “isolated” mutations that are distant from any other mutation. We call such dis-tal mutation regionsskyand refer to regions of proximal mutations asclouds(using a distance threshold of 2000 bp as explained below).
We model sky mutations using a multinomial mixture model (MMM). The MMM is characterized by a vector
g ofK mutation signature marginal probabilities and the same emission matrixE. To model cloud mutations, we use a dynamic Bayesian network (DBN) that is a simple extension of an HMM in that it allows subsequences gen-erated by the HMM to be interspersed with mutations generated by the MMM (for a review of DBNs, see [22]). We call the resulting composite model Signature Markov model (SIGMA); a simplified overview of the model is pre-sented in Fig.1, and its cloud component is sketched in Additional file1: Figure S1.
We now define the SIGMAmodel for clouds. The input data is a sequence of O1,. . .,OT mutation categories. The (hidden) signature that generated mutation category
Ot is represented byQt. The transitions between signa-tures at each subsequent position depend on whether the observed mutation category occurs within sky (marked by a binary indicatorIt) or clouds. The joint probability distribution of the model is:
Pr(OTt=1,QtT=1,ItT=1)
=Pr(Q1)Pr(I1) ⎡
⎣T
t=2
Pr(Qt|Qt−1,It−1)Pr(It|It−1) ⎤
⎦T
t=1
Pr(Ot|Qt).
(1)
We now define the conditional probability distributions (CPDs). The transition between signature statesQt−1 to
Qt depends on the indicator It−1 in the following man-ner. Within sky, the transitions occur according to the marginal probability of each state (i.e., as in the MMM), while otherwise the transitions to stateQtdepend on state Qt−1. Formally, whenIt = 0 (i.e., the current mutation is in a cloud):
Pr(Qt=j|Qt−1=i,It−1=f)=
A
B
C
D
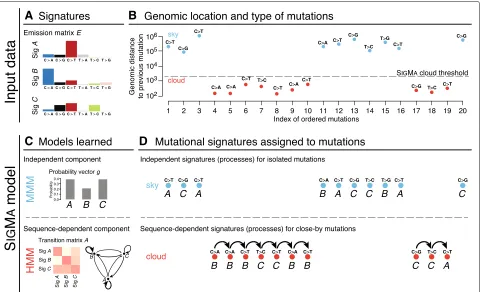
Fig. 1Overview of the SIGMAmodel. The input data consists of (a) a set of predefined signatures that form an emission matrixE(here, for simplicity, represented over six mutation types) and (b) a sequence of mutation categories from a single sample and a distance threshold separating sky and cloud mutation segments.cThe SIGMAmodel has two components: (top) a multinomial mixture model (MMM) for isolated sky mutations and (bottom) an extension of a hidden Markov model (HMM) capturing sequential dependencies between close-by cloud mutations; all model parameters are learned from the input data in an unsupervised manner.dSIGMAfinds the most likely sequence of signatures that explains the observed mutations in sky and clouds
The probability of the initial state depends only on the starting probabilities of the signatures, such that Pr(Q1=i)=πi.
The transitions between the sky segment indicator It only depends on the previous indicatorIt−1, i.e.,
Pr(It=j|It−1=i)=Bij, (3)
where Bis the 2×2 transition matrix between the sky and cloud segments. Note thatB implicitly governs the length of those segments and can be learned directly from observed data. The probability of starting in a sky/cloud state is given by Pr(I1 = i) = ρi, where ρ is a 2 ×1 starting probability vector. Finally, given the stateQt, each observationOtis independent of all other variables, i.e.,
Pr(Ot=j|Qt=i)=Eij. (4)
Model training
We learn the SIGMAmodel parameters from data using the Baum-Welch expectation-maximization algorithm with random initialization. We then compute Viterbi paths—the most likely sequence of states that generated
the data—to assign mutations to signatures and compute signatureexposures(i.e., signature frequency per sample). In practice, we find that the assignments are robust with respect to the random initialization used in the learning process; on average, over 95% of mutations are assigned to the same signature when compared to the majority assign-ments in 31 random initialization runs of SIGMA, and the standard errors of the presented results are small with respect to the random initializations.
Rather than model the mutations in a cohort of can-cer genomes with a single SIGMA, we train a model per sample. The motivation for this approach comes from the assumptions of earlier methods (e.g., [5]) that signature exposures are different across samples.
1, 2, 3, 5, 6, 8, 13, 17, 18, 20, 26, and 30. For the other meta-parameter, we perform model selection and evaluate the performance of each choice using the log-likelihood of the model on held-out data. To this end, we use a leave-one-out cross-validation scheme leaving one of the chromosomes out. We report the median SIGMAheld-out likelihood across the different initializations. The results are summarized in Fig. 2a, and accordingly, we set the distance threshold to 2000 bp at which the held-out log-likelihood was maximized. Thus, a mutation whose flank-ing mutations (if any) are more than 2000 bp away is called
sky; otherwise, the mutation is considered to be within acloud.
We note that while SIGMAalways models the mutations in sky as being independent from one another, the Marko-vian component of SIGMAlearns whether the mutations in clouds are sequence dependent or independent. In practice, approximately 71% of mutations in clouds are found to be sequence dependent according to the most likely sequence of mutation events.
Software availability
We implemented SIGMAin Python 3. The code is publicly available athttps://github.com/lrgr/sigma. On average, it takes approximately 8 seconds to train SIGMAon a single sample of breast cancer whole genome, learning a total of 146 model parameters.
Data
We analyzed 3,479,652 mutations in the cohort of 560 breast cancer (BRCA) whole genomes previously analyzed by Nik-Zainal et al. [24]. Each patient has an average of 208.2 clouds containing an average of 2.33 mutations, with 271,492 total mutations in clouds(8%)and 3,208,160 total mutations in sky(92%).
We also analyzed single base substitutions from the International Cancer Genome Consortium Data Por-tal [25] in 160 pancreatic cancer (PACA), 151 chronic lymphocytic leukemia (CLLE), and 241 malignant lym-phoma (MALY) whole-cancer-genome sequences. The PACA data is from ICGC release 25 (PACA-AU), and we restricted to the sample per patient with the most muta-tions, and we removed patients where all samples had fewer than 500 mutations. We analyzed COSMIC signa-tures 1, 2, 3, 5, 6, and 13 in the PACA dataset. The CLLE and MALY data is from ICGC release 27 (CCLE-ES and MALY-DE) and is also restricted to the sample with the most mutations per patient. We analyzed COSMIC signa-tures 1, 2, 5, 9, and 13 in the CLLE dataset and COSMIC signatures 1, 2, 5, 9, 13, and 17 in the MALY dataset.
To compare SIGMAto NMF, we recomputed the NMF assignments of signatures to mutations used by Morganella et al. [19] following their maximum likelihood approach. We downloaded the gene expression data for 266 BRCA samples from Table S7 in Nik-Zainal et al. [24].
A
B
C
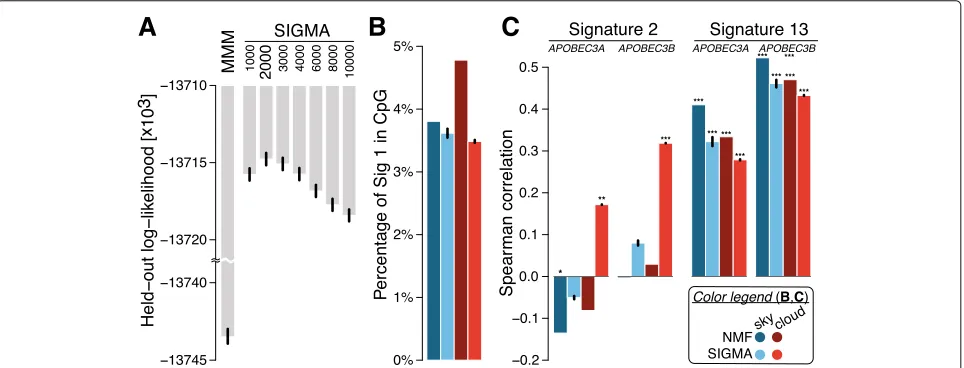
Fig. 2 aComparative assessment of model performance on held-out data for MMM and SIGMAacross different distance thresholds. SIGMAat a threshold of 2000 bp shows the best performance by maximizing the log-likelihood (they-axis has a customized scale with a scale break).b
Comparison of fraction of signature 1 mutations found in CpG islands in sky and clouds. Both NMF and SIGMAshow significant depletion of signature 1 in CpG islands with respect to randomized data, with SIGMAexhibiting more pronounced depletions, particularly in clouds. We performed 1000 permutations of signature assignments preserving mutation trinucleotide context within each sample. We used a one-sided Wilcoxon signed-rank test to compare the observed and randomized numbers of signature 1 in CpG islands.cSpearman correlation comparison ofAPOBEC3A/B
expression with signature 2 and 13 activities across samples. For signature 2, the mutation counts in clouds with SIGMAare positively correlated with
For replication timing analysis, we downloaded percent-age normalized replication time estimates from Repli-seq data in the MCF-7 cell line from the ENCODE project [26], and we split them into deciles and counted sky and cloud mutations in each decile. All analyses related to replication time were corrected for genomic size by accounting for unknown (N) bases. The MCF-7 cell line was chosen as it most closely represents breast cancers (see Morganella et al. [19] for details). The CpG islands’ coordinates were downloaded from the UCSC Genome Browser [27] and gene annotations from the ENSEMBL database (release 60) [28].
We evaluated inferred signature assignments to muta-tions in part using clinical and demographic features of each of the 560 cancers. We downloaded clinical and demographic data from Table S1 in Nik-Zainal et al. [24], restricting our analysis to those features that are mea-sured in at least 85% of the patients (omitting gender since the cohort is> 99% female): age, tumor grade, estrogen-receptor (ER) status, progesterone-estrogen-receptor (PR) status, and HER2 status. We imputed missing data using the mean.
Results
In order to capture the sequential dependencies among mutation signatures, we propose a hidden Markov mod-eling framework. Within this framework, the identity of the mutation signature underlying a given mutation depends (through conditional probability) on the iden-tity of the signature that yielded the preceding mutation in the genome. This modeling approach is motivated by earlier work that has shown that the mutations in localized clusters are often found to be from the same signatures [19, 21], thus suggesting a sequential depen-dency among mutation signatures. However, the majority of mutations in the cancer genome are hundreds of thou-sands of base pairs from the nearest mutation, suggesting that this dependency only manifests on small, localized regions of the cancer genome. To account for this com-plexity, we develop a composite model, SIGMA, that can infer the sequential dependencies among mutation sig-natures within localized densely mutated regions. We train our model and apply it to 560 breast cancer whole genomes previously analyzed in [24], partitioning each tumor’s mutation intosky(isolated mutations) andclouds
(groups of close-by mutations). The model is sketched in Fig. 1; full details on the model, its training, mutation partitioning, and data appear in the “Methods” section.
SIGMAuncovers sequential dependency between mutation signatures and leads to stronger associations with related biological signals
To assess the utility of SIGMA in capturing sequential dependencies, we compare it to a baseline probabilistic
model with no sequential dependencies. Since the state-of-the-art method for inferring mutation signatures, non-negative matrix factorization (NMF), is non-probabilistic, we use a related multinomial mixture model (MMM) as our baseline. The model parameters are learned so as to maximize the likelihood of the model using expectation maximization. Both SIGMA and MMM were applied to each sample separately, fixing the 12 COSMIC signatures previously found to be active in breast cancer (see the “Methods” section for details).
Figure 2a summarizes the performance of the mod-els in cross-validation on a breast cancer dataset of 560 genomes. We draw two conclusions from these results. First, there is a significant sequential dependency among the mutation signatures within clouds, as the variants of SIGMA all outperform the baseline MMM. Second, the sequential dependency is strongest for mutations within 1000–4000 bases of one another; SIGMAachieves the highest held-out log-likelihood in this range using a distance threshold of 2000 bp. Thus, we adopt the threshold of 2000 bp for the remainder of our exper-iments. Following previous studies that indicated that certain cloud-like regions are formed by a single muta-tional process [19], we also tested a variant of our model in which a single signature is allowed within a cloud, reflecting the hypothesis that each cloud was formed in a single sweep. SIGMAoutperformed this vari-ant in log-likelihood on held-out data (−13,714,498 vs.
−13,725,785). It also outperformed a variant in which only APOBEC signatures 2 and 13 (potentially inter-spersed by sky mutations) are allowed within clouds (log-likelihood of−13,718,394), supporting the greater flexi-bility our model allows within those regions. A summary of the performance of the models in cross-validation on additional cancer types is presented in Additional file1: Figure S2, where it is shown that SIGMAoutperforms the baseline MMM.
signature 1 in those regions after correction for trinu-cleotide context of mutations. While both models shows significant depletion of signature 1 in CpG islands, SIGMA exhibits more pronounced depletions, especially in clouds (Fig.2b).
APOBEC enzymes are another relatively well-understood source of mutations in cancer. The APOBECs deaminate cytosines in single-stranded DNA, prefer-entially at TpC sequence context and are thus believed to be associated with signatures 2 and 13. In particular,
APOBEC3AandAPOBEC3Bare among the main factors causing mutations in human cancers and specifically implicated in inducing clustered mutations (kataegis) [31–33], prompting us to test for an association between
APOBEC3A/B expression and the number of muta-tions attributed to signatures 2 and 13. Surprisingly, the NMF-based mutation assignments show no or nega-tive correlation between signature 2 and APOBEC3A/B
expression both in sky and clouds, and a statistically significant correlation is observed only with signature 13. In contrast, using mutation assignments from SIGMA, we find that the signature 2 mutation counts in clouds show positive correlations with the APOBEC3A and
APOBEC3B expression (P = 5 × 10⁻³ and 1 × 10⁻⁷, respectively; Fig. 2c). Signature 13 mutations remain positively correlated in both sky and clouds.
Sky and clouds show distinct mutations patterns
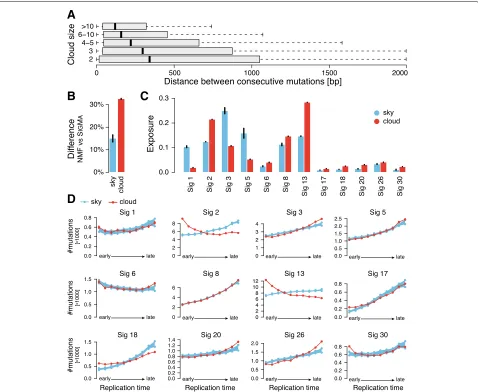
In SIGMA, clouds are defined as dense groups of muta-tions, but unlike the definition of clustered mutations [21] or processive groups [19], we make no restriction on consecutive mutations being of the same type and/or being on the same strand. We also do not require that the number of mutations in a cloud is large or filter out nearby mutations. Despite our liberal 2000-bp cut-off for maximal distance of two constitutive mutations in a cloud, median distances between mutations in the same cloud are less than 500 bp independently of its size (number of mutations in a cloud; see Fig. 3a) while the median distance between mutations in the sky is more than 150,000 bp. As expected, the differences in muta-tion assignments between SIGMA and NMF are much higher for the mutations that belong to clouds than to sky (Fig.3b).
Interestingly, clouds and sky show quite different distri-bution of signature exposures, even though they have sim-ilar nucleotide and trinucleotide content (Additional file1: Figure S3). For example, clouds are strongly enriched in signatures 2, 13, 18, 21, and 30 (log2fold change> 0.75) but depleted in signatures 1, 3, and 5 (Fig.3c).
The above observations suggest that the properties of clouds and sky are quite different. Moreover, we observed that sky mutations show a gradual increase of muta-tions toward late replication regions (67% total increase),
while cloud mutations show an increase towards both early and late replication regions (27% and 34% increase with respect to the lowest level, respectively; see Addi-tional file1: Figure S4). Therefore, we analyzed the distri-bution of mutations assigned to individual signatures with respect to replication time considering clouds and sky as two potentially different subpopulations. With the excep-tion of mismatch repair signature 6, all signatures within sky are enriched in late replication regions (Fig.3d). Some signatures, such as signatures 1, 5, and 8, show no appre-ciable differences in the trends between sky and clouds; however, many other signatures do. The most striking difference in the trends is displayed by the APOBEC signatures 2 and 13. Previous studies that analyzed the relation of APOBEC with replication time appeared to be contradictory. Kazaonov et al. [34] reported enrich-ment of APOBEC mutations in early-replicating regions and hypothesized that this unusual mutagenesis profile may be associated with a higher propensity to form single-strand DNA substrates for APOBEC enzymes in early-replicating regions. However, Morganella et al. [19] found that signature 2 is enriched in late-replicating regions sug-gesting that APOBEC mutations assigned to signature 2 are more efficiently repaired in early-replicating regions. They were also surprised to find that signature 13 dif-fered from signature 2 and showed no dependency of mutation frequency on replication time (see also Addi-tional file 1: Figure S5). Our analysis reconciles these two results and demonstrates that while APOBEC muta-tions associated with clouds show properties consistent with these reported by Kazaonov et al., the sky associ-ated ones show the usual enrichment in late-replicating regions. The cumulative mutation profile depends on the individual characteristics of the sky-associated and cloud-associated subpopulations and their relative abundance. Interestingly, the proportion of cloud-associated muta-tions relative to sky-associated mutamuta-tions is higher for signature 13 than for signature 2 (Fig. 3c) contributing to the differences in cumulative trends of these two sig-natures reported by Morganella et al. (Additional file1: Figure S5).
A
B
D
C
Fig. 3 aDistribution of distance between consecutive mutations in clouds of various sizes (number of mutations in a cloud).bDifference between NMF and SIGMAin mutation signatures assigned to mutations is higher for cloud mutations.cComparison of exposure to mutation signatures in sky and cloud regions based on SIGMAsignature assignments.dFrequency distribution of the 12 mutation signatures (assigned by SIGMA) over replication time. The red line is the distribution over replication time from early to late for mutations in clouds. The blue line is the distribution of trends for sky mutations downsampled to the number of mutations found in clouds. The sampling was repeated 1000 times, and the 95% confidence intervals of the downsampled sky mutation frequencies are shown. All results show mean values with standard error of the mean (small vertical bars) from 31 random initializations of SIGMA
Overall, these analyses demonstrate that some signa-tures have very different properties when considered in the context of clouds versus sky, suggesting that the inter-play of mutational processes that underlines the same signature in sky and in clouds might be different.
Transition probabilities reveal associations between signatures
Next, we asked if the transition probabilities can provide additional insights into the etiology of mutation signa-tures. Since the number of cloud mutations in individual patients is small, we used cumulative transition prob-abilities obtained by counting the transitions between
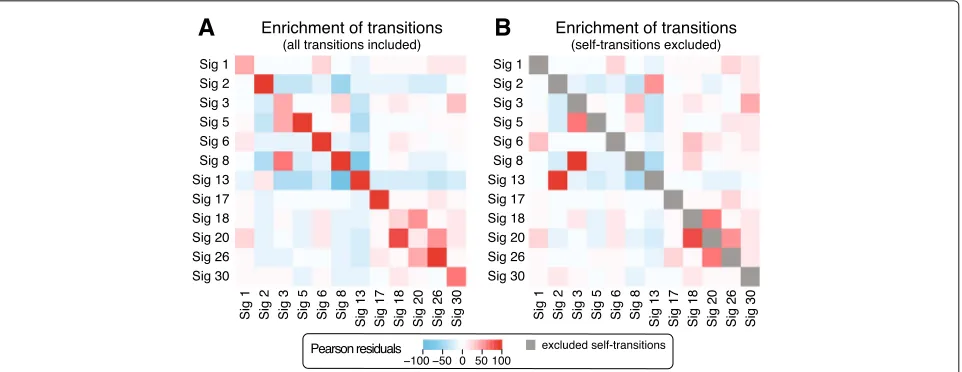
signatures in clouds across all samples. We quantified the enrichment of transition probabilities between signatures using Pearson residuals. The most frequent transitions are from each signature to itself (Fig. 4a). Correcting for this enrichment, we then considered the enrichment between pairs of different signatures (Fig.4b). Ten pairs of signatures showed Pearson residuals above 10 in both transition directions and are discussed below.
A
B
Fig. 4Enrichment of transition frequencies between mutation signatures in sequence-dependent cloud segments across all samples.aEnrichment represented as Pearson residuals between observed and expected signature frequencies shows a strong enrichment of self-transitions.b
Enrichment computed in the same way but ignoring self-transitions to correctly estimate the enrichment of transitions between different signatures while accounting for the enrichment for self-transitions. Mean values of enrichment from random initializations of SIGMAare shown
mutagenic processes and are often found in the same samples. Interestingly, there is also a strong association between signatures 3 and 8 suggesting a relation between signature 8 and homologous recombination deficiency that was shown to underlie signature 3 [35] and is consis-tent with the findings of [24].
We also observed an enrichment in the transitions between signatures 18 and 30 suggesting a possible relation between these less understood signatures. Fur-ther supporting this relationship, we found that these signatures significantly co-occur in the same patients (P<2.2×10⁻¹⁶for clouds based on the Fisher exact test where signatures with exposure at least 0.01 are consid-ered to be present; co-occurrence is not significant in sky). Previous studies linked a new signature that is very similar to signature 18 to bialleic deactivation ofMUTYH, which is involved in the base excision repair in response to oxida-tive damage [36–38]. Specifically,MUTYH is involved in repairing the damage caused by 8-oxoguanine—one of the most common DNA lesions resulting from the presence of reactive oxygen species (ROS). If not corrected, it leads to G-to-T transversion. Recent studies provided further support for the relation of signature 18 and ROS [39].
As for signature 30, recent studies linked it to muta-tions in theNTHL1gene [12]. Similarly to the MUTYH
gene,NTHL1is a glycosylase that is also involved in the repair of oxidative DNA damage. UnlikeMUTYH which is involved in the repair of oxidized purines, NTHL1is involved in the removal of oxidative pyrimidine lesions. If not corrected, oxidized, deaminated cytosines are a source of C-to-T transitions in vivo [40] which is consistent with the mutational profile of signature 30.
Finally, we also observed enriched transitions between signature 18 and the DNA mismatch repair (MMR) sig-nature 20. This is consistent with the growing under-standing that the MMR pathway is also important for the response to oxidative damage. In fact, mismatch repair-deficient mice show susceptibility to oxidative stress-induced intestinal carcinogenesis [41]. In addition, a study by Colussi et al. [42] showed that baseline 8-oxoG levels were higher in DNA extracted fromMSH2- andMLH1 -deficient cell lines. The relations between the remaining signature pairs with value of Pearson residuals above 10— (6,1), (17,26) and (8,30)—remain to be investigated.
These observations indicate that the analysis of transi-tion probabilities can be extremely valuable in shedding light on the etiology of less understood signatures.
Evaluation against clinical and demographic data
To show the utility of our model in the clinical setting, we evaluated the assignment of mutations to their underly-ing signatures usunderly-ing clinical and demographic data. Our analysis is based on the intuition that more accurate assignments will have higher correlation with clinical and demographic data, since multiple signatures have been shown to correspond to exogenous factors such as the patient’s age at diagnosis [17].
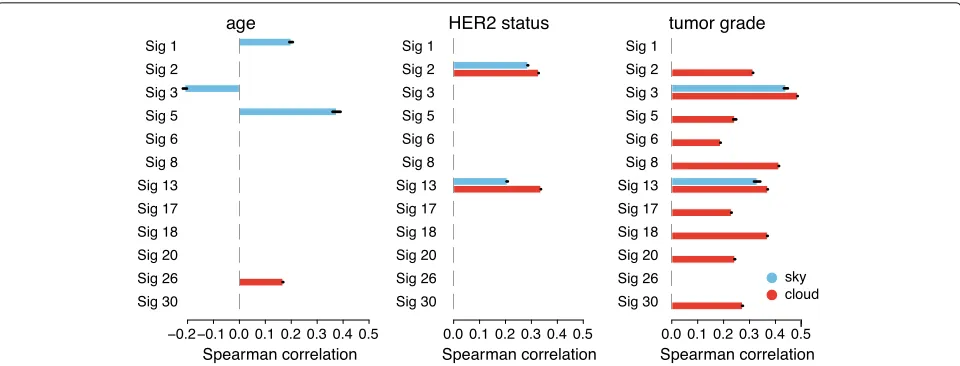
Fig. 5Spearman correlation coefficients between demographic or clinical features and mutations attributed to each signature in sky and cloud regions. Only significant correlations with ap-value cutoff of 0.001 are shown. Barplots show mean correlations with standard error of the mean (small black bars) from 31 random initializations of SIGMA
clinical features that are correlated with patient muta-tions in clouds from those in sky. First, we evaluated the signatures with known etiologies that match our clini-cal dataset. For example, signatures 1 and 5 have been hypothesized to be active in normal cells and “clock-like” due to their correlation with the age of the patient [17]. Reassuringly, we found statistically significant association between the number of mutations attributed to signatures 1 and 5 and age and only found these correlations for mutations in sky (especially for signature 5 whose corre-lation with age is much stronger than previously reported in BRCA [17]). As another example, signatures 2 and 13 display patterns of mutations linked to APOBEC pro-teins and are correlated with APOBEC activity, which has been linked toHER2expression in breast cancers [43–45]. Specifically, HER2 signaling has been shown to elevate DNA replicative stress which, in turn, causes an overall increase in single-stranded DNA during replication [46] increasing opportunity for APOBEC mutations and might also induce APOBEC expression [45]. Our results also capture this relationship, with statistically significant asso-ciations between mutations attributed to both APOBEC signatures and HER2 status in both sky and clouds.
We also found significant associations of cloud muta-tions in most of the signatures with tumor grade. The numerous associations between cloud mutations and tumor grade might be driven in part by the general associ-ation of high-grade tumors with mutassoci-ation burden (Spear-man correlation of 0.48 for sky and 0.49 for clouds) as non-random distribution of mutations in highly mutated genomes can lead to emergence of clouds. Interestingly, in contrast to mutation enrichment in clouds, the increased mutation burden in sky can be attributed mostly to two
signatures: 3 and 13. Since signature 3 is associated with HRD [35], which leads to defective DNA double-strand break repair, this might be an additional reason for the observed enrichment of cloud mutations [47–49]. Inter-estingly, only sky-associated mutations of signature 13 but not signature 2 show correlation with tumor grade. This is consistent with the recent finding of the induction of
APOBEC3B in response to DSB [50]. In addition, pre-vious studies demonstrated a relation between increased
APOBEC3B enzymatic activity and tumor grade [44]. Consistently, as shown in Fig.2c,APOBEC3Bexpression correlates with sky mutations attributed to signature 13 but not to signature 2. We report additional significant correlations for final ER and PR status in Additional file1: Figure S7.
Finally, we compared the overall correlation of the num-ber of mutations attributed to the 12 signatures computed with our model and NMF with the clinical and demo-graphic data, taking the overall mutation counts into account for both models. To this end, we computed a sin-gle correlation using canonical correlation analysis (CCA) [51]. The obtained (Pearson) correlation was higher for SIGMAthan NMF (0.676 vs. 0.665). These results provide further evidence that by using sequential information, SIGMA is better able to assign mutations to signatures compared to previous models.
Discussion
Our analysis reinforced the idea that cloud (close-by) mutations have distinct properties from sky (isolated) mutations in terms of signature exposures (Fig.3c), bio-logical correlates (Figs. 2b, c and 3d), and clinical cor-relates (Fig. 5). While some of the differences between these two mutation groups have been appreciated before, e.g., [21], our analyses bring novel insights. Interest-ingly, mutations that are assigned to the same signatures can have distinct properties when localized in clouds versus sky suggesting that they correspond to differ-ent subpopulations. These subpopulations, despite being assigned the same signature, might correspond to differ-ent combinations of causes. As a case in point, we found that APOBEC-associated mutations have different prop-erties with respect to replication time depending on their assignment to sky versus clouds.
To verify that our categorization of sky mutations does not suffer from a bias toward mutations in difficult-to-map regions, we downloaded regions of low difficult-to-mappability from [52, 53], which were previously used for mutation signature studies [21, 54]. We find that only 4523 of 3.4 million mutations (approximately 0.1%) fall in these difficult-to-map regions and conclude that this will not lead to a systematic bias that could change the conclusions of our study. Future research could further examine the partition to sky and clouds, potentially introducing a com-plete generative model that accounts also for the distances between mutations.
While evaluating the predictions of SIGMA using clin-ical and demographic data, we found a statistclin-ically sig-nificant anti-correlation of signature 3 activity (associated with homologous recombination repair deficiency [HRD]) and patient age. We hypothesize that this is in part a con-sequence of germline variants predisposing to HRD (such asBRCA1mutations; see [55]) leading to earlier onset of breast cancer. In fact, the correlation between signature 3 activity and age drops from−0.22 to−0.13 when remov-ing patients with BRCA1 or BRCA2 germline variants as identified by Nik-Zainal et al. [24]. Thus, in general, mutation signatures whose activity is anti-correlated with age may indicate that the signature’s etiology includes predisposing germline variants.
The basic HMM model presented here can be extended and refined in various ways. In this work, we focused on modeling sequential dependency of previously validated mutational signatures from COSMIC [11]. One extension to our model, in case no prior knowledge on relevant mutation signatures is available, is to learn signatures and transitions simultaneously across multiple samples. Another possible refinement is to cast it in a Bayesian framework and add prior distributions to the model parameters. This refinement will be especially important when training the model on different cancer types where the number of samples is low.
Conclusions
We presented the first probabilistic model of sequen-tial dependency for mutation signatures, SIGMA. We first showed that models of sequential dependency of muta-tion signatures have greater predictive power for held-out data than models that ignore this dependency. Next, we found that by modeling sequential dependencies previ-ously observed among mutations [18–21], we improved the estimation of mutation-to-signature assignment and revealed new insights into the genomic factors that bias mutational process activity. In particular, our analysis rec-onciled two apparently contradictory results showing that while APOBEC mutations associated with clouds show properties consistent with these reported by Kazaonov et al. [34], the sky-associated ones show the usual enrichment in late-replicating regions as observed by Morganella et al. [19]. The results obtained with SIGMA shed also new light on the etiology of signatures 18 and 30.
The ability to correctly determine which mutational processes generated a specific mutation is of primary importance for understanding of the emergence of tumors. For example, previous studies provided evidence that APOBEC activity is responsible for the generation of helical domain hotspot mutations in thePIK3CAgene in papilloma virus-driven tumors [56]. Computational tools like SIGMA provide the means for finding such rela-tionships between mutational processes and gene-level cancer drivers. A more precise assignment of mutations to signatures also allows for a more precise estimation of signature exposures and, consequently, can help to uncover relations between mutational processes and clin-ical and demographclin-ical phenotypes that might be difficult to infer if the signature exposure is low and signature assignment noisy.
Additional file
Additional file 1: Supplemental figures S1, S2, S3, S4, S5, S6, and S7. (PDF 226 kb)
Abbreviations
BRCA: Breast cancer; CLLE: Chronic lymphocytic leukemia; HMM: Hidden Markov model; HRD: Homologous recombination repair deficiency; ICGC: International Cancer Genome Consortium; MMM: Multinomial mixture model. MALY: Malignant lymphoma; NMF: Non-negative matrix factorization; PACA: Pancreatic cancer; SIGMA: Signature Markov model
Acknowledgements
MDML gratefully acknowledges Peter Park, Jennifer Listgarten, and Nicolo Fusi for the discussions regarding mutation signatures and Michael Hoffman for the discussions regarding dynamic Bayesian networks.
Authors’ contributions
Funding
XH, DW, YK, and TMP are supported by the Intramural Research Programs of the National Library of Medicine (NLM), National Institutes of Health, USA. RS was supported by Len Blavatnik and the Blavatnik Family Foundation.
Availability of data and materials
The datasets used for and generated during this study are linked to and/or available athttps://github.com/lrgr/sigma.
Ethics approval and consent to participate
Not applicable.
Consent for publication
Not applicable.
Competing interests
MDML is a paid consultant for Microsoft. The remaining authors declare that they have no competing interests.
Author details
1National Center for Biotechnology Information, National Library of Medicine,
National Institutes of Health, 8600 Rockville Pike, Bethesda 20894, USA.2Center
for Bioinformatics and Computational Biology, University of Maryland, 8125 Paint Branch Dr, College Park 20740, USA.3School of Computer Science, Tel
Aviv University, 69978 Tel Aviv, Israel.
Received: 17 January 2019 Accepted: 12 July 2019
References
1. Cheung-Ong K, Giaever G, Nislow C. Dna-damaging agents in cancer chemotherapy: serendipity and chemical biology. Chem Biol. 2013;20(5): 648–59.https://doi.org/10.1016/j.chembiol.2013.04.007.
2. Gavande NS, VanderVere-Carozza PS, Hinshaw HD, Jalal SI, Sears CR, Pawelczak KS, Turchi JJ. DNA repair targeted therapy: the past or future of cancer treatment? Pharmacol Ther. 2016;160:65–83.https://doi.org/10. 1016/j.pharmthera.2016.02.003.
3. Cortes-Ciriano I, Lee S, Park W-Y, Kim T-M, Park PJ. A molecular portrait of microsatellite instability across multiple cancers. Nat Commun. 2017;8: 15180.https://doi.org/10.1038/ncomms15180.
4. Alexandrov LB, Nik-Zainal S, Wedge DC, Aparicio S, Behjati S, et al. Signatures of mutational processes in human cancer. Nature. 2013;500(7463):415–21.https://doi.org/10.1038/nature12477. 5. Alexandrov LB, Nik-Zainal S, Wedge DC, Campbell PJ, Stratton MR.
Deciphering signatures of mutational processes operative in human cancer. Cell Rep. 2013;3(1):246–259.https://doi.org/10.1016/j.celrep.2012. 12.008.
6. Fischer A, Illingworth CJ, Campbell PJ, Mustonen V. Emu: probabilistic inference of mutational processes and their localization in the cancer genome. Genome Biol. 2013;14(4):1–10. https://doi.org/10.1186/gb-2013-14-4-r39.
7. Kasar S, Kim J, Improgo R, Tiao G, Polak P, et al. Whole-genome sequencing reveals activation-induced cytidine deaminase signatures during indolent chronic lymphocytic leukaemia evolution. Nat Commun. 2015;6:8866.https://doi.org/10.1038/ncomms9866.
8. Shiraishi Y, Tremmel G, Miyano S, Stephens M. A simple model-based approach to inferring and visualizing cancer mutation signatures. PLoS Genet. 2015;11(12):1005657.https://doi.org/10.1371/journal.pgen. 1005657.
9. Rosales RA, Drummond RD, Valieris R, Dias-Neto E, Silva ITD. signeR: an empirical Bayesian approach to mutational signature discovery. Bioinformatics. 2016;33(1):8–16.https://doi.org/10.1093/bioinformatics/ btw572.
10. Huang X, Wojtowicz D, Przytycka TM. Detecting presence of mutational signatures in cancer with confidence. Bioinformatics. 2018;34(2):330–7.
https://doi.org/10.1093/bioinformatics/btx604.
11. Forbes SA, Beare D, Boutselakis H, Bamford S, Bindal N, et al. Cosmic: somatic cancer genetics at high-resolution. Nucleic Acids Res. 2017;45(D1):777–83.https://doi.org/10.1093/nar/gkw1121. 12. Drost J, Boxtel RV, Blokzijl F, Mizutani T, Sasaki N, et al. Use of
CRISPR-modified human stem cell organoids to study the origin of
mutational signatures in cancer. Science. 20173130.https://doi.org/10. 1126/science.aao3130.
13. Zou X, Owusu M, Harris R, Jackson SP, Loizou JI, Nik-Zainal S. Validating the concept of mutational signatures with isogenic cell models. Nat Commun. 2018;9(1):1744.https://doi.org/10.1038/s41467-018-04052-8. 14. Davies H, Glodzik D, Morganella S, Yates LR, Staaf J, et al. HRDetect is a
predictor of BRCA1 and BRCA2 deficiency based on mutational signatures. Nat Med. 2017;23(4):517–25.https://doi.org/10.1038/nm.4292. 15. Alexandrov LB, Ju YS, Haase K, Loo P, Martincorena I, et al. Mutational
signatures associated with tobacco smoking in human cancer. Sci. (New York, N.Y.) 2016;354(6312):618–22.https://doi.org/10.1126/science. aag0299.
16. Nik-Zainal S, Kucab JE, Morganella S, Glodzik D, Alexandrov LB, et al. The genome as a record of environmental exposure. Mutagenesis. 2015;30(6): 763–70.https://doi.org/10.1093/mutage/gev073.
17. Alexandrov LB, Jones PH, Wedge DC, Sale JE, Campbell PJ, et al. Clock-like mutational processes in human somatic cells. Nat Genet. 2015;47(12):1402–7.https://doi.org/10.1038/ng.3441.
18. Nik-Zainal S, Alexandrov LB, Wedge DC, VanLoo P, Greenman CD, et al. Mutational processes molding the genomes of 21 breast cancers. Cell. 2012;149(5):979–93.https://doi.org/10.1016/j.cell.2012.04.024. 19. Morganella S, Alexandrov LB, Glodzik D, Zou X, Davies H, et al. The
topography of mutational processes in breast cancer genomes. Nat Commun. 2016;7:11383.https://doi.org/10.1038/ncomms11383. 20. Haradhvala NJ, Polak P, Stojanov P, Covington KR, Shinbrot E, et al.
Mutational strand asymmetries in cancer genomes reveal mechanisms of dna damage and repair. Cell. 2016;164(3):538–49.https://doi.org/10. 1016/j.cell.2015.12.050.
21. Supek F, Lehner B. Clustered mutation signatures reveal that error-prone DNA repair targets mutations to active genes. Cell. 2017;170(3): 534–547.e23.https://doi.org/10.1016/j.cell.2017.07.003.
22. Murphy KP. Dynamic Bayesian networks: representation, inference and learning. Berkeley: University of California; 2002.
23. COSMIC Mutational Signatures. Catalogue of comatic mutations in cancer. Version 2.https://cancer.sanger.ac.uk/cosmic/signatures_v2. Accessed 20 Aug 2018.
24. Nik-Zainal S, Davies H, Staaf J, Ramakrishna M, Glodzik D, et al. Landscape of somatic mutations in 560 breast cancer whole-genome sequences. Nature. 2016;534(7605):47–54.https://doi.org/10.1038/nature17676. 25. Zhang J, Bajari R, Andric D, Gerthoffert F, Lepsa A, et al. The
International Cancer Genome Consortium Data Portal. Nat Biotechnol. 20191–3.https://doi.org/10.1038/s41587-019-0055-9.
26. Davis CA, Hitz BC, Sloan CA, Chan ET, Davidson JM, et al. The Encyclopedia of DNA elements (ENCODE): data portal update. Nucleic Acids Res. 20171081.https://doi.org/10.1093/nar/gkx1081.
27. Karolchik D, Hinrichs AS, Furey TS, Roskin KM, Sugnet CW, et al. The UCSC Table Browser data retrieval tool. Nucleic Acids Res. 2004;32:493–6.
https://doi.org/10.1093/nar/gkh103.
28. Zerbino DR, Achuthan P, Akanni W, Amode MR, Barrell D, et al. Ensembl 2018. Nucleic Acids Res. 20171098.https://doi.org/10.1093/nar/gkx1098. 29. Pfeifer GP. Mutagenesis at methylated CpG sequences. Curr Top
Microbiol Immunol. 2006;301:259–81.
30. Deaton AM, Bird A. CpG islands and the regulation of transcription. Gene Dev. 2011;25(10):1010–22.https://doi.org/10.1101/gad.2037511. 31. Burns MB, Lackey L, Carpenter MA, Rathore A, Land AM, et al. APOBEC3B
is an enzymatic source of mutation in breast cancer. Nature. 2013;494(7437):366.https://doi.org/10.1038/nature11881.
32. Burns MB, Temiz NA, Harris RS. Evidence for APOBEC3B mutagenesis in multiple human cancers. Nat Genet. 2013;45(9):977–83.https://doi.org/ 10.1038/ng.2701.
33. Taylor BJ, Nik-Zainal S, Wu YL, Stebbings LA, Raine K, et al. DNA deaminases induce break-associated mutation showers with implication of APOBEC3B and 3A in breast cancer kataegis. eLife. 2013;2(0):00534.
https://doi.org/10.7554/elife.00534.
34. Kazanov M, Roberts S, Polak P, Stamatoyannopoulos J, Klimczak L, Gordenin D, Sunyaev S. APOBEC-induced cancer mutations are uniquely enriched in early-replicating, gene-dense, and active chromatin regions. Cell Rep. 2015;13(6):1103–9.https://doi.org/10.1016/j.celrep.2015.09.077. 35. Polak P, Kim J, Braunstein LZ, Karlic R, Haradhavala NJ, Tiao G,
Leshchiner I, Lander ES, Golub TR, Zick A, Orthwein A, Lawrence MS, Batra RN, Caldas C, Haber DA, Laird PW, Shen H, Ellisen LW, D’Andrea AD, Chanock SJ, Foulkes WD, Getz G. A mutational signature reveals alterations underlying deficient homologous recombination repair in breast cancer. Nat Genet. 2017.https://doi.org/10.1038/ng.3934. 36. Viel A, Bruselles A, Meccia E, Fornasarig M, Quaia M, Canzonieri V,
Policicchio E, Urso ED, Agostini M, Genuardi M, Lucci-Cordisco E, Venesio T, Martayan A, Diodoro MG, Sanchez-Mete L, Stigliano V, Mazzei F, Grasso F, Giuliani A, Baiocchi M, Maestro R, Giannini G, Tartaglia M, Alexandrov LB, Bignami M. A specific mutational signature associated with dna 8-oxoguanine persistence in MUTYH-defective colorectal cancer. EBioMedicine. 2017;20:39–49.https://doi.org/10.1016/j. ebiom.2017.04.022.
37. Scarpa A, Chang DK, Nones K, Corbo V, Patch A-M, et al. Whole-genome landscape of pancreatic neuroendocrine tumours. Nature.
2017;543(7643):65–71.https://doi.org/10.1038/nature21063. 38. Ohno M, Sakumi K, Fukumura R, Furuichi M, Iwasaki Y, et al.
8-oxoguanine causes spontaneous de novo germline mutations in mice. Sci Rep. 2014;4(1):4689.https://doi.org/10.1038/srep04689.
39. Petljak M, Alexandrov LB, Brammeld JS, Price S, Wedge DC, Grossmann S, Dawson KJ, Ju YS, Iorio F, Tubio JMC, Koh CC, Georgakopoulos-Soares I, Rodriguez-Martin B, Otlu B, O’Meara S, Butler AP, Menzies A, Bhosle SG, Raine K, Jones DR, Teague JW, Beal K, Latimer C, O’Neill L, Zamora J, Anderson E, Patel N, Maddison M, Ng BL, Graham J, Garnett MJ, McDermott U, Nik-Zainal S, Campbell PJ, Stratton MR. Characterizing mutational signatures in human cancer cell lines reveals episodic APOBEC mutagenesis. Cell. 2019;176(6):1282–94.
40. Kreutzer DA, Essigmann JM. Oxidized, deaminated cytosines are a source of c>t transitions in vivo. Proc Natl Acad Sci. 1998;95(7):3578–82.https:// doi.org/10.1073/pnas.95.7.3578.
41. Piao J, Nakatsu Y, Ohno M, Taguchi K-I, Tsuzuki T. Mismatch repair deficient mice show susceptibility to oxidative stress-induced intestinal carcinogenesis. Int J Biol Sci. 2013;10(1):73–9.https://doi.org/10.7150/ijbs. 5750.
42. Colussi C, Parlanti E, Degan P, Aquilina G, Barnes D, et al. The mammalian mismatch repair pathway removes dna 8-oxodGMP incorporated from the oxidized dNTP pool. Curr Biol. 2002;12(11):912–8.
https://doi.org/10.1016/s0960-9822(02)00863-1.
43. Roberts S, Lawrence MS, Klimczak LJ, Grimm SA, Fargo D, et al. An APOBEC cytidine deaminase mutagenesis pattern is widespread in human cancers. Nat Genet. 2013;45(9):2702.https://doi.org/10.1038/ng.2702. 44. Cescon DW, Haibe-Kains B, Mak TW. APOBEC3B expression in breast
cancer reflects cellular proliferation, while a deletion polymorphism is associated with immune activation. Proc Natl Acad Sci. 2015;112(9): 2841–6.https://doi.org/10.1073/pnas.1424869112.
45. Kanu N, Cerone M, Goh G, Zalmas L-P, Bartkova J, et al. DNA replication stress mediates APOBEC3 family mutagenesis in breast cancer. Genome Biol. 2016;17(1):185.https://doi.org/10.1186/s13059-016-1042-9. 46. Mazouzi A, Velimezi G, Loizou JI. DNA replication stress: causes,
resolution and disease. Exp Cell Res. 2014;329(1):85–93.
47. Roberts S, Sterling J, Thompson C, Harris S, Mav D, et al. Clustered mutations in yeast and in human cancers can arise from damaged long single-strand DNA regions. Mol Cell. 2012;46:424–35.https://doi.org/10. 1016/j.molcel.2012.03.030.
48. Shee C, Gibson JL, Rosenberg SM. Two mechanisms produce mutation hotspots at DNA breaks in Escherichia coli. Cell Rep. 2012;2:714–21.
https://doi.org/10.1016/j.celrep.2012.08.033.
49. Sakofsky C, Roberts S, Malc E, Mieczkowski P, Resnick M, Gordenin D, Malkova A. Break-induced replication is a source of mutation clusters underlying kataegis. Cell Rep. 2014;7:1640–8.https://doi.org/10.1016/j. celrep.2014.04.053.
50. Shimizu A, Fujimori H, Minakawa Y, Matsuno Y, Hyodo M, et al. Onset of deaminase APOBEC3B induction in response to DNA double-strand breaks. Biochem Biophys Rep. 2018;16:115–21.https://doi.org/10.1016/j. bbrep.2018.10.010.
51. Hotelling H. Relations between two sets of variates. Biometrika. 1936;28(3-4):321–77.https://doi.org/10.1093/biomet/28.3-4.321. 52. The ENCODE Project Consortium. An integrated encyclopedia of DNA
elements in the human genome. Nature. 489:57.https://doi.org/10.1038/ nature11247.
53. Kundaje A. A comprehensive collection of signal artifact blacklist regions in the human genome.http://mitra.stanford.edu/kundaje/akundaje/ release/blacklists/hg19-human/. Accessed 7 Dec 2018.
54. Tomkova M, Tomek J, Kriaucionis S, Schuster-Böckler B. Mutational signature distribution varies with DNA replication timing and strand asymmetry. Genome Biol. 2018;19:129. https://doi.org/10.1186/s13059-018-1509-y.
55. Riaz N, Blecua P, Lim RS, Shen R, Higginson DS, Weinhold N, Norton L, Weigelt B, Powell SN, Reis-Filho JS. Pan-cancer analysis of bi-allelic alterations in homologous recombination dna repair genes. Nat Commun. 2017;8(1):s41467–017-00921-w.https://doi.org/10.1038/ s41467-017-00921-w.
56. Henderson S, Chakravarthy A, Su X, Boshoff C, Fenton T. Apobec-mediated cytosine deamination links PIK3CA helical domain mutations to human papillomavirus-driven tumor development. Cell Rep. 2014;7(6):1833–41.https://doi.org/10.1016/j.celrep.2014.05.012.
Publisher’s Note